| Param | Original file | Final file |
|---|---|---|
| Filename | modeM0/AS1A09_145T01_9000003848_26654cztM0_level2.evt | modeM0/AS1A09_145T01_9000003848_26654cztM0_level2_quad_clean.evt |
| Size (bytes) | 608,950,080 | 100,399,680 |
| Size | 580.7 MB | 95.7 MB |
| Events in quadrant A | 3,688,579 | 657,778 |
| Events in quadrant B | 4,428,835 | 640,886 |
| Events in quadrant C | 3,730,810 | 632,154 |
| Events in quadrant D | 6,108,709 | 610,713 |
| Mode M0 | |||
|---|---|---|---|
| Quadrant | BADHDUFLAG | Total packets | Discarded packets |
| A | 0 | 15431 | 0 |
| B | 0 | 17500 | 0 |
| C | 0 | 15385 | 0 |
| D | 0 | 23073 | 0 |
| Mode M9 | |||
|---|---|---|---|
| Quadrant | BADHDUFLAG | Total packets | Discarded packets |
| A | 0 | 4 | 0 |
| B | 0 | 4 | 0 |
| C | 0 | 4 | 0 |
| D | 0 | 4 | 0 |
| Quadrant | Total seconds | Saturated seconds | Saturation percentage |
|---|---|---|---|
| A | 7163 | 39 | 0.544465% |
| B | 7164 | 331 | 4.620324% |
| C | 7163 | 122 | 1.703197% |
| D | 7163 | 333 | 4.648890% |
Noise dominated data is calculated using 1-second bins in cleaned event files. If a bin has >2000 counts, and if more than 50% of those come from <1% of pixels, then it is considered to be noise-dominated and hence unusable.
| Quadrant | # 1 sec bins | Bins with >0 counts | Bins with >2000 counts | High rate bins dominated by noise | Noise dominated (total time) | Noise dominated (detector-on time) | Marked lightcurve |
|---|---|---|---|---|---|---|---|
| A | 7588 | 7164 | 0 | 0 | 0.00% | 0.00% | 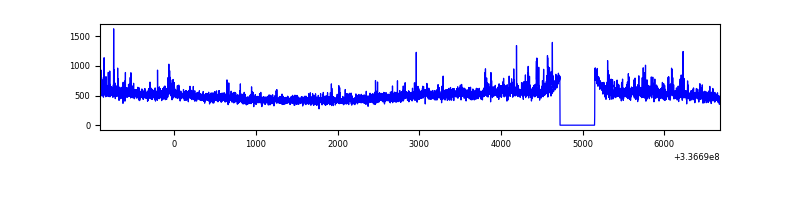 |
| B | 7589 | 7165 | 230 | 230 | 3.03% | 3.21% | 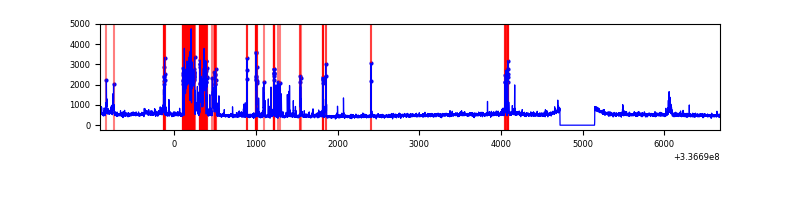 |
| C | 7588 | 7164 | 17 | 17 | 0.22% | 0.24% | 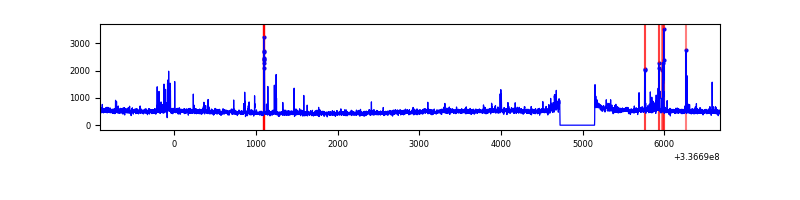 |
| D | 7588 | 7164 | 219 | 219 | 2.89% | 3.06% | 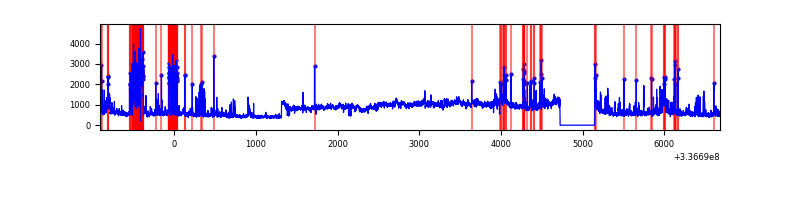 |
Top three noisy pixels from each quadrant. If the there are fewer than three noisy pixels in the level2.evt file, extra rows are filled as -1
| Pixel properties | Quadrant properties | ||||||
|---|---|---|---|---|---|---|---|
| Quadrant | DetID | PixID | Counts | Sigma | Mean | Median | Sigma |
| A | 0 | 13 | 212402 | 1163.45 | 898 | 881 | 181.8 |
| A | 13 | 254 | 11894 | 60.58 | 898 | 881 | 181.8 |
| A | 3 | 137 | 8098 | 39.7 | 898 | 881 | 181.8 |
| B | 10 | 245 | 890419 | 5282.03 | 879 | 859 | 168.4 |
| B | 3 | 112 | 31964 | 184.7 | 879 | 859 | 168.4 |
| B | 12 | 111 | 19823 | 112.6 | 879 | 859 | 168.4 |
| C | 15 | 208 | 147425 | 719.93 | 860 | 866 | 203.6 |
| C | 14 | 238 | 135043 | 659.1 | 860 | 866 | 203.6 |
| C | 3 | 233 | 47007 | 226.65 | 860 | 866 | 203.6 |
| D | 7 | 80 | 2273649 | 10669.34 | 856 | 832 | 213.0 |
| D | 2 | 250 | 202477 | 946.59 | 856 | 832 | 213.0 |
| D | 1 | 52 | 140870 | 657.38 | 856 | 832 | 213.0 |
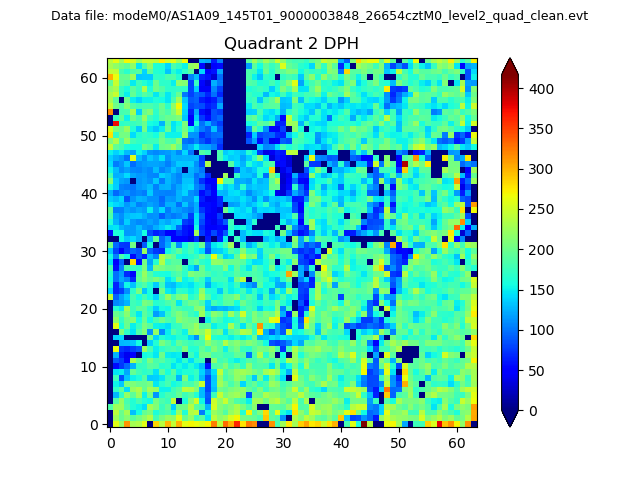
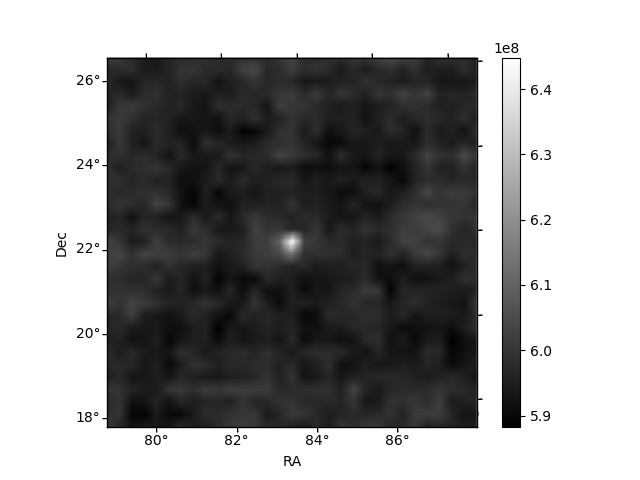
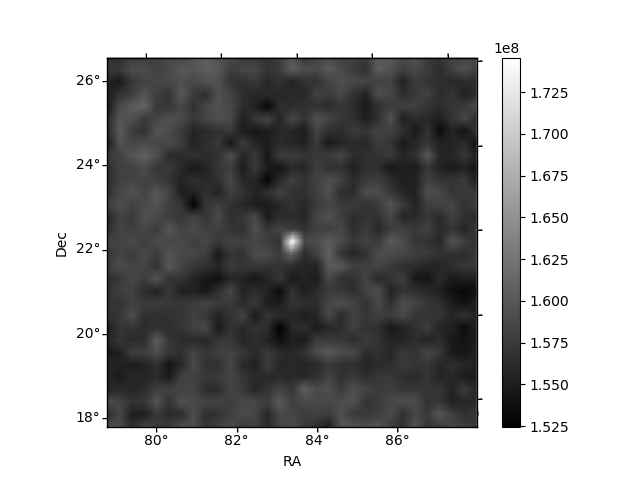
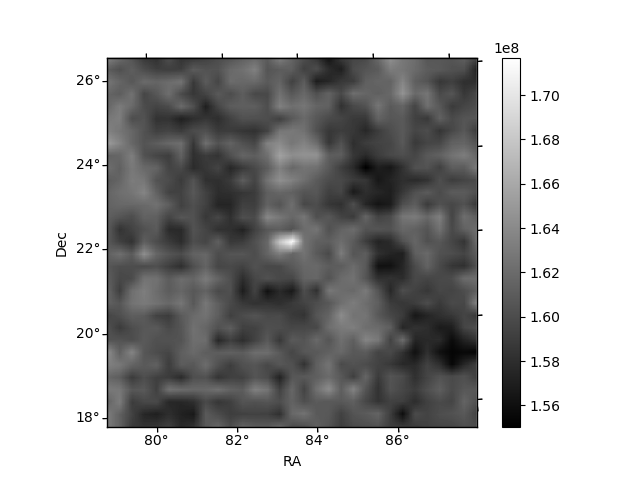
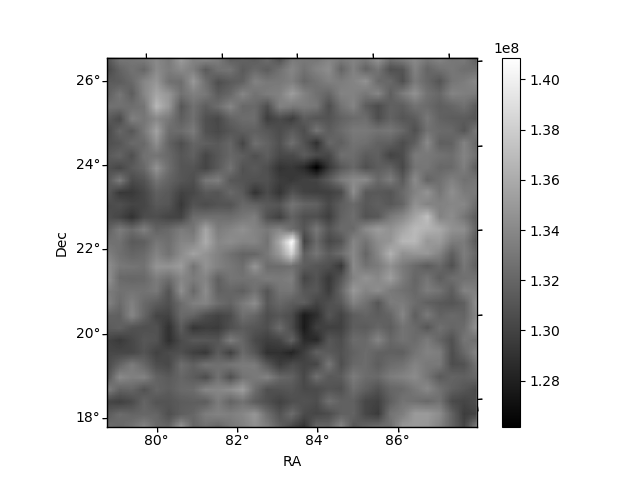
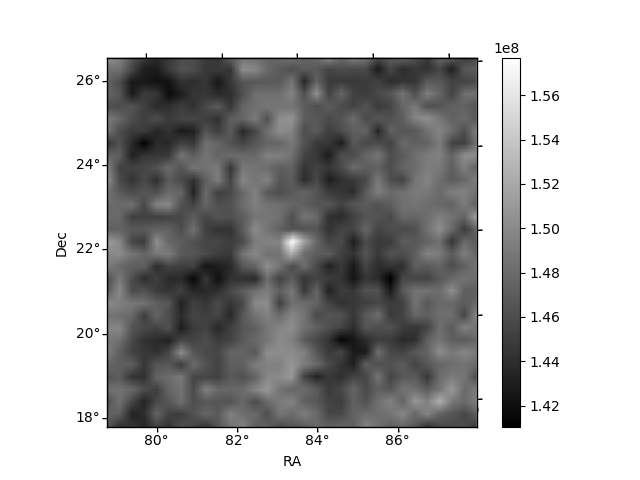
Histogram calculated using DETX and DETY for each event in the final _common_clean file
| Quadrant A | 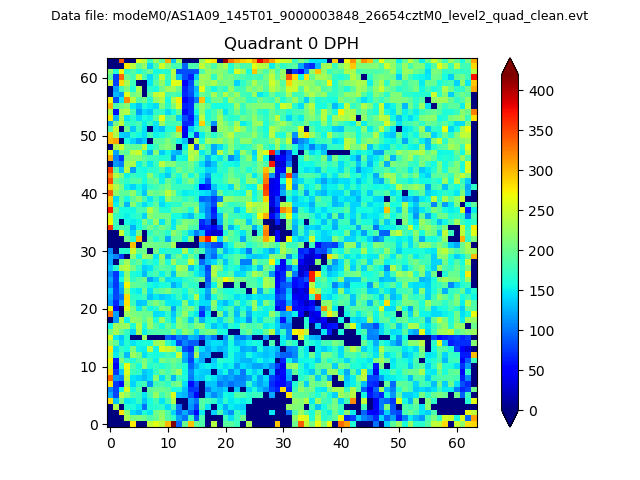 |
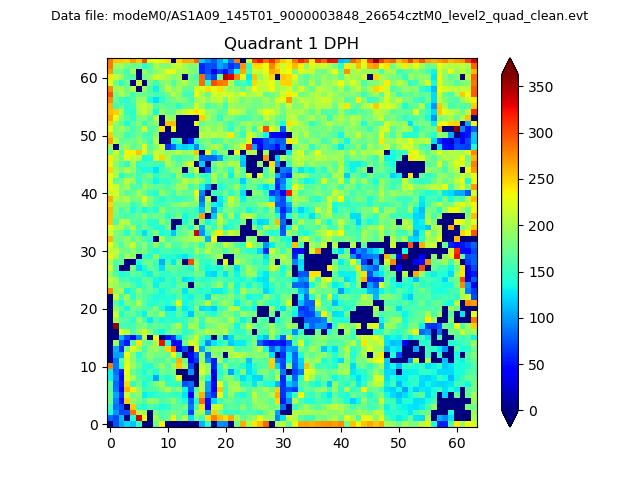 |
Quadrant B |
|---|---|---|---|
| Quadrant D | 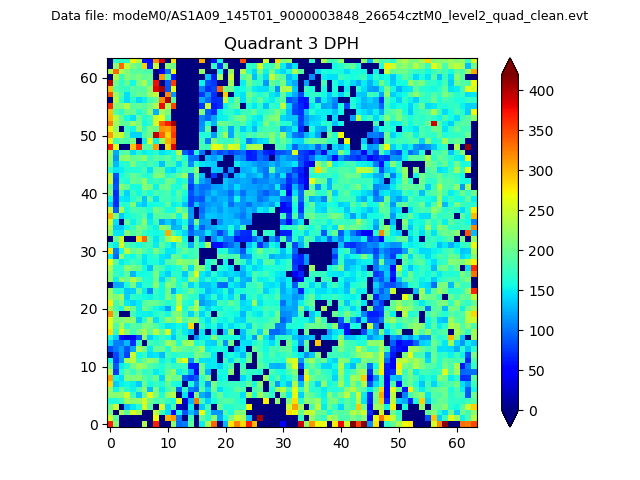 |
 |
Quadrant C |
| Plot type | Count rate plots | Images |
|---|---|---|
| Comparison with Poisson distribution Blue bars denote a histogram of data divided into 1 sec bins. Red curve is a Poisson curve with rate = median count rate of data. |
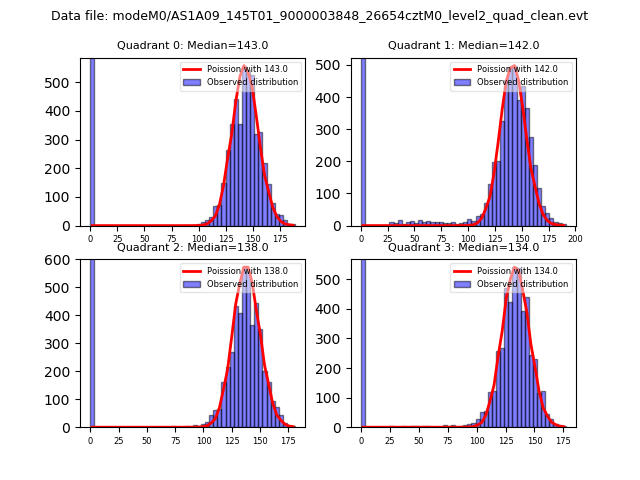 |
 |
| Quadrant-wise count rates Data is divided into 100 sec bins |
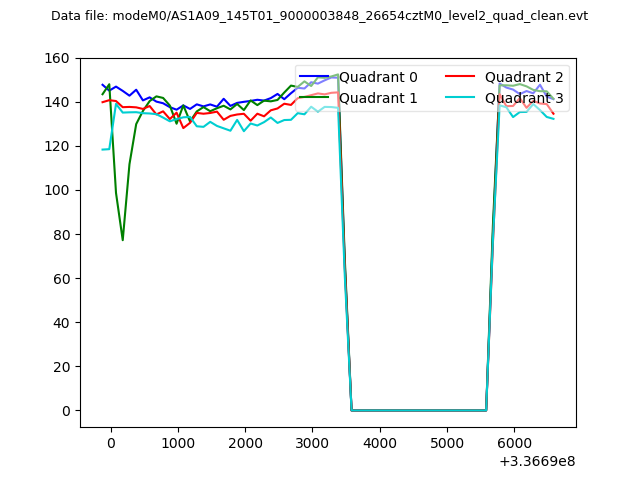 |
|
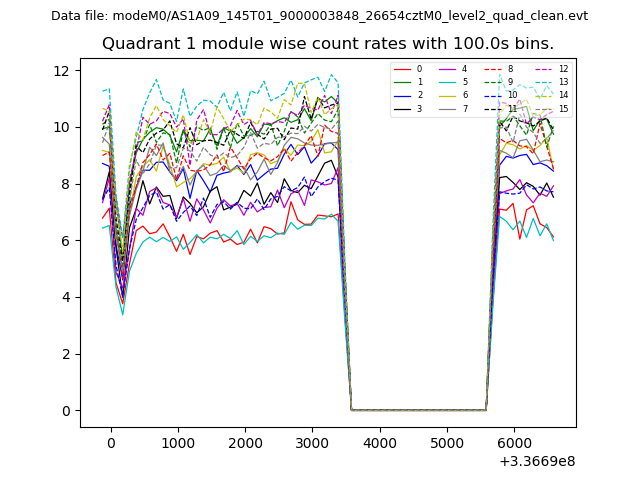
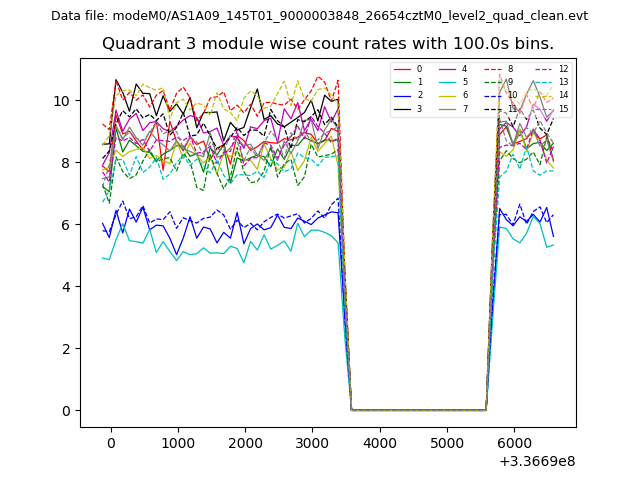
| Module-wise count rates for Quadrant A Data is divided into 100 sec bins |
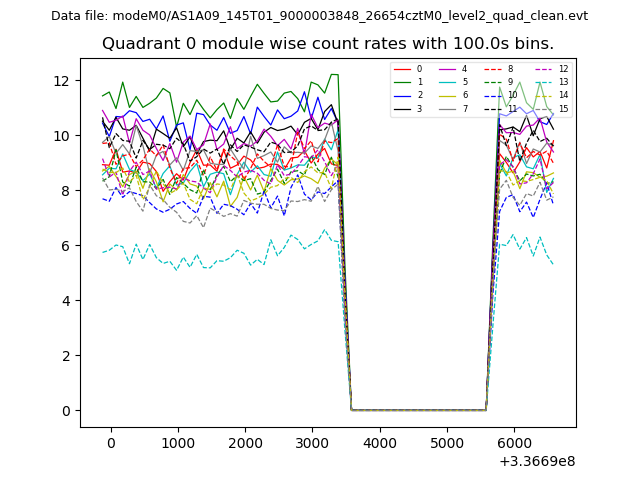 |
 |
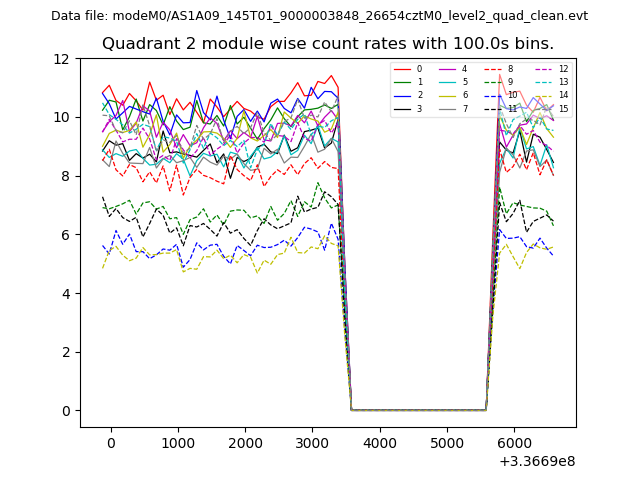
| Module-wise count rates for Quadrant B Data is divided into 100 sec bins |
 |
 |
| Module-wise count rates for Quadrant C Data is divided into 100 sec bins |
 |
 |
| Module-wise count rates for Quadrant D Data is divided into 100 sec bins |
 |
 |
| Parameter | Plot |
|---|---|
| CZT HV Monitor | 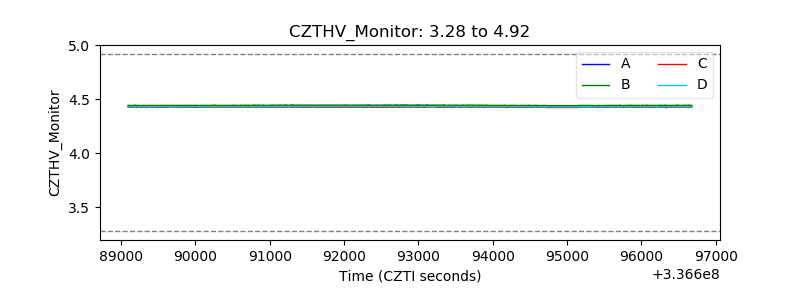 |
| D_VDD | 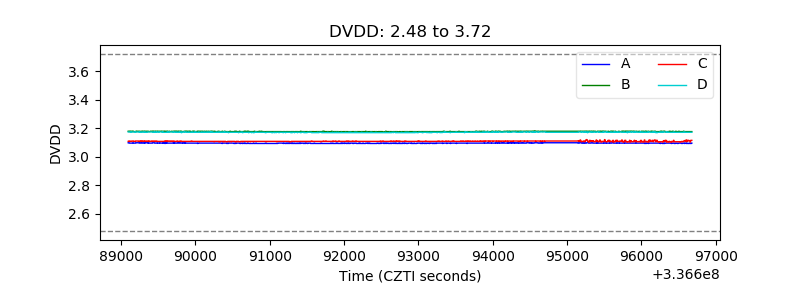 |
| Temperature 1 |  |
| Veto HV Monitor | 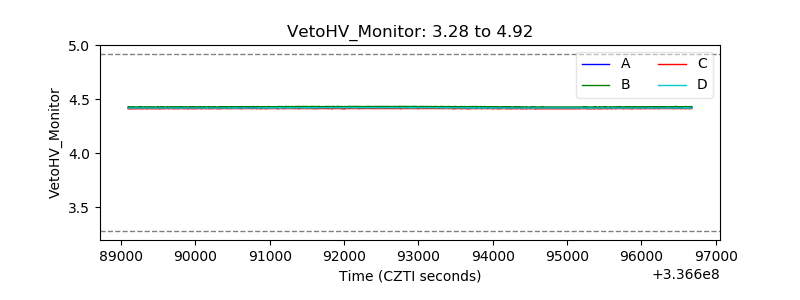 |
| Veto LLD | 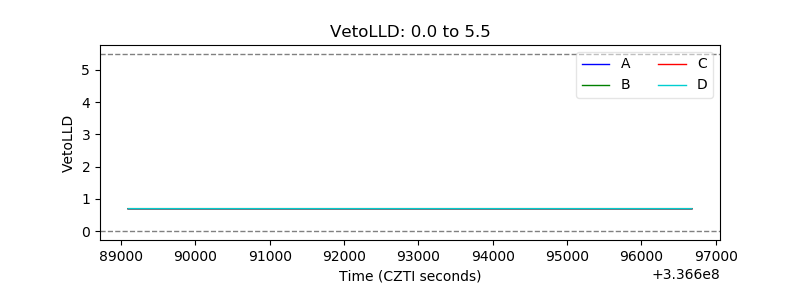 |
| Alpha Counter | 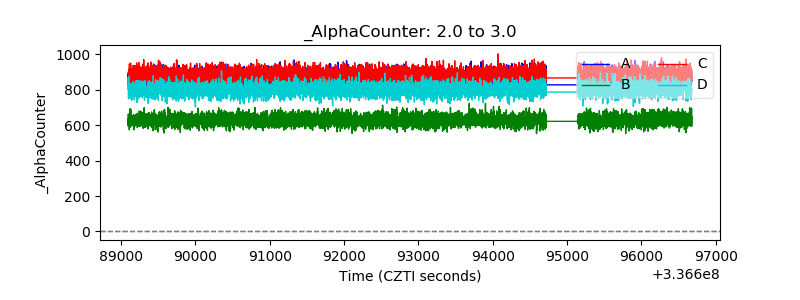 |
| _CPM_Rate | 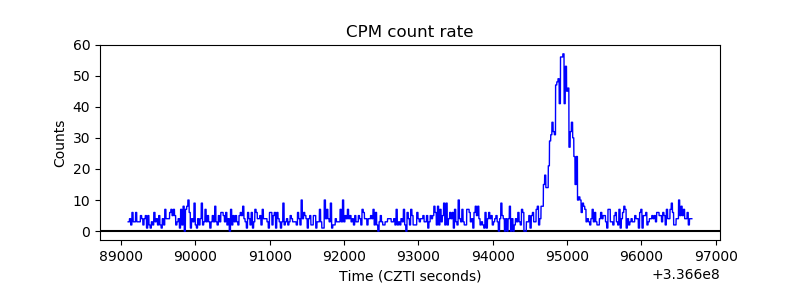 |
| CZT Counter | 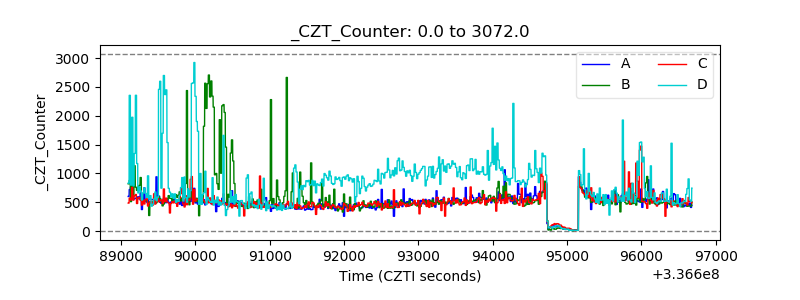 |
| +2.5 Volts monitor |  |
| +5 Volts monitor |  |
| _ROLL_ROT | 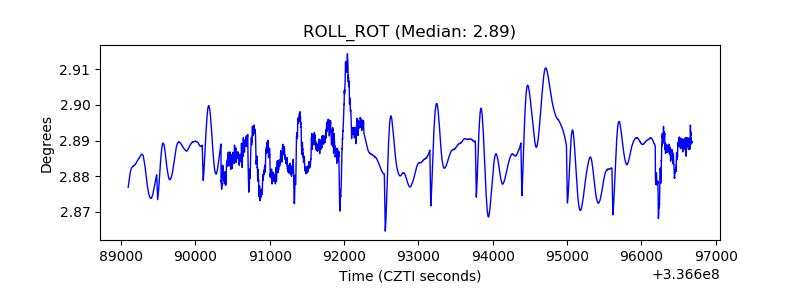 |
| _Roll_DEC | 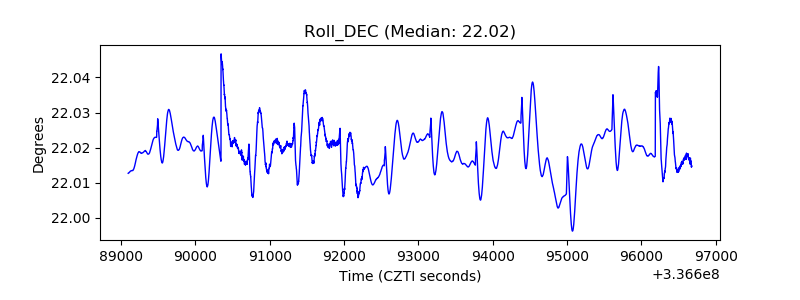 |
| _Roll_RA | 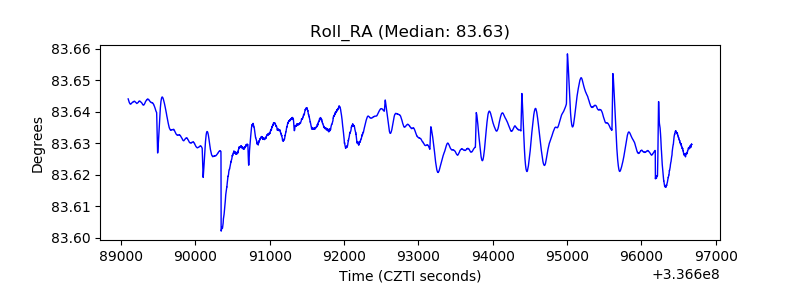 |
| Veto Counter | 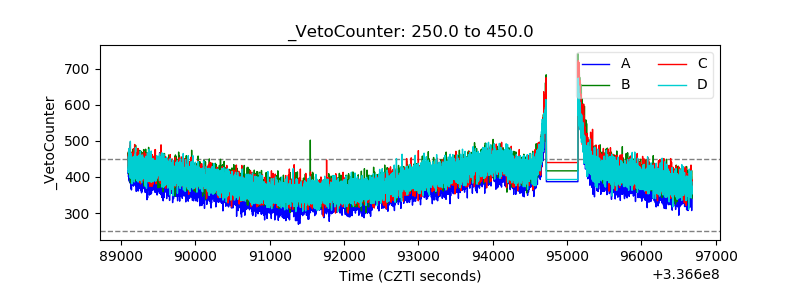 |