| Param | Original file | Final file |
|---|---|---|
| Filename | modeM0/AS1A09_145T01_9000003848_26656cztM0_level2.evt | modeM0/AS1A09_145T01_9000003848_26656cztM0_level2_quad_clean.evt |
| Size (bytes) | 290,404,800 | 60,621,120 |
| Size | 277.0 MB | 57.8 MB |
| Events in quadrant A | 2,050,049 | 367,430 |
| Events in quadrant B | 2,151,844 | 364,752 |
| Events in quadrant C | 2,079,575 | 351,666 |
| Events in quadrant D | 2,205,474 | 434,807 |
| Mode M0 | |||
|---|---|---|---|
| Quadrant | BADHDUFLAG | Total packets | Discarded packets |
| A | 0 | 8808 | 0 |
| B | 0 | 9122 | 0 |
| C | 0 | 8847 | 0 |
| D | 0 | 9356 | 0 |
| Mode M9 | |||
|---|---|---|---|
| Quadrant | BADHDUFLAG | Total packets | Discarded packets |
| A | 0 | 13 | 7 |
| B | 0 | 13 | 10 |
| C | 0 | 14 | 11 |
| D | 0 | 17 | 14 |
| Quadrant | Total seconds | Saturated seconds | Saturation percentage |
|---|---|---|---|
| A | 4274 | 24 | 0.561535% |
| B | 4236 | 45 | 1.062323% |
| C | 4251 | 45 | 1.058574% |
| D | 4144 | 31 | 0.748069% |
Noise dominated data is calculated using 1-second bins in cleaned event files. If a bin has >2000 counts, and if more than 50% of those come from <1% of pixels, then it is considered to be noise-dominated and hence unusable.
| Quadrant | # 1 sec bins | Bins with >0 counts | Bins with >2000 counts | High rate bins dominated by noise | Noise dominated (total time) | Noise dominated (detector-on time) | Marked lightcurve |
|---|---|---|---|---|---|---|---|
| A | 7520 | 4889 | 0 | 0 | 0.00% | 0.00% | 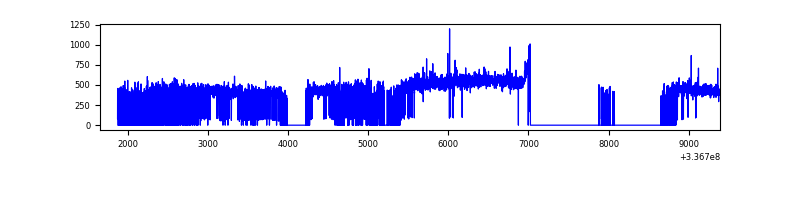 |
| B | 7557 | 4834 | 2 | 2 | 0.03% | 0.04% | 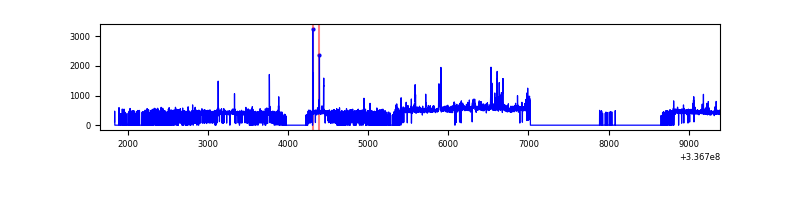 |
| C | 7740 | 4840 | 2 | 2 | 0.03% | 0.04% | 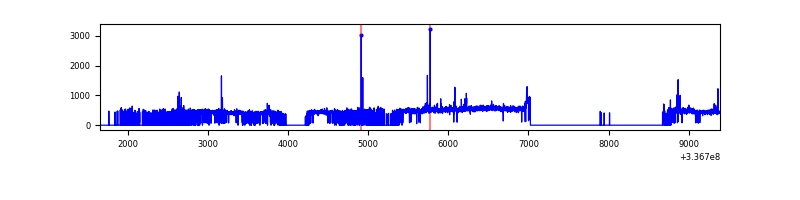 |
| D | 7504 | 4737 | 13 | 13 | 0.17% | 0.27% | 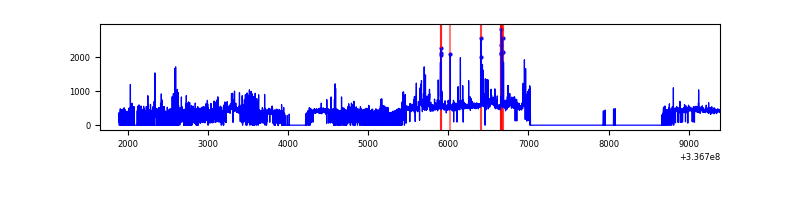 |
Top three noisy pixels from each quadrant. If the there are fewer than three noisy pixels in the level2.evt file, extra rows are filled as -1
| Pixel properties | Quadrant properties | ||||||
|---|---|---|---|---|---|---|---|
| Quadrant | DetID | PixID | Counts | Sigma | Mean | Median | Sigma |
| A | 0 | 13 | 37026 | 340.77 | 520 | 508 | 107.2 |
| A | 13 | 254 | 7074 | 61.27 | 520 | 508 | 107.2 |
| A | 12 | 189 | 5782 | 49.22 | 520 | 508 | 107.2 |
| B | 10 | 245 | 73372 | 732.77 | 512 | 501 | 99.4 |
| B | 5 | 172 | 30562 | 302.29 | 512 | 501 | 99.4 |
| B | 15 | 32 | 18025 | 176.22 | 512 | 501 | 99.4 |
| C | 14 | 238 | 78157 | 661.42 | 493 | 496 | 117.4 |
| C | 15 | 208 | 48582 | 409.53 | 493 | 496 | 117.4 |
| C | 3 | 233 | 16208 | 133.81 | 493 | 496 | 117.4 |
| D | 7 | 80 | 116346 | 961.45 | 486 | 472 | 120.5 |
| D | 2 | 250 | 81348 | 671.06 | 486 | 472 | 120.5 |
| D | 1 | 52 | 67725 | 558.02 | 486 | 472 | 120.5 |
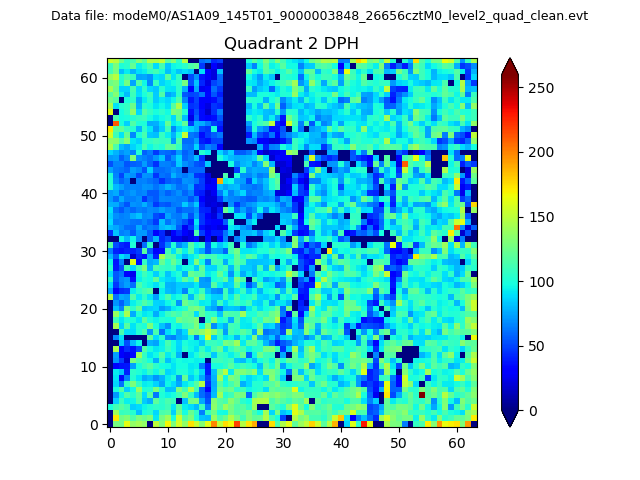
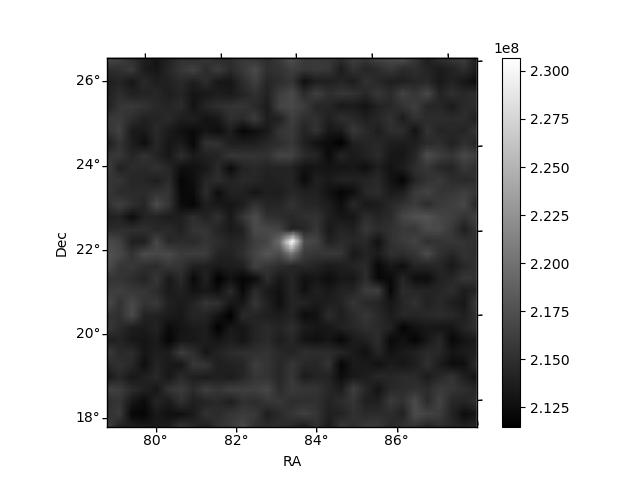
Histogram calculated using DETX and DETY for each event in the final _common_clean file
| Quadrant A | 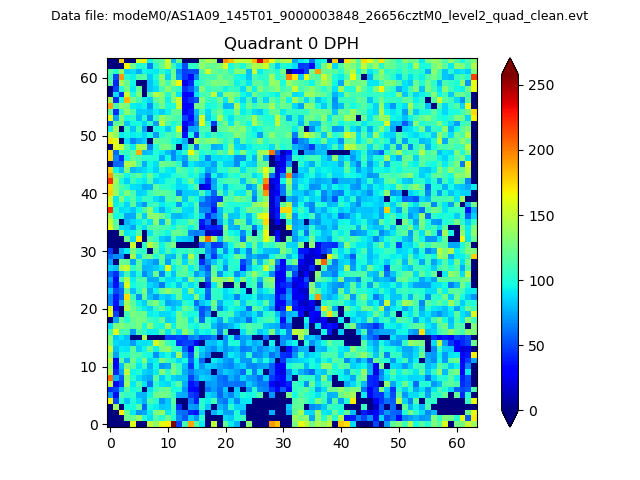 |
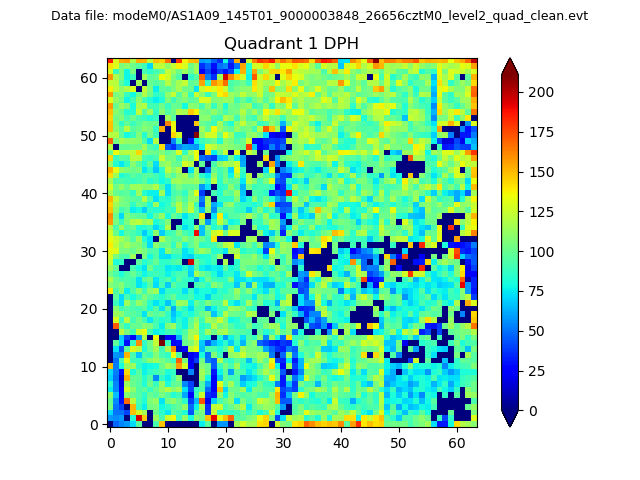 |
Quadrant B |
|---|---|---|---|
| Quadrant D | 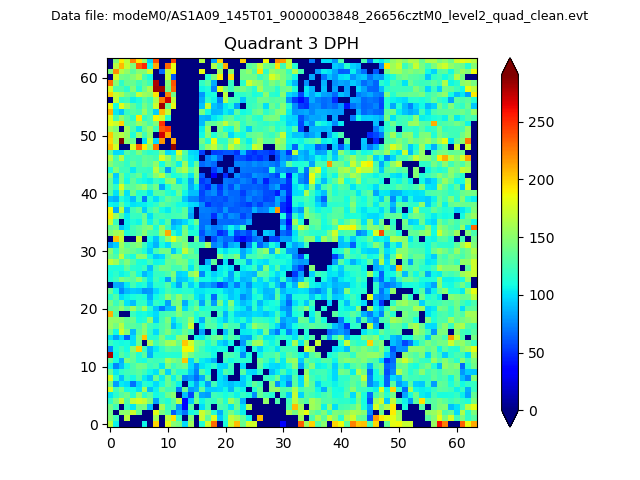 |
 |
Quadrant C |
| Plot type | Count rate plots | Images |
|---|---|---|
| Comparison with Poisson distribution Blue bars denote a histogram of data divided into 1 sec bins. Red curve is a Poisson curve with rate = median count rate of data. |
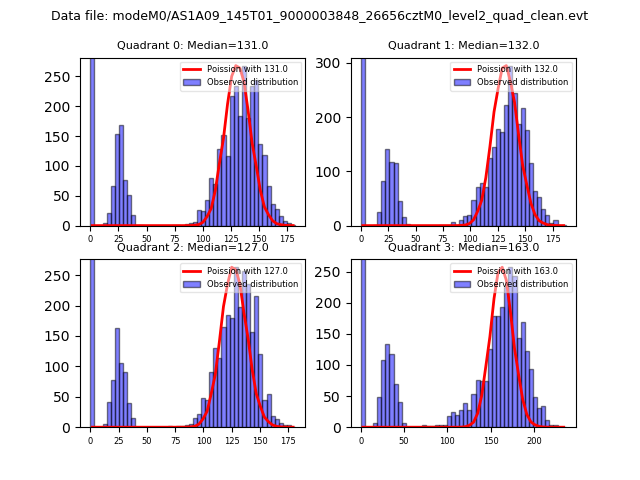 |
 |
| Quadrant-wise count rates Data is divided into 100 sec bins |
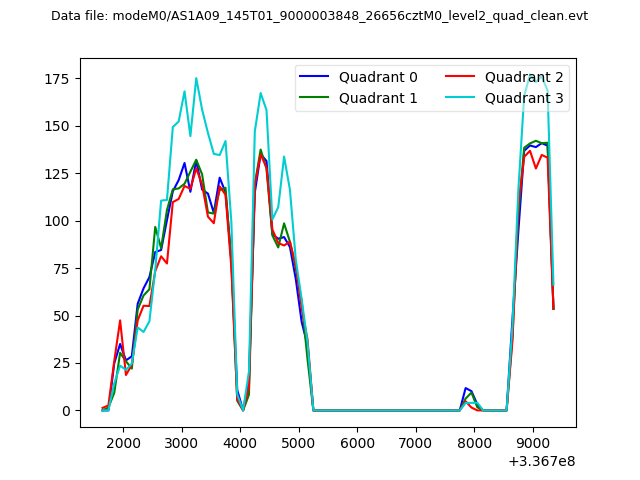 |
|
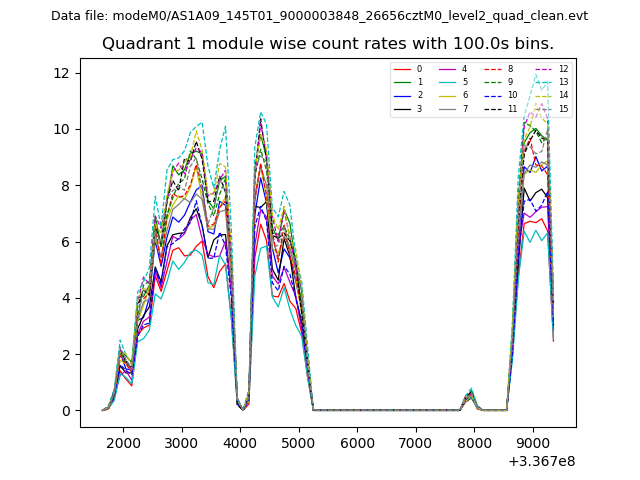
| Module-wise count rates for Quadrant A Data is divided into 100 sec bins |
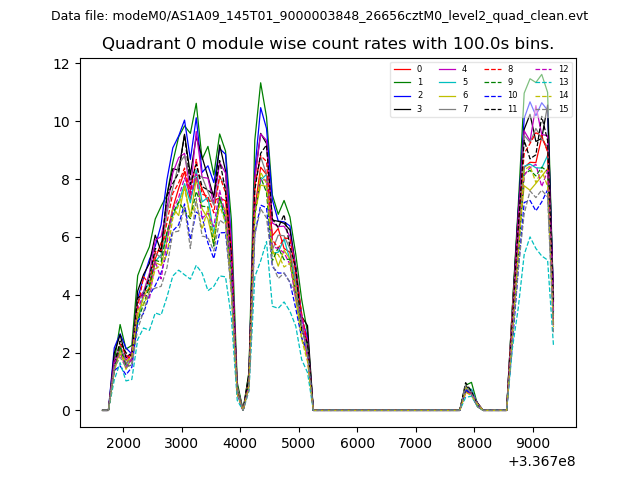 |
 |
| Module-wise count rates for Quadrant B Data is divided into 100 sec bins |
 |
 |
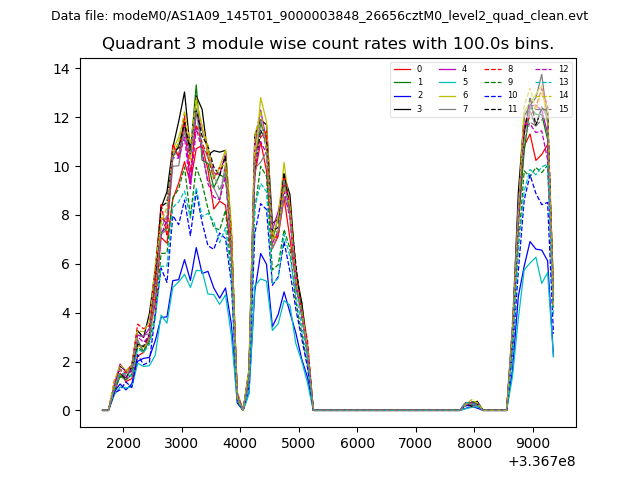
| Module-wise count rates for Quadrant C Data is divided into 100 sec bins |
 |
 |
| Module-wise count rates for Quadrant D Data is divided into 100 sec bins |
 |
 |
| Parameter | Plot |
|---|---|
| CZT HV Monitor | 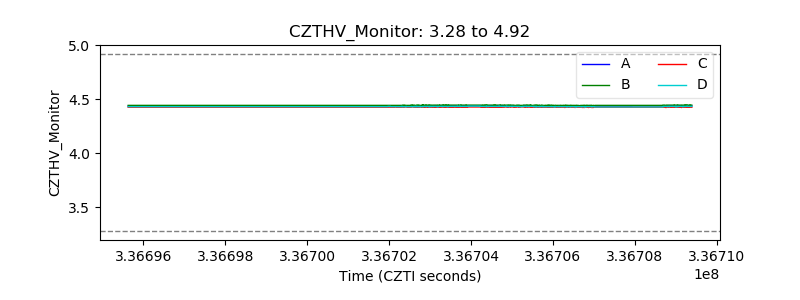 |
| D_VDD | 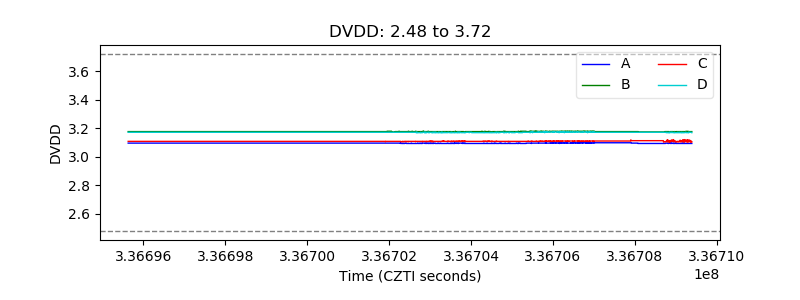 |
| Temperature 1 | 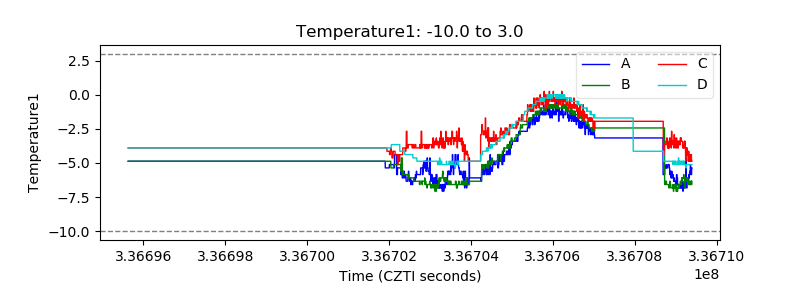 |
| Veto HV Monitor | 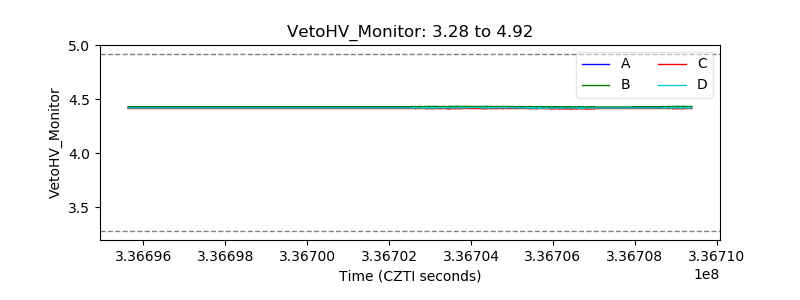 |
| Veto LLD | 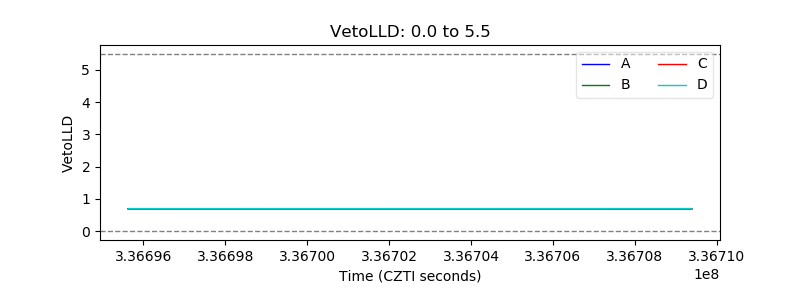 |
| Alpha Counter |  |
| _CPM_Rate | 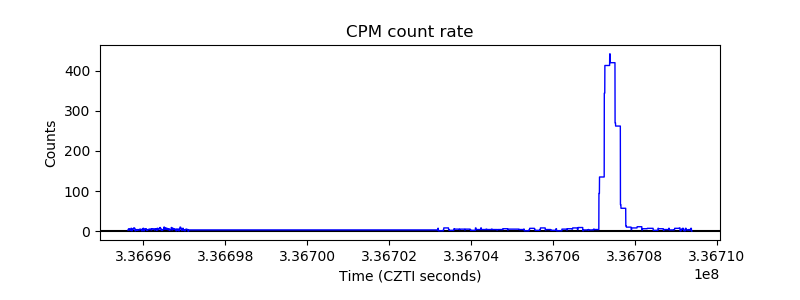 |
| CZT Counter | 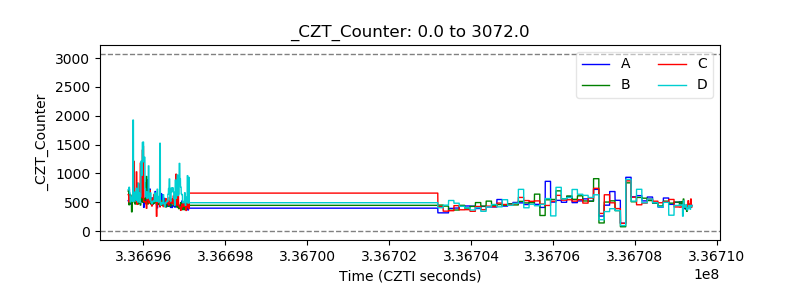 |
| +2.5 Volts monitor | 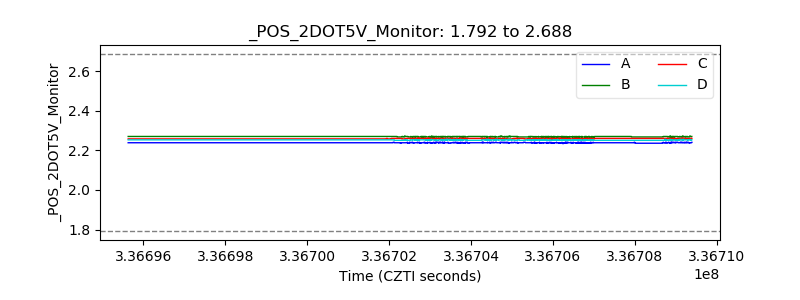 |
| +5 Volts monitor |  |
| _ROLL_ROT |  |
| _Roll_DEC | 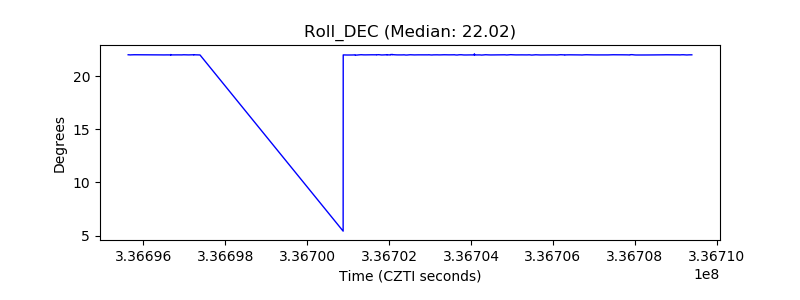 |
| _Roll_RA |  |
| Veto Counter |  |