| Param | Original file | Final file |
|---|---|---|
| Filename | modeM0/AS1A09_145T01_9000003848_26657cztM0_level2.evt | modeM0/AS1A09_145T01_9000003848_26657cztM0_level2_quad_clean.evt |
| Size (bytes) | 498,294,720 | 88,289,280 |
| Size | 475.2 MB | 84.2 MB |
| Events in quadrant A | 2,971,275 | 583,953 |
| Events in quadrant B | 3,746,707 | 576,098 |
| Events in quadrant C | 3,110,373 | 564,733 |
| Events in quadrant D | 4,842,477 | 516,609 |
| Mode M0 | |||
|---|---|---|---|
| Quadrant | BADHDUFLAG | Total packets | Discarded packets |
| A | 0 | 12742 | 0 |
| B | 0 | 14959 | 0 |
| C | 0 | 13022 | 0 |
| D | 0 | 18535 | 0 |
| Mode M9 | |||
|---|---|---|---|
| Quadrant | BADHDUFLAG | Total packets | Discarded packets |
| A | 0 | 9 | 0 |
| B | 0 | 9 | 0 |
| C | 0 | 9 | 0 |
| D | 0 | 9 | 0 |
| Quadrant | Total seconds | Saturated seconds | Saturation percentage |
|---|---|---|---|
| A | 6163 | 29 | 0.470550% |
| B | 6159 | 250 | 4.059101% |
| C | 6165 | 68 | 1.103001% |
| D | 6163 | 556 | 9.021580% |
Noise dominated data is calculated using 1-second bins in cleaned event files. If a bin has >2000 counts, and if more than 50% of those come from <1% of pixels, then it is considered to be noise-dominated and hence unusable.
| Quadrant | # 1 sec bins | Bins with >0 counts | Bins with >2000 counts | High rate bins dominated by noise | Noise dominated (total time) | Noise dominated (detector-on time) | Marked lightcurve |
|---|---|---|---|---|---|---|---|
| A | 7450 | 6204 | 6 | 6 | 0.08% | 0.10% | 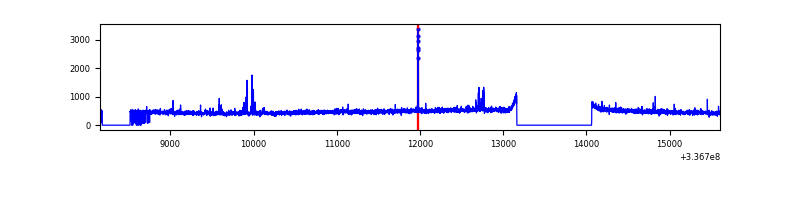 |
| B | 7451 | 6206 | 184 | 184 | 2.47% | 2.96% | 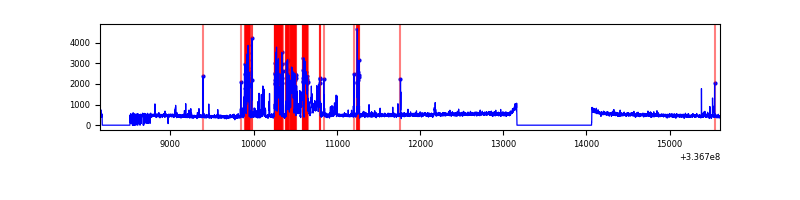 |
| C | 7451 | 6205 | 8 | 8 | 0.11% | 0.13% | 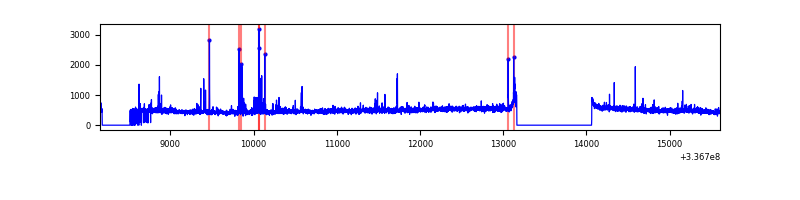 |
| D | 7451 | 6206 | 520 | 520 | 6.98% | 8.38% | 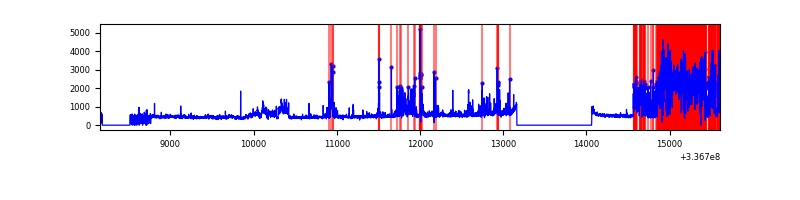 |
Top three noisy pixels from each quadrant. If the there are fewer than three noisy pixels in the level2.evt file, extra rows are filled as -1
| Pixel properties | Quadrant properties | ||||||
|---|---|---|---|---|---|---|---|
| Quadrant | DetID | PixID | Counts | Sigma | Mean | Median | Sigma |
| A | 12 | 96 | 45603 | 294.07 | 751 | 736 | 152.6 |
| A | 0 | 13 | 21354 | 135.13 | 751 | 736 | 152.6 |
| A | 13 | 254 | 9540 | 57.7 | 751 | 736 | 152.6 |
| B | 10 | 245 | 820954 | 5762.62 | 743 | 727 | 142.3 |
| B | 12 | 111 | 16942 | 113.92 | 743 | 727 | 142.3 |
| B | 3 | 112 | 16641 | 111.81 | 743 | 727 | 142.3 |
| C | 14 | 238 | 116496 | 681.61 | 720 | 725 | 169.8 |
| C | 15 | 208 | 111776 | 653.82 | 720 | 725 | 169.8 |
| C | 3 | 233 | 39708 | 229.52 | 720 | 725 | 169.8 |
| D | 7 | 80 | 1837703 | 10598.48 | 703 | 684 | 173.3 |
| D | 12 | 233 | 156295 | 897.78 | 703 | 684 | 173.3 |
| D | 2 | 250 | 54988 | 313.3 | 703 | 684 | 173.3 |
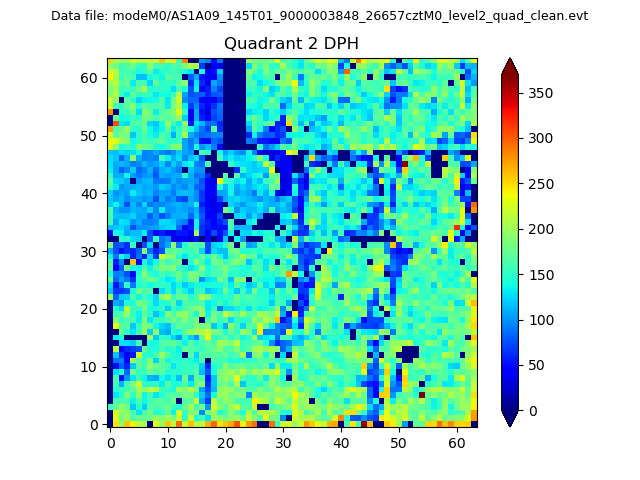
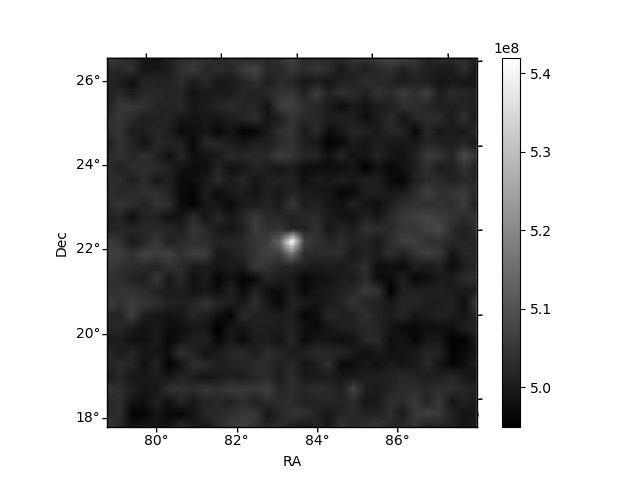
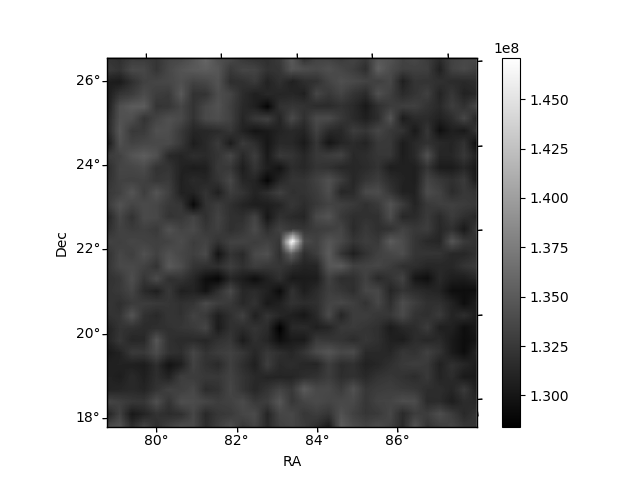
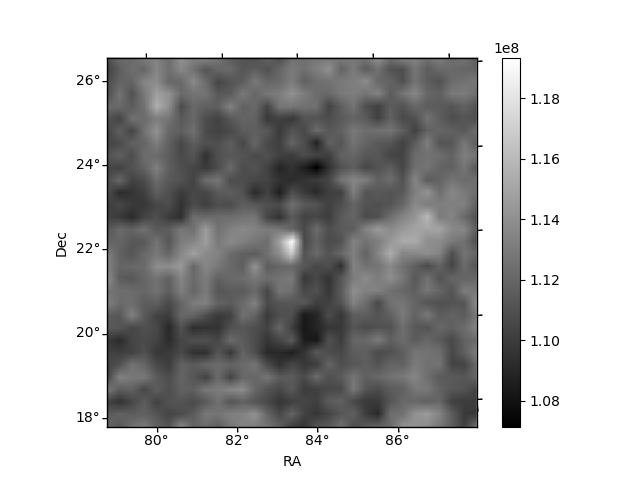
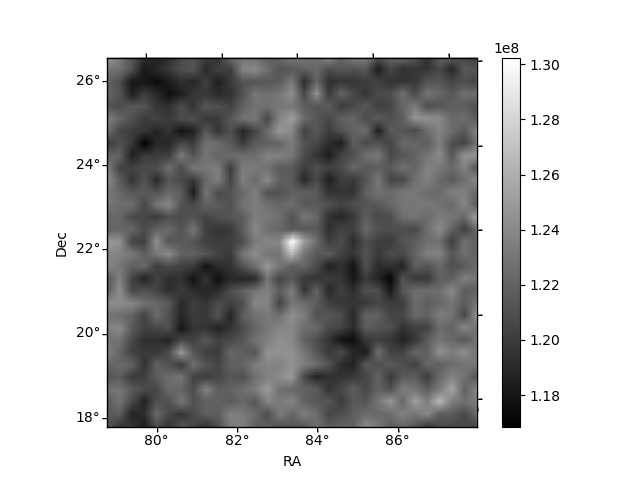
Histogram calculated using DETX and DETY for each event in the final _common_clean file
| Quadrant A | 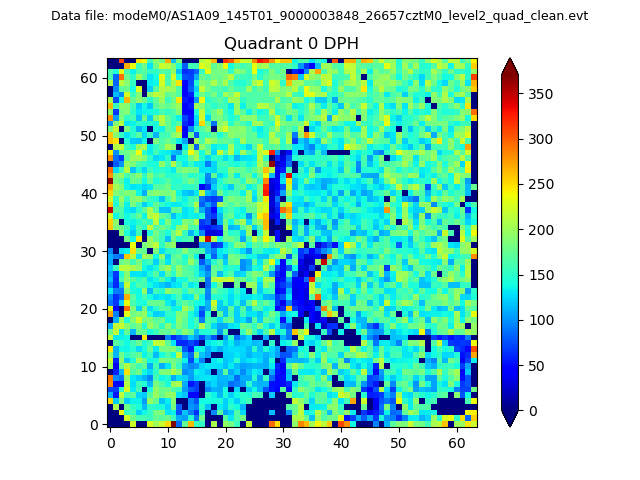 |
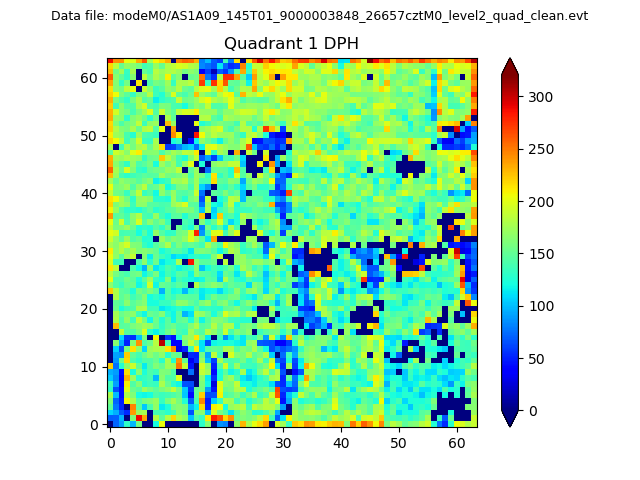 |
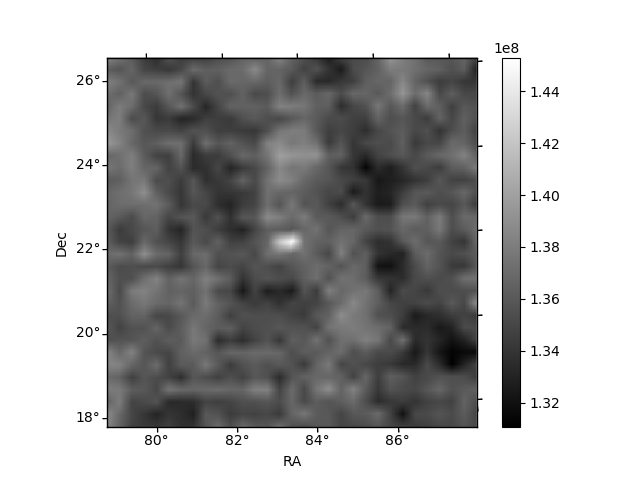
Quadrant B |
|---|---|---|---|
| Quadrant D | 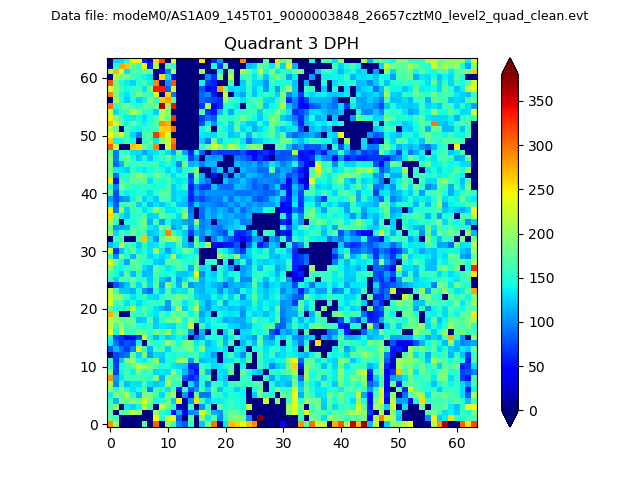 |
 |
Quadrant C |
| Plot type | Count rate plots | Images |
|---|---|---|
| Comparison with Poisson distribution Blue bars denote a histogram of data divided into 1 sec bins. Red curve is a Poisson curve with rate = median count rate of data. |
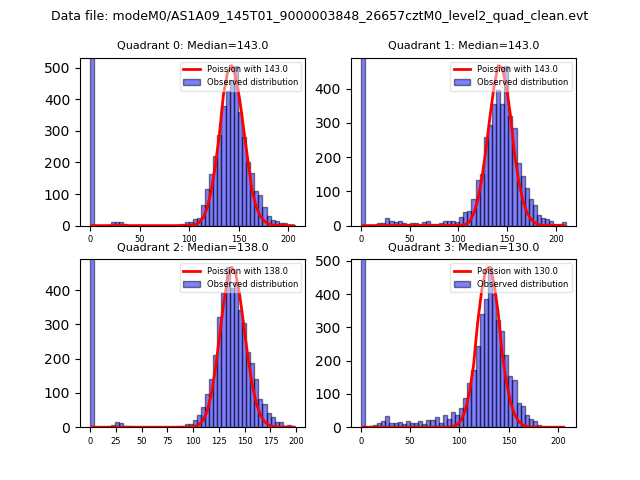 |
 |
| Quadrant-wise count rates Data is divided into 100 sec bins |
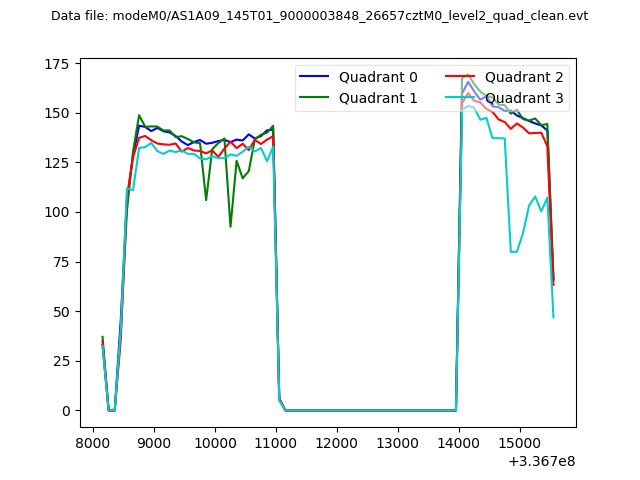 |
|
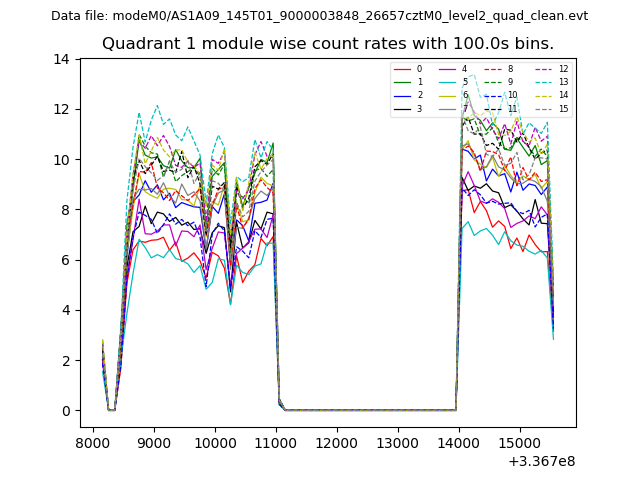
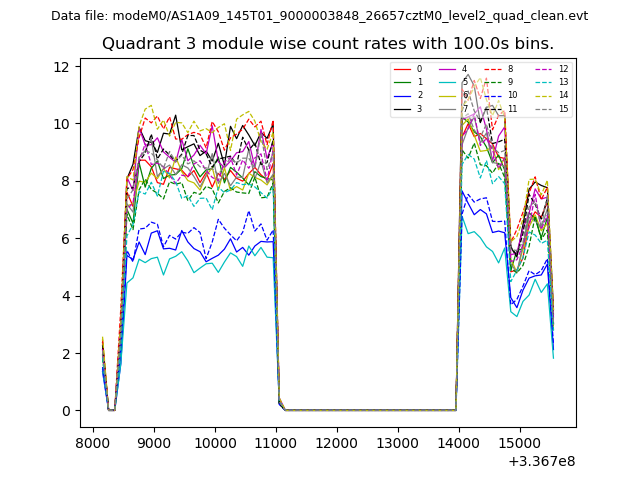
| Module-wise count rates for Quadrant A Data is divided into 100 sec bins |
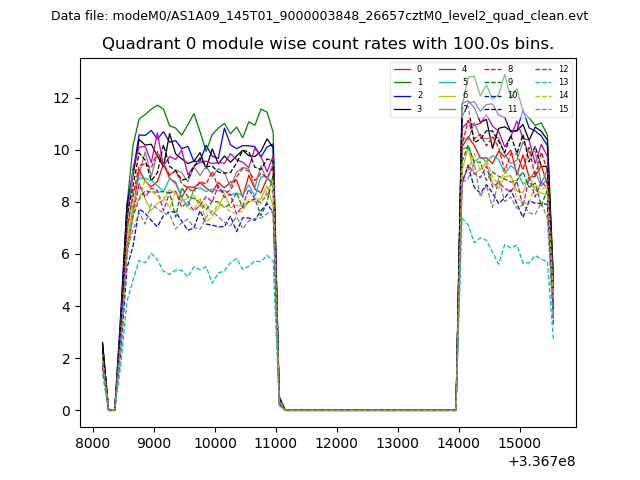 |
 |
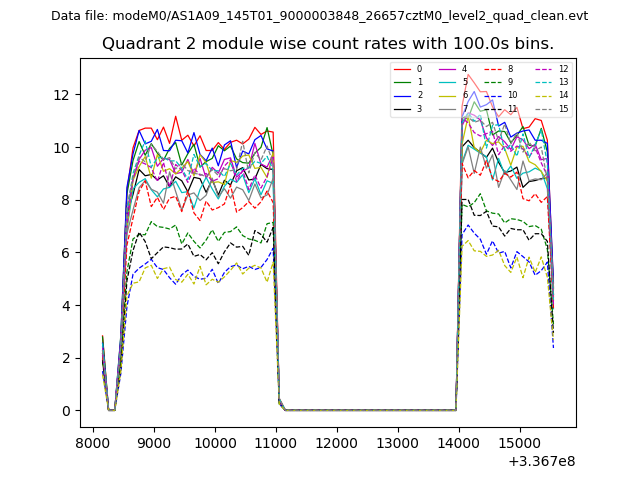
| Module-wise count rates for Quadrant B Data is divided into 100 sec bins |
 |
 |
| Module-wise count rates for Quadrant C Data is divided into 100 sec bins |
 |
 |
| Module-wise count rates for Quadrant D Data is divided into 100 sec bins |
 |
 |
| Parameter | Plot |
|---|---|
| CZT HV Monitor | 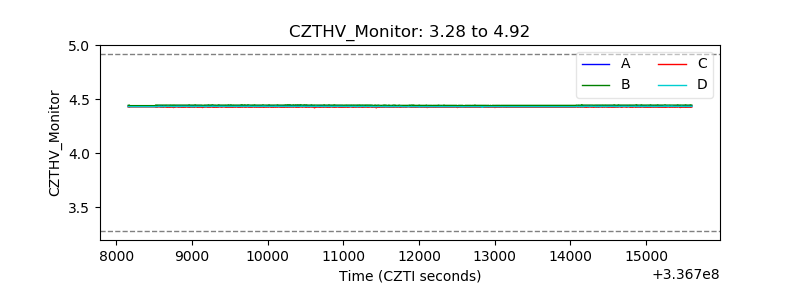 |
| D_VDD | 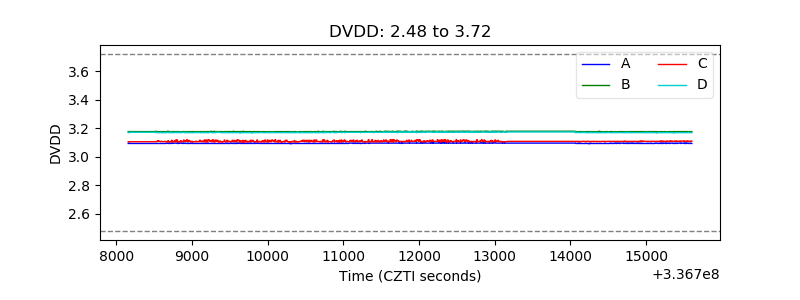 |
| Temperature 1 | 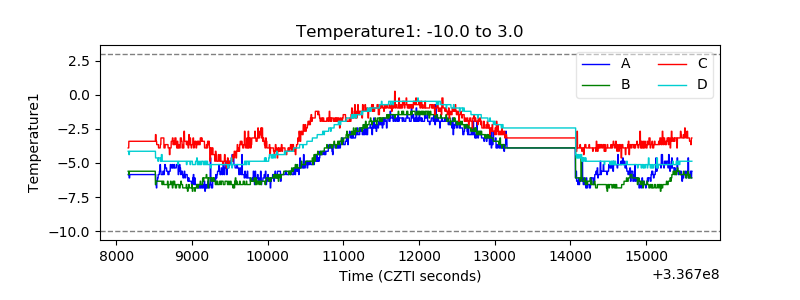 |
| Veto HV Monitor | 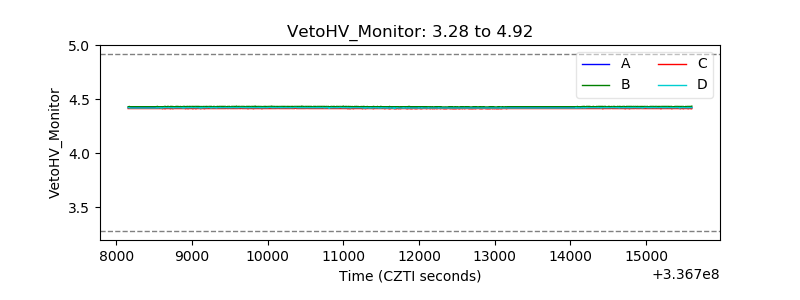 |
| Veto LLD | 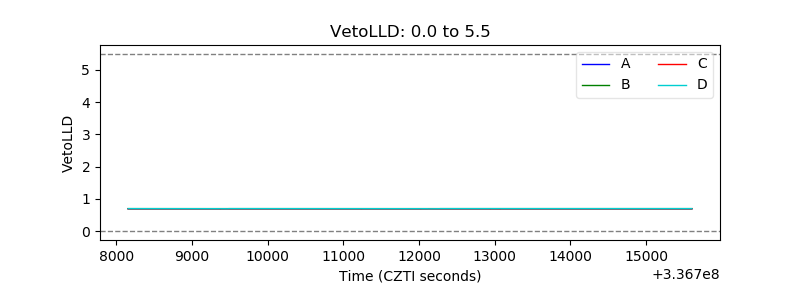 |
| Alpha Counter | 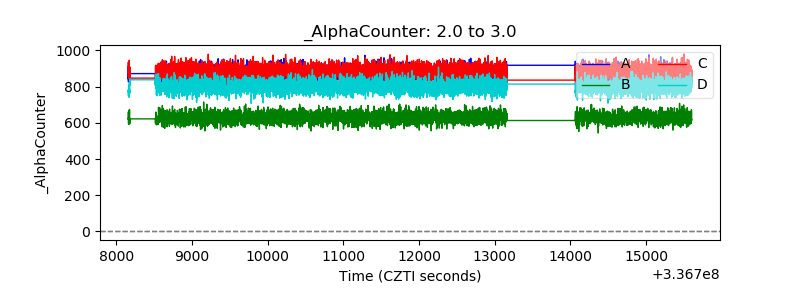 |
| _CPM_Rate | 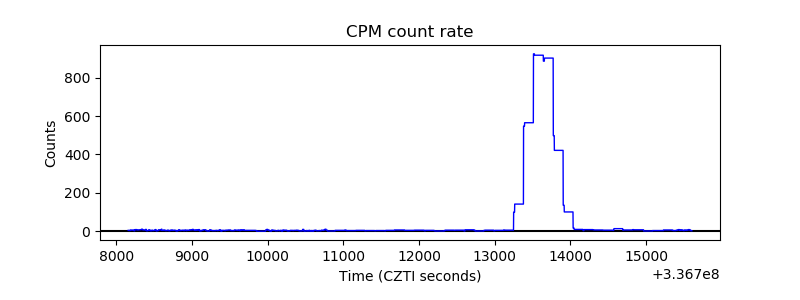 |
| CZT Counter | 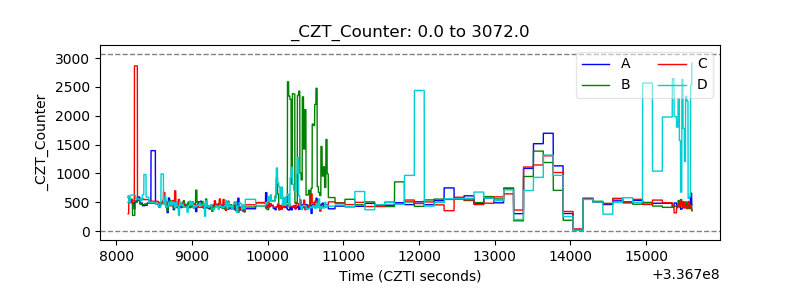 |
| +2.5 Volts monitor |  |
| +5 Volts monitor | 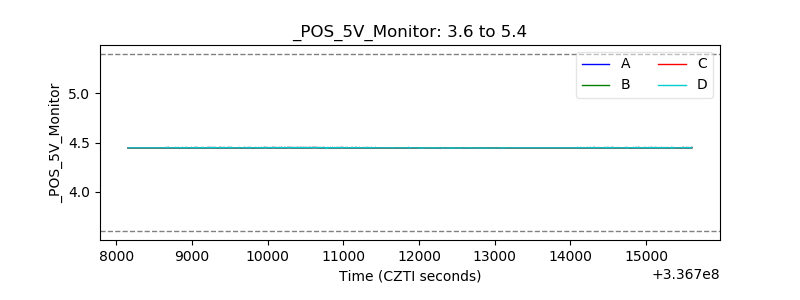 |
| _ROLL_ROT | 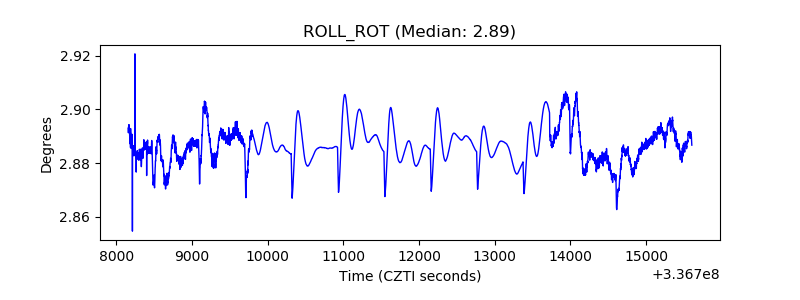 |
| _Roll_DEC | 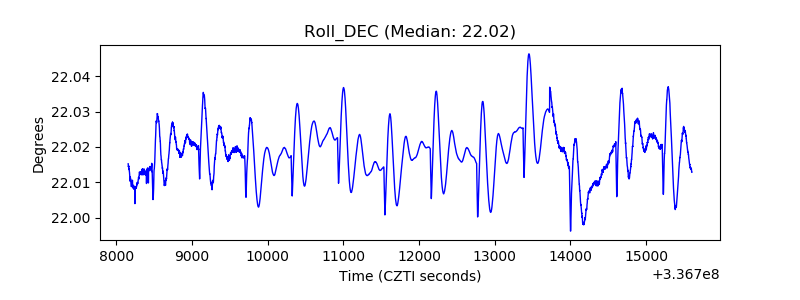 |
| _Roll_RA | 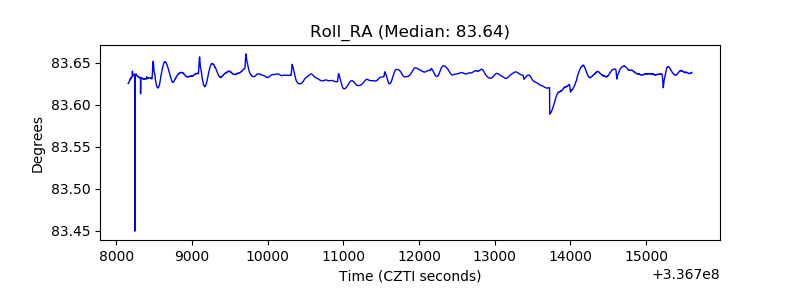 |
| Veto Counter | 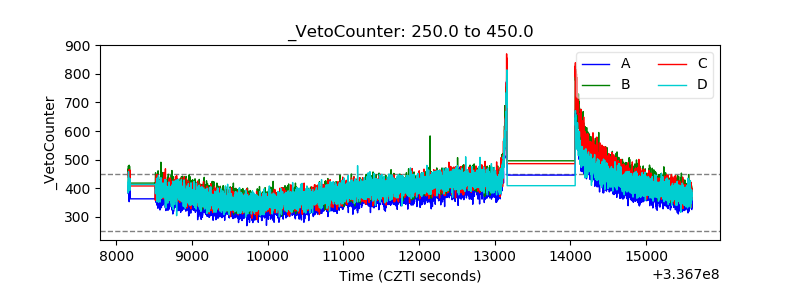 |