| Param | Original file | Final file |
|---|---|---|
| Filename | modeM0/AS1A09_145T01_9000003848_26658cztM0_level2.evt | modeM0/AS1A09_145T01_9000003848_26658cztM0_level2_quad_clean.evt |
| Size (bytes) | 1,682,418,240 | 321,808,320 |
| Size | 1.6 GB | 306.9 MB |
| Events in quadrant A | 10,830,994 | 2,109,924 |
| Events in quadrant B | 12,373,322 | 2,118,892 |
| Events in quadrant C | 11,384,668 | 2,041,307 |
| Events in quadrant D | 14,857,395 | 1,941,678 |
| Mode M0 | |||
|---|---|---|---|
| Quadrant | BADHDUFLAG | Total packets | Discarded packets |
| A | 0 | 46162 | 0 |
| B | 0 | 50909 | 0 |
| C | 0 | 47711 | 0 |
| D | 0 | 59211 | 0 |
| Mode M9 | |||
|---|---|---|---|
| Quadrant | BADHDUFLAG | Total packets | Discarded packets |
| A | 0 | 32 | 0 |
| B | 0 | 32 | 0 |
| C | 0 | 32 | 0 |
| D | 0 | 32 | 0 |
| Quadrant | Total seconds | Saturated seconds | Saturation percentage |
|---|---|---|---|
| A | 22309 | 120 | 0.537900% |
| B | 22309 | 504 | 2.259178% |
| C | 22309 | 341 | 1.528531% |
| D | 22309 | 927 | 4.155274% |
Noise dominated data is calculated using 1-second bins in cleaned event files. If a bin has >2000 counts, and if more than 50% of those come from <1% of pixels, then it is considered to be noise-dominated and hence unusable.
| Quadrant | # 1 sec bins | Bins with >0 counts | Bins with >2000 counts | High rate bins dominated by noise | Noise dominated (total time) | Noise dominated (detector-on time) | Marked lightcurve |
|---|---|---|---|---|---|---|---|
| A | 25569 | 22313 | 6 | 6 | 0.02% | 0.03% | 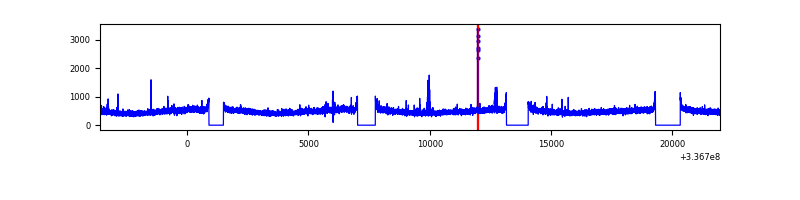 |
| B | 25569 | 22313 | 253 | 253 | 0.99% | 1.13% | 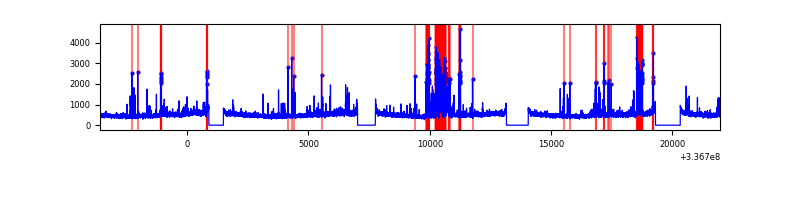 |
| C | 25569 | 22313 | 45 | 45 | 0.18% | 0.20% | 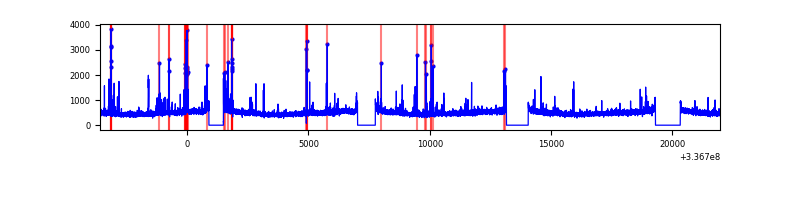 |
| D | 25569 | 22313 | 750 | 750 | 2.93% | 3.36% | 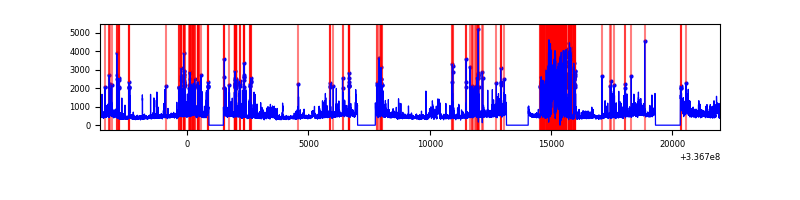 |
Top three noisy pixels from each quadrant. If the there are fewer than three noisy pixels in the level2.evt file, extra rows are filled as -1
| Pixel properties | Quadrant properties | ||||||
|---|---|---|---|---|---|---|---|
| Quadrant | DetID | PixID | Counts | Sigma | Mean | Median | Sigma |
| A | 0 | 13 | 104861 | 183.88 | 2763 | 2715 | 555.5 |
| A | 12 | 96 | 48522 | 82.46 | 2763 | 2715 | 555.5 |
| A | 13 | 254 | 35828 | 59.61 | 2763 | 2715 | 555.5 |
| B | 10 | 245 | 1347794 | 2600.02 | 2737 | 2677 | 517.3 |
| B | 15 | 33 | 81279 | 151.93 | 2737 | 2677 | 517.3 |
| B | 3 | 112 | 79538 | 148.57 | 2737 | 2677 | 517.3 |
| C | 15 | 208 | 442261 | 713.31 | 2637 | 2665 | 616.3 |
| C | 14 | 238 | 425351 | 685.87 | 2637 | 2665 | 616.3 |
| C | 2 | 16 | 114864 | 182.06 | 2637 | 2665 | 616.3 |
| D | 7 | 80 | 2763498 | 4262.36 | 2639 | 2571 | 647.7 |
| D | 1 | 52 | 850442 | 1308.96 | 2639 | 2571 | 647.7 |
| D | 2 | 250 | 634519 | 975.61 | 2639 | 2571 | 647.7 |
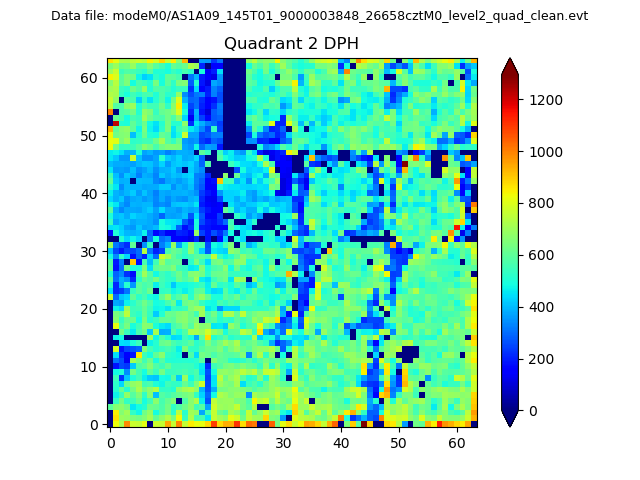
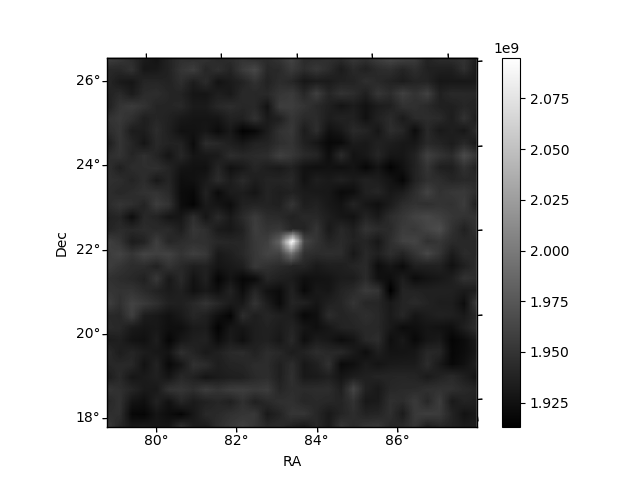
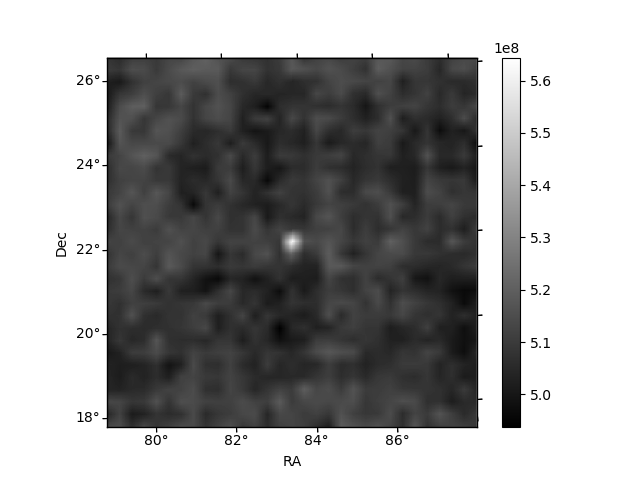
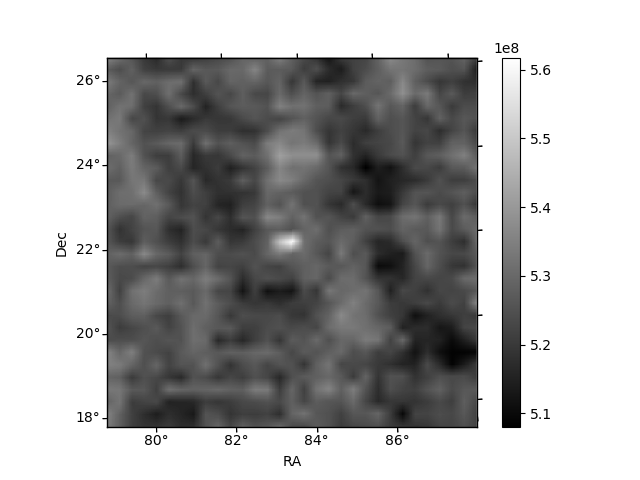
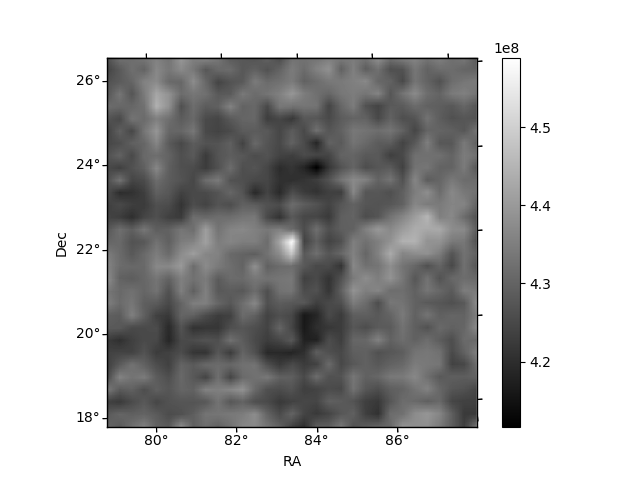
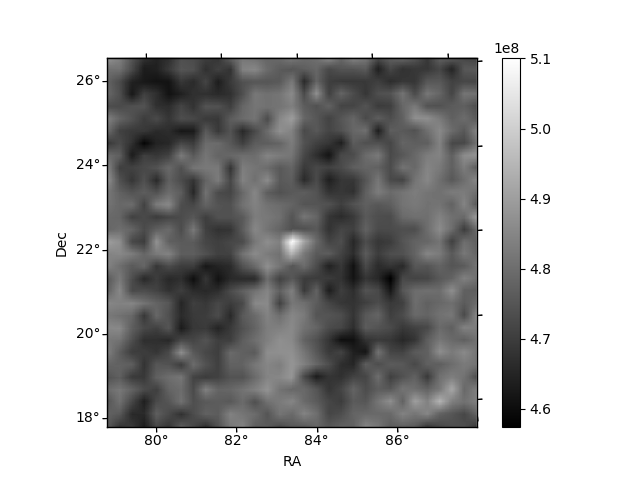
Histogram calculated using DETX and DETY for each event in the final _common_clean file
| Quadrant A | 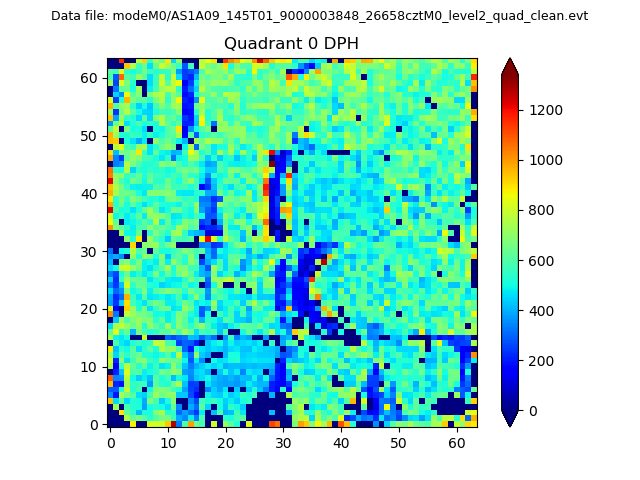 |
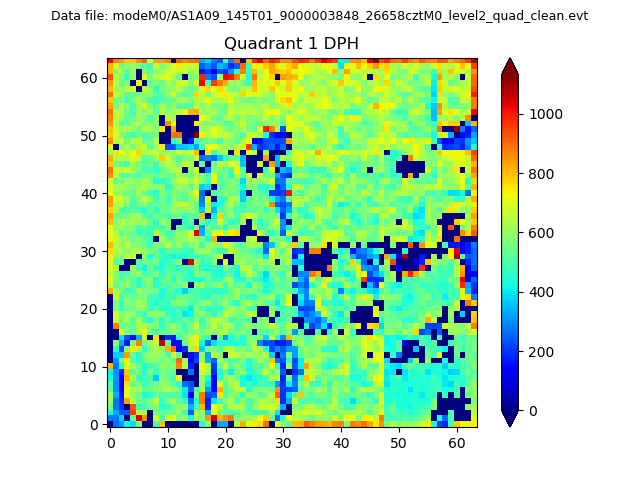 |
Quadrant B |
|---|---|---|---|
| Quadrant D | 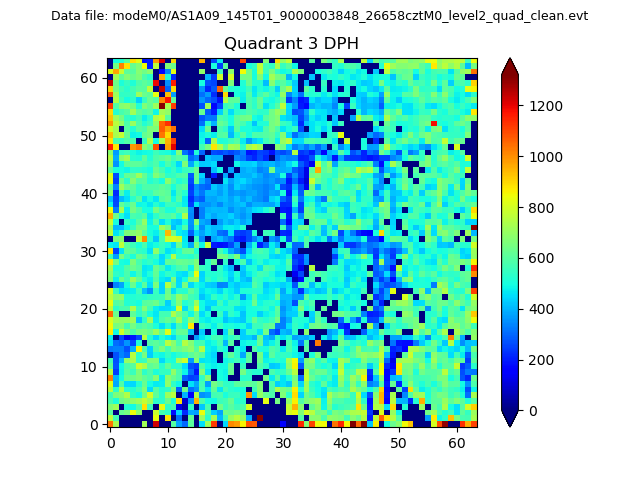 |
 |
Quadrant C |
| Plot type | Count rate plots | Images |
|---|---|---|
| Comparison with Poisson distribution Blue bars denote a histogram of data divided into 1 sec bins. Red curve is a Poisson curve with rate = median count rate of data. |
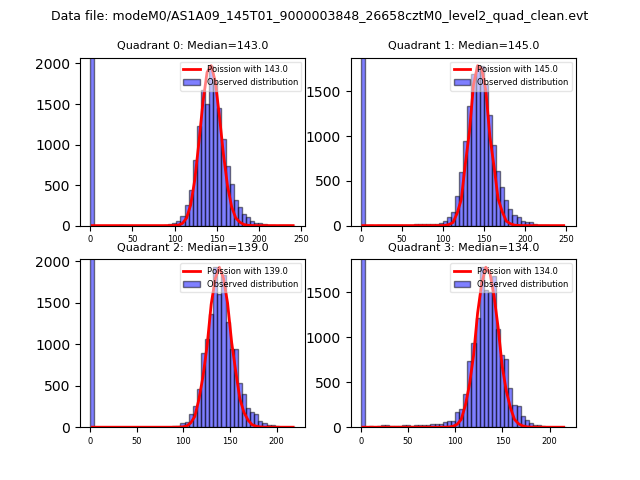 |
 |
| Quadrant-wise count rates Data is divided into 100 sec bins |
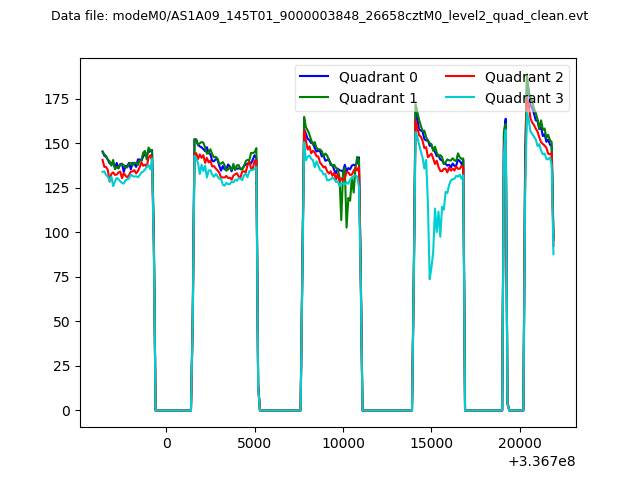 |
|
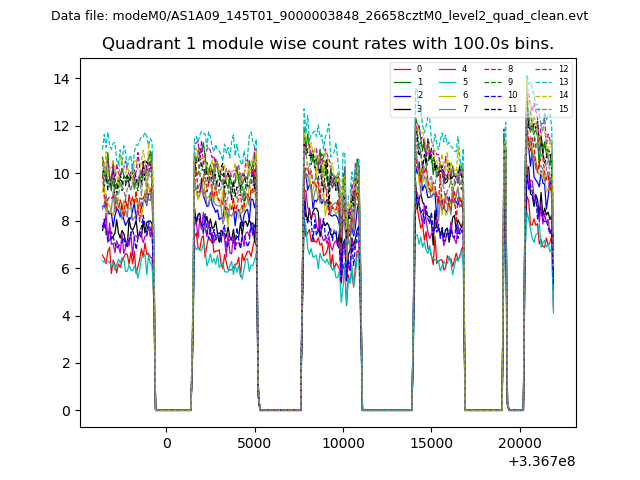
| Module-wise count rates for Quadrant A Data is divided into 100 sec bins |
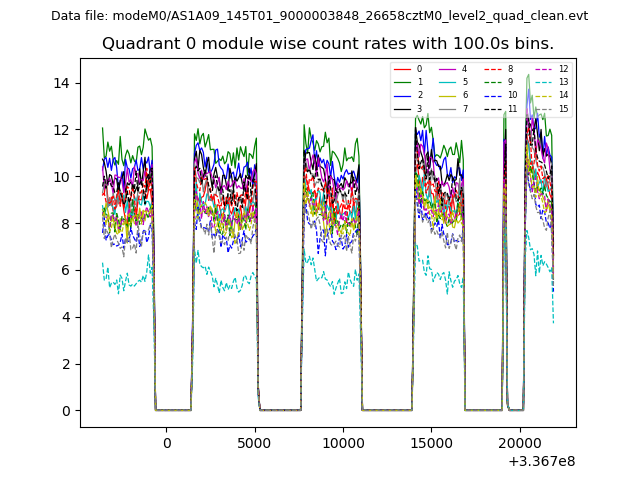 |
 |
| Module-wise count rates for Quadrant B Data is divided into 100 sec bins |
 |
 |
| Module-wise count rates for Quadrant C Data is divided into 100 sec bins |
 |
 |
| Module-wise count rates for Quadrant D Data is divided into 100 sec bins |
 |
 |
| Parameter | Plot |
|---|---|
| CZT HV Monitor | 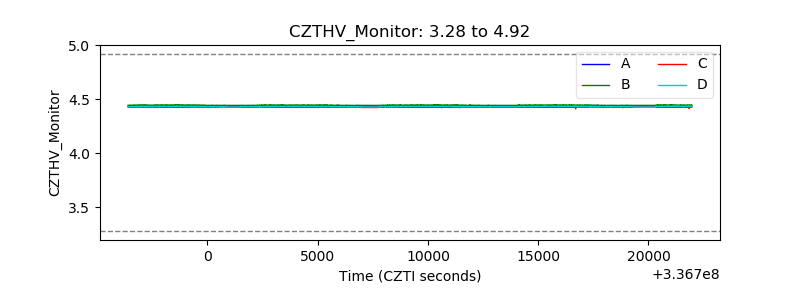 |
| D_VDD | 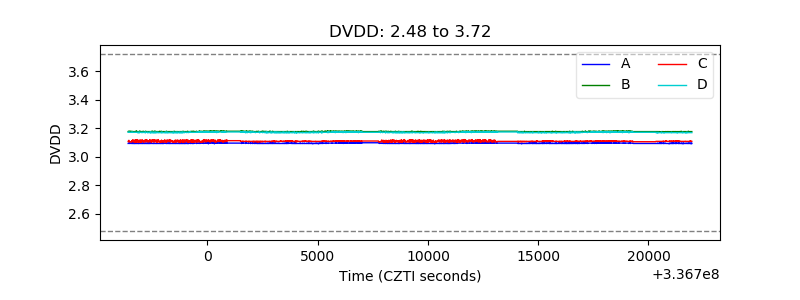 |
| Temperature 1 | 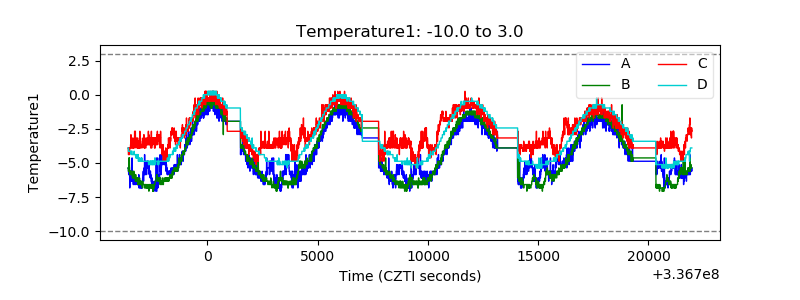 |
| Veto HV Monitor | 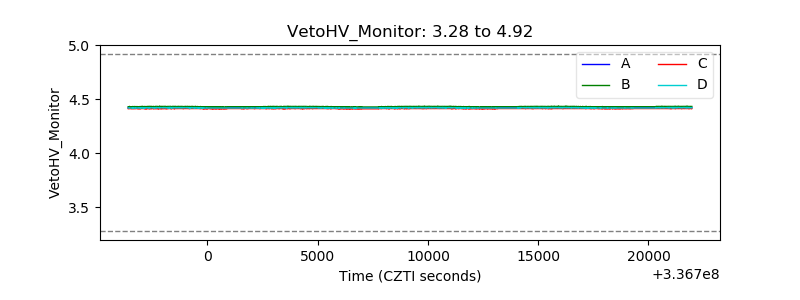 |
| Veto LLD | 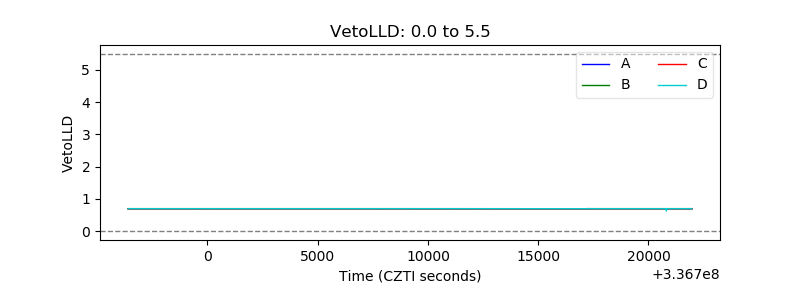 |
| Alpha Counter |  |
| _CPM_Rate | 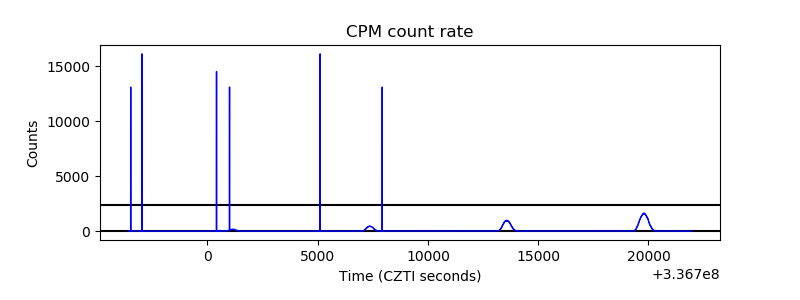 |
| CZT Counter | 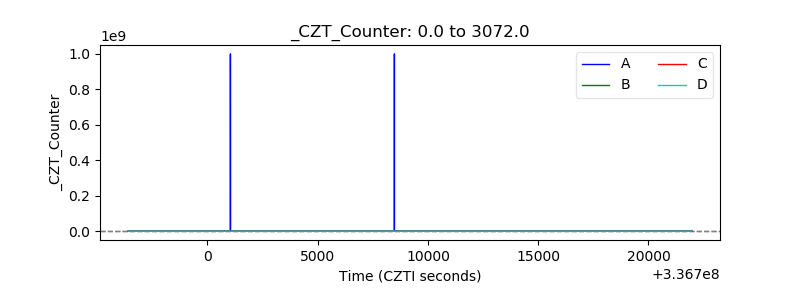 |
| +2.5 Volts monitor | 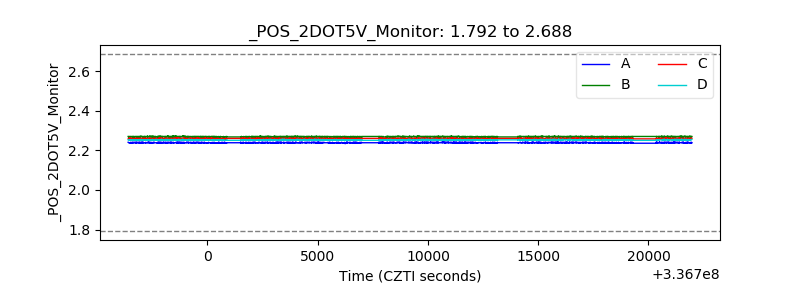 |
| +5 Volts monitor |  |
| _ROLL_ROT |  |
| _Roll_DEC | 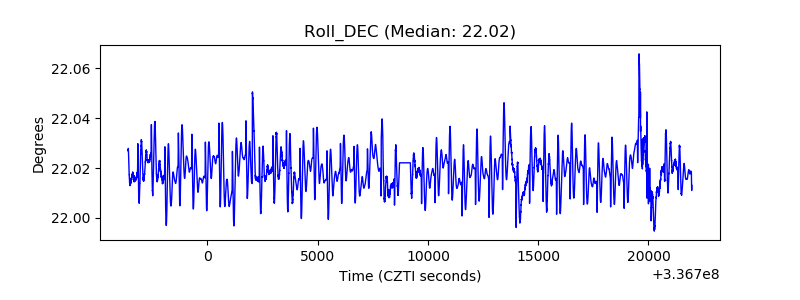 |
| _Roll_RA | 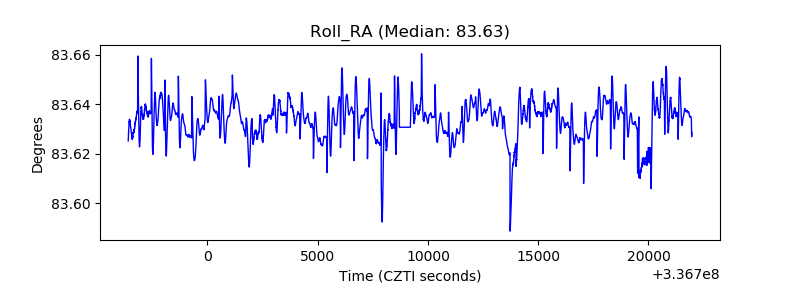 |
| Veto Counter |  |