| Param | Original file | Final file |
|---|---|---|
| Filename | modeM0/AS1A09_145T01_9000003848_26661cztM0_level2.evt | modeM0/AS1A09_145T01_9000003848_26661cztM0_level2_quad_clean.evt |
| Size (bytes) | 889,873,920 | 147,075,840 |
| Size | 848.6 MB | 140.3 MB |
| Events in quadrant A | 5,270,702 | 976,867 |
| Events in quadrant B | 6,048,199 | 965,853 |
| Events in quadrant C | 5,398,221 | 929,290 |
| Events in quadrant D | 9,547,809 | 878,857 |
| Mode M0 | |||
|---|---|---|---|
| Quadrant | BADHDUFLAG | Total packets | Discarded packets |
| A | 0 | 21497 | 0 |
| B | 0 | 23948 | 0 |
| C | 0 | 22009 | 0 |
| D | 0 | 35688 | 0 |
| Mode M9 | |||
|---|---|---|---|
| Quadrant | BADHDUFLAG | Total packets | Discarded packets |
| A | 0 | 24 | 0 |
| B | 0 | 24 | 0 |
| C | 0 | 24 | 0 |
| D | 0 | 24 | 0 |
| Quadrant | Total seconds | Saturated seconds | Saturation percentage |
|---|---|---|---|
| A | 10148 | 44 | 0.433583% |
| B | 10149 | 233 | 2.295793% |
| C | 10149 | 123 | 1.211942% |
| D | 10149 | 535 | 5.271455% |
Noise dominated data is calculated using 1-second bins in cleaned event files. If a bin has >2000 counts, and if more than 50% of those come from <1% of pixels, then it is considered to be noise-dominated and hence unusable.
| Quadrant | # 1 sec bins | Bins with >0 counts | Bins with >2000 counts | High rate bins dominated by noise | Noise dominated (total time) | Noise dominated (detector-on time) | Marked lightcurve |
|---|---|---|---|---|---|---|---|
| A | 12558 | 10150 | 1 | 1 | 0.01% | 0.01% | 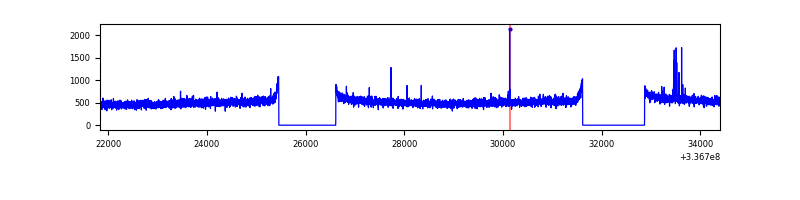 |
| B | 12559 | 10151 | 113 | 113 | 0.90% | 1.11% | 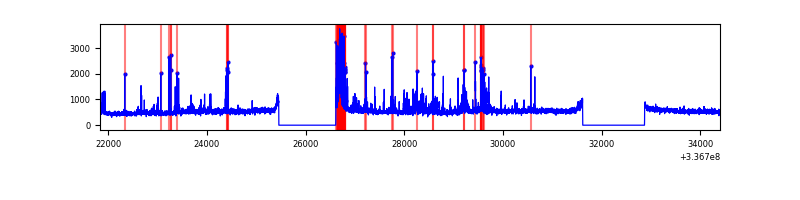 |
| C | 12559 | 10151 | 8 | 8 | 0.06% | 0.08% | 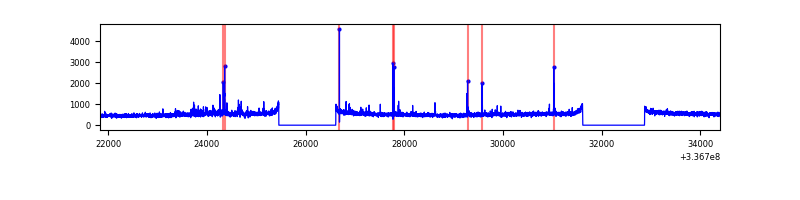 |
| D | 12559 | 10151 | 335 | 335 | 2.67% | 3.30% | 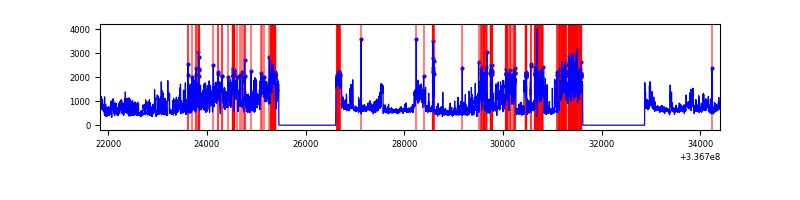 |
Top three noisy pixels from each quadrant. If the there are fewer than three noisy pixels in the level2.evt file, extra rows are filled as -1
| Pixel properties | Quadrant properties | ||||||
|---|---|---|---|---|---|---|---|
| Quadrant | DetID | PixID | Counts | Sigma | Mean | Median | Sigma |
| A | 0 | 13 | 27602 | 97.9 | 1359 | 1339 | 268.3 |
| A | 13 | 254 | 15965 | 54.52 | 1359 | 1339 | 268.3 |
| A | 0 | 226 | 11628 | 38.35 | 1359 | 1339 | 268.3 |
| B | 10 | 245 | 735064 | 2956.22 | 1321 | 1292 | 248.2 |
| B | 0 | 189 | 99274 | 394.75 | 1321 | 1292 | 248.2 |
| B | 3 | 112 | 32064 | 123.97 | 1321 | 1292 | 248.2 |
| C | 14 | 238 | 207892 | 699.9 | 1277 | 1292 | 295.2 |
| C | 3 | 233 | 81128 | 270.46 | 1277 | 1292 | 295.2 |
| C | 2 | 16 | 68298 | 226.99 | 1277 | 1292 | 295.2 |
| D | 1 | 52 | 2555628 | 8116.61 | 1289 | 1254 | 314.7 |
| D | 7 | 80 | 1865858 | 5924.85 | 1289 | 1254 | 314.7 |
| D | 2 | 250 | 146963 | 463.0 | 1289 | 1254 | 314.7 |
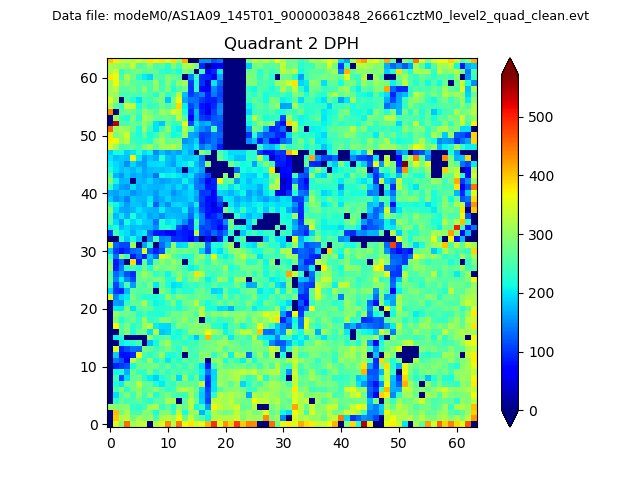
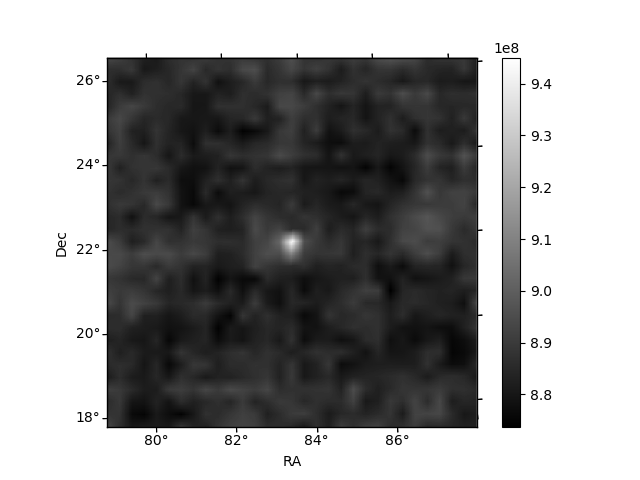
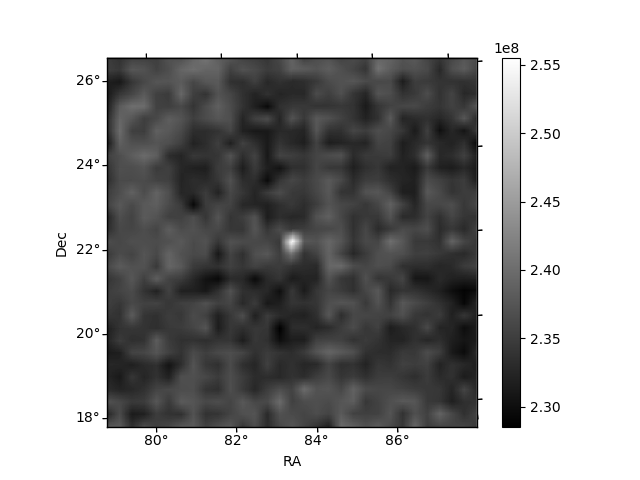
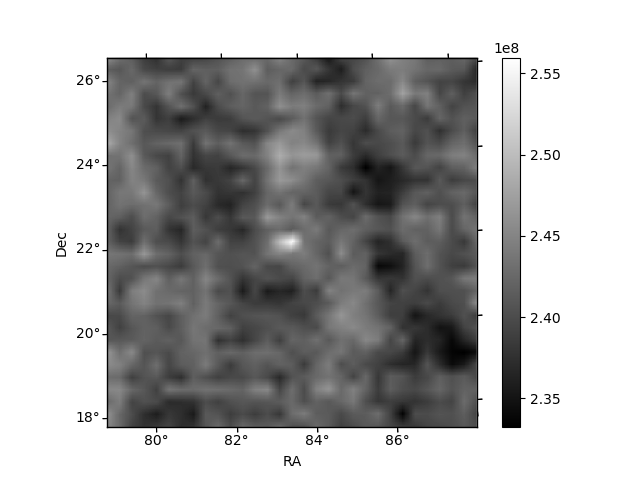
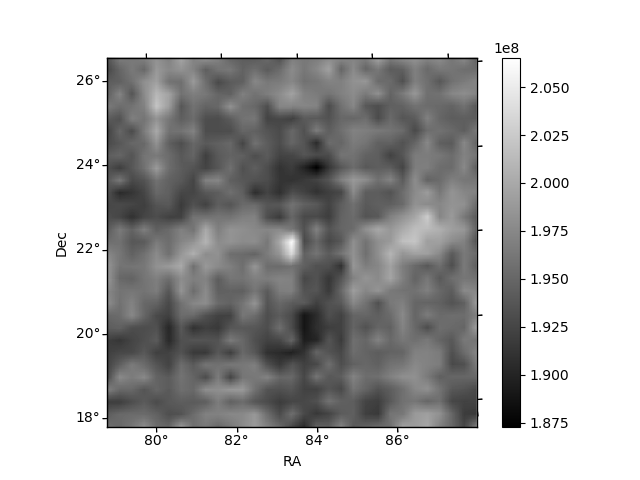
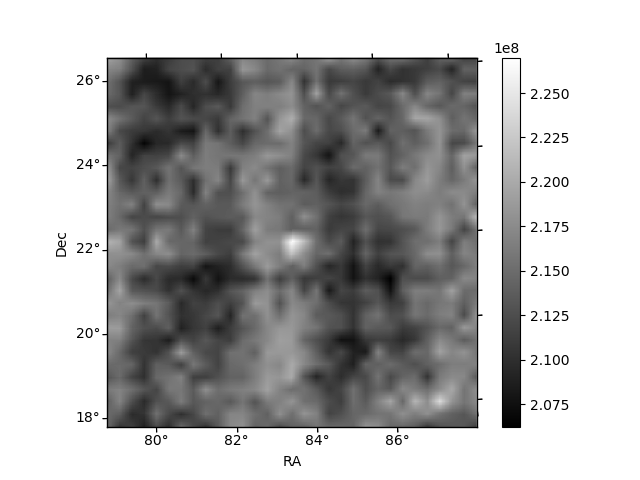
Histogram calculated using DETX and DETY for each event in the final _common_clean file
| Quadrant A | 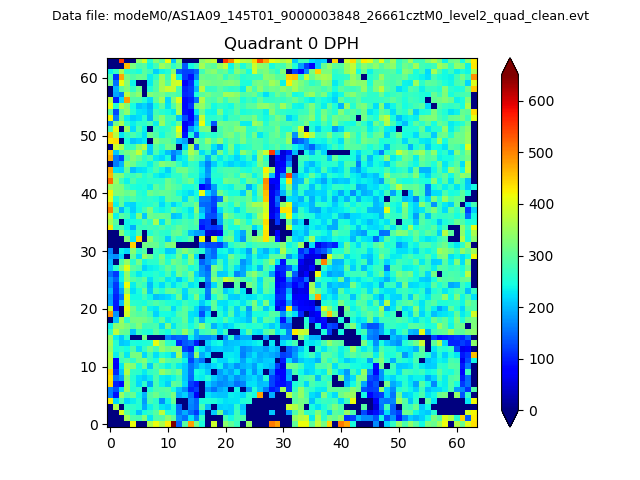 |
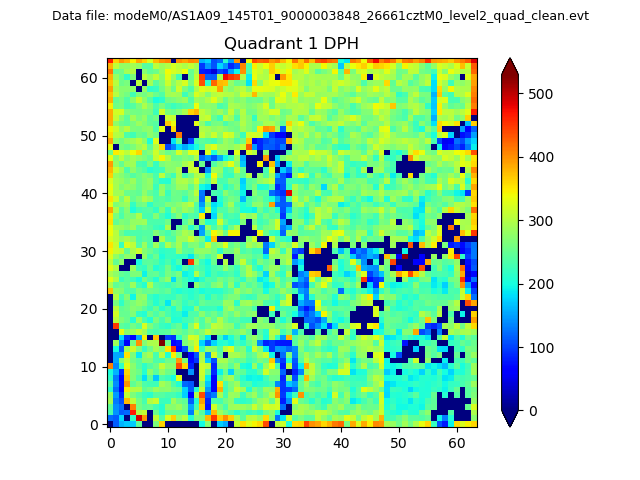 |
Quadrant B |
|---|---|---|---|
| Quadrant D | 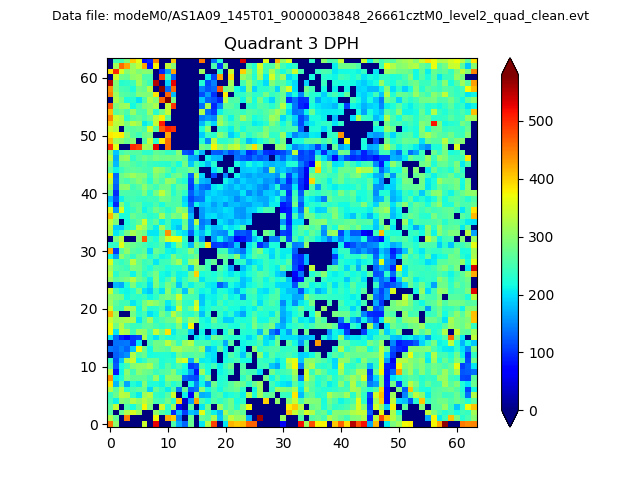 |
 |
Quadrant C |
| Plot type | Count rate plots | Images |
|---|---|---|
| Comparison with Poisson distribution Blue bars denote a histogram of data divided into 1 sec bins. Red curve is a Poisson curve with rate = median count rate of data. |
 |
 |
| Quadrant-wise count rates Data is divided into 100 sec bins |
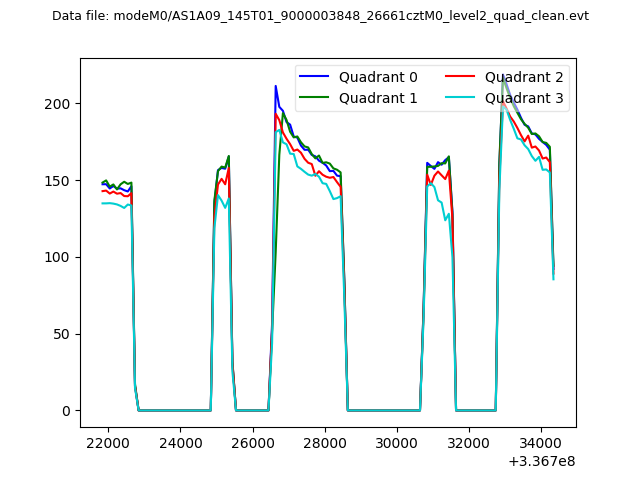 |
|
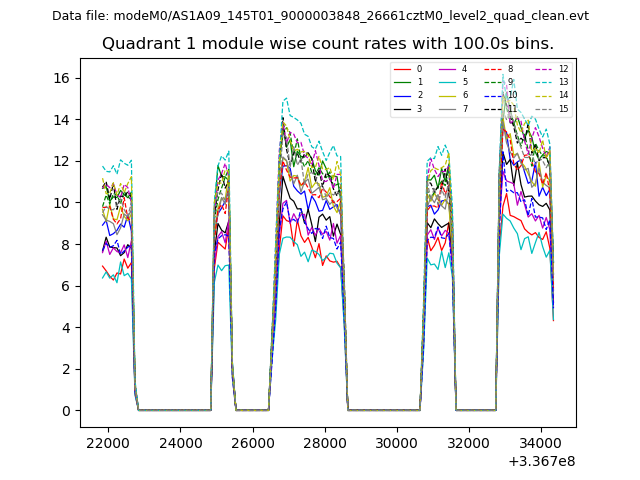
| Module-wise count rates for Quadrant A Data is divided into 100 sec bins |
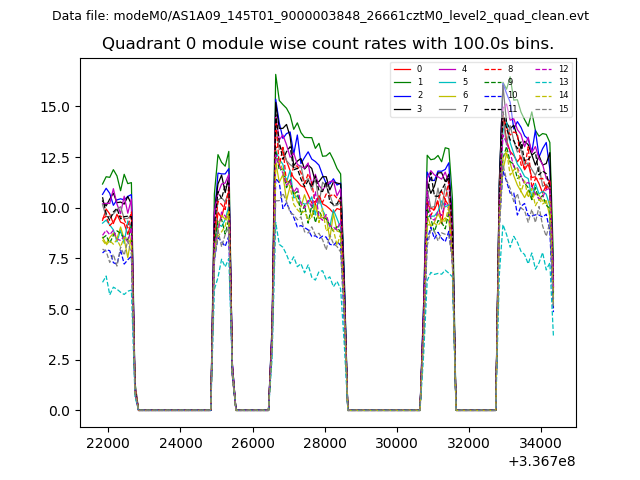 |
 |
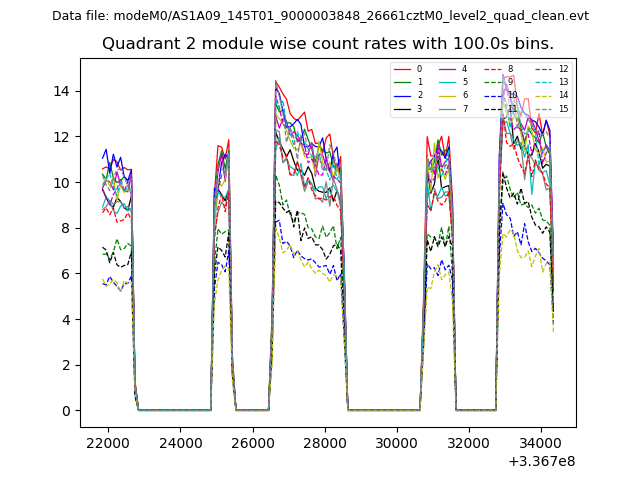
| Module-wise count rates for Quadrant B Data is divided into 100 sec bins |
 |
 |
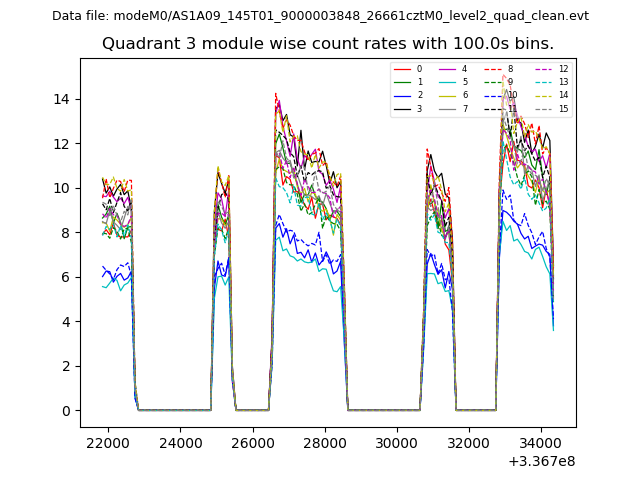
| Module-wise count rates for Quadrant C Data is divided into 100 sec bins |
 |
 |
| Module-wise count rates for Quadrant D Data is divided into 100 sec bins |
 |
 |
| Parameter | Plot |
|---|---|
| CZT HV Monitor | 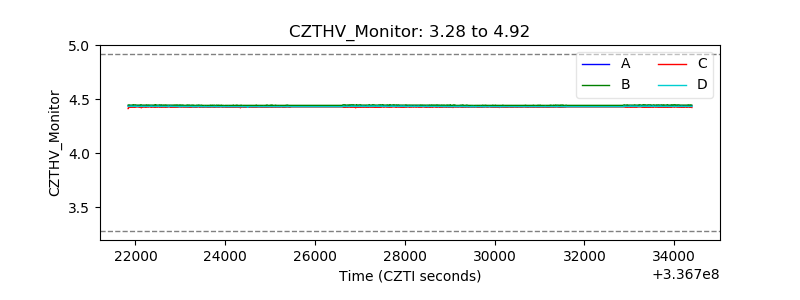 |
| D_VDD | 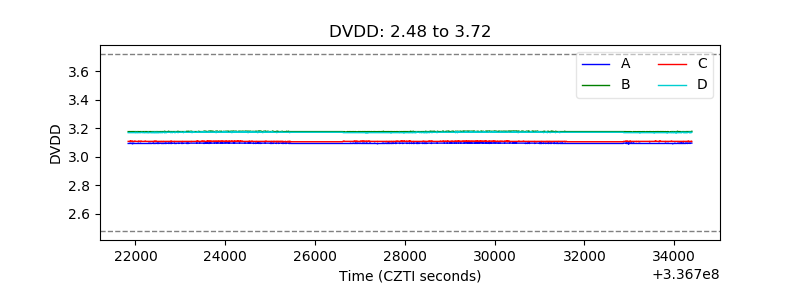 |
| Temperature 1 | 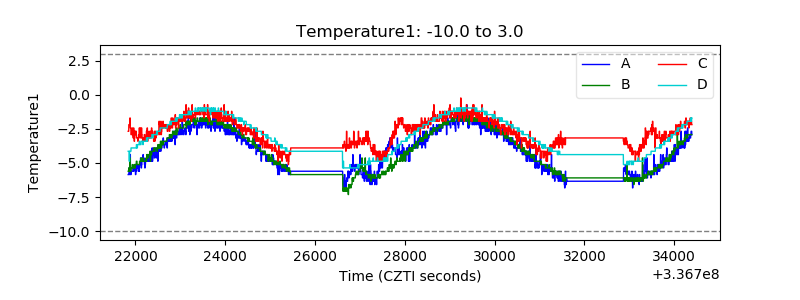 |
| Veto HV Monitor | 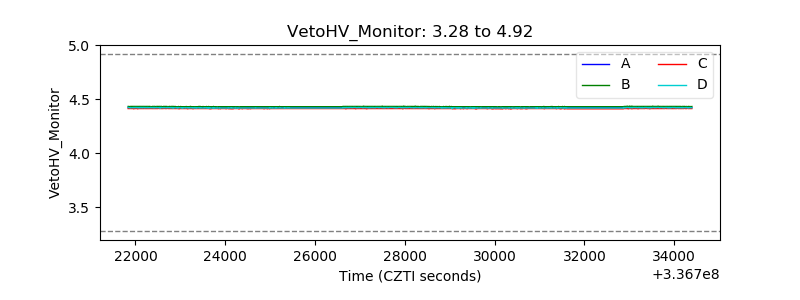 |
| Veto LLD | 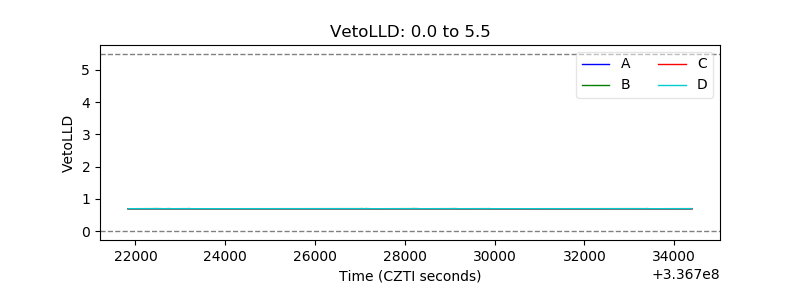 |
| Alpha Counter | 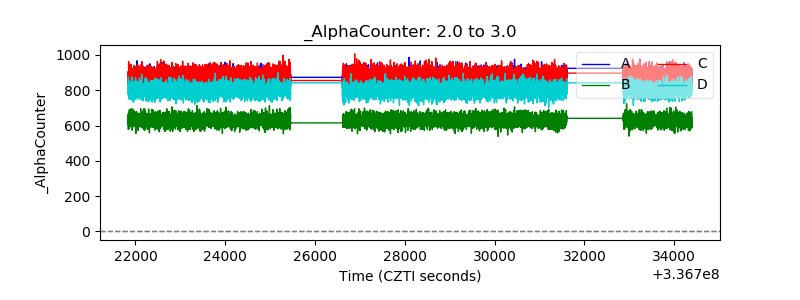 |
| _CPM_Rate | 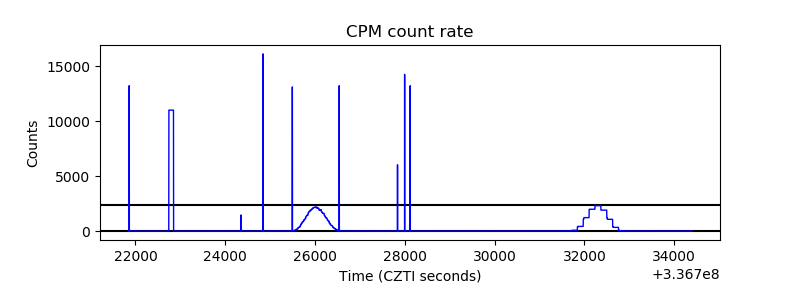 |
| CZT Counter | 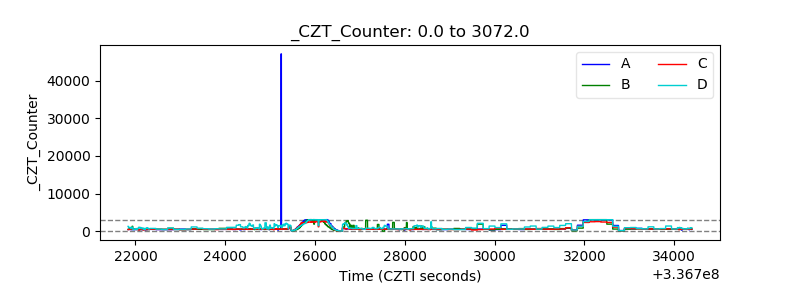 |
| +2.5 Volts monitor |  |
| +5 Volts monitor |  |
| _ROLL_ROT |  |
| _Roll_DEC | 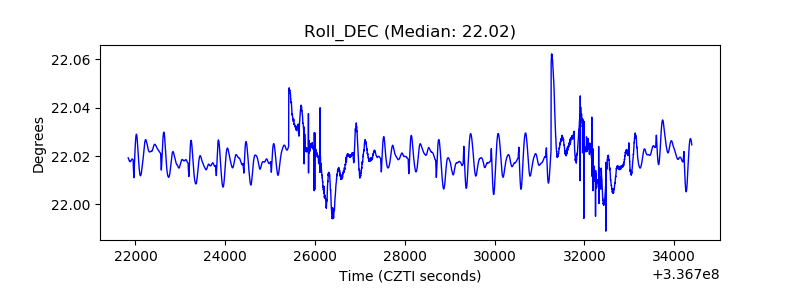 |
| _Roll_RA | 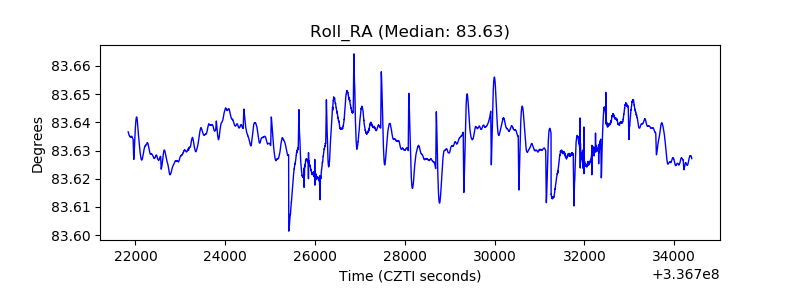 |
| Veto Counter | 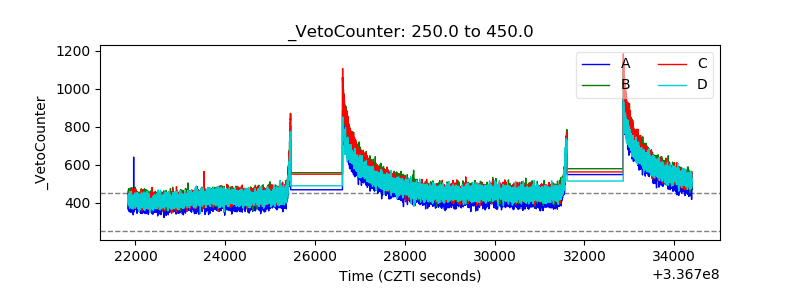 |