| Param | Original file | Final file |
|---|---|---|
| Filename | modeM0/AS1A09_145T01_9000003848_26662cztM0_level2.evt | modeM0/AS1A09_145T01_9000003848_26662cztM0_level2_quad_clean.evt |
| Size (bytes) | 502,790,400 | 85,147,200 |
| Size | 479.5 MB | 81.2 MB |
| Events in quadrant A | 3,049,331 | 567,886 |
| Events in quadrant B | 2,950,455 | 569,358 |
| Events in quadrant C | 3,133,853 | 535,128 |
| Events in quadrant D | 5,725,127 | 525,849 |
| Mode M0 | |||
|---|---|---|---|
| Quadrant | BADHDUFLAG | Total packets | Discarded packets |
| A | 0 | 12173 | 0 |
| B | 0 | 11843 | 0 |
| C | 0 | 12472 | 0 |
| D | 0 | 20695 | 0 |
| Mode M9 | |||
|---|---|---|---|
| Quadrant | BADHDUFLAG | Total packets | Discarded packets |
| A | 0 | 13 | 0 |
| B | 0 | 13 | 0 |
| C | 0 | 13 | 0 |
| D | 0 | 13 | 0 |
| Quadrant | Total seconds | Saturated seconds | Saturation percentage |
|---|---|---|---|
| A | 5435 | 65 | 1.195952% |
| B | 5436 | 38 | 0.699043% |
| C | 5436 | 127 | 2.336277% |
| D | 5436 | 671 | 12.343635% |
Noise dominated data is calculated using 1-second bins in cleaned event files. If a bin has >2000 counts, and if more than 50% of those come from <1% of pixels, then it is considered to be noise-dominated and hence unusable.
| Quadrant | # 1 sec bins | Bins with >0 counts | Bins with >2000 counts | High rate bins dominated by noise | Noise dominated (total time) | Noise dominated (detector-on time) | Marked lightcurve |
|---|---|---|---|---|---|---|---|
| A | 6735 | 5436 | 2 | 2 | 0.03% | 0.04% | 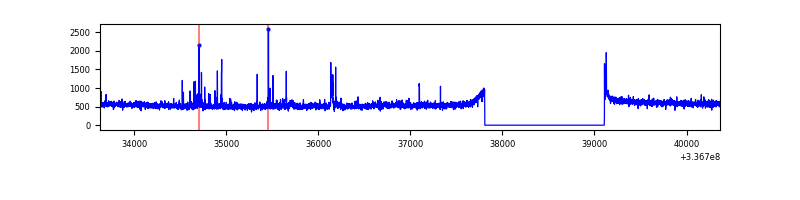 |
| B | 6736 | 5437 | 0 | 0 | 0.00% | 0.00% | 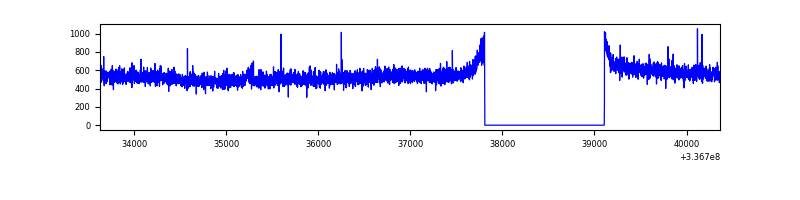 |
| C | 6736 | 5437 | 51 | 51 | 0.76% | 0.94% | 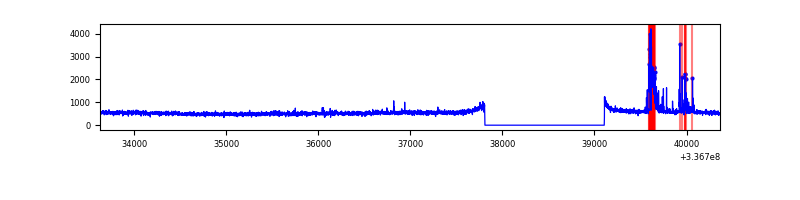 |
| D | 6736 | 5437 | 599 | 599 | 8.89% | 11.02% | 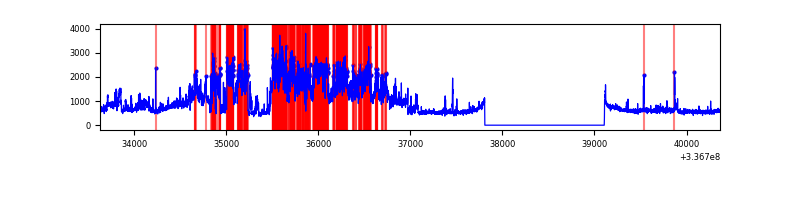 |
Top three noisy pixels from each quadrant. If the there are fewer than three noisy pixels in the level2.evt file, extra rows are filled as -1
| Pixel properties | Quadrant properties | ||||||
|---|---|---|---|---|---|---|---|
| Quadrant | DetID | PixID | Counts | Sigma | Mean | Median | Sigma |
| A | 0 | 13 | 55846 | 362.43 | 766 | 756 | 152.0 |
| A | 12 | 96 | 35426 | 228.09 | 766 | 756 | 152.0 |
| A | 13 | 254 | 9399 | 56.86 | 766 | 756 | 152.0 |
| B | 12 | 111 | 16133 | 108.85 | 747 | 732 | 141.5 |
| B | 11 | 111 | 14432 | 96.83 | 747 | 732 | 141.5 |
| B | 0 | 189 | 14015 | 93.88 | 747 | 732 | 141.5 |
| C | 2 | 16 | 197406 | 1174.8 | 717 | 724 | 167.4 |
| C | 14 | 238 | 117355 | 696.65 | 717 | 724 | 167.4 |
| C | 3 | 233 | 16847 | 96.3 | 717 | 724 | 167.4 |
| D | 7 | 80 | 1979147 | 11340.6 | 720 | 701 | 174.5 |
| D | 1 | 52 | 936081 | 5361.67 | 720 | 701 | 174.5 |
| D | 2 | 250 | 53457 | 302.4 | 720 | 701 | 174.5 |
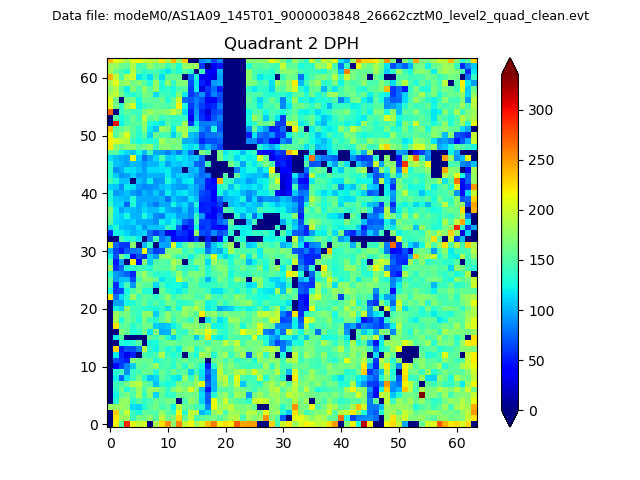
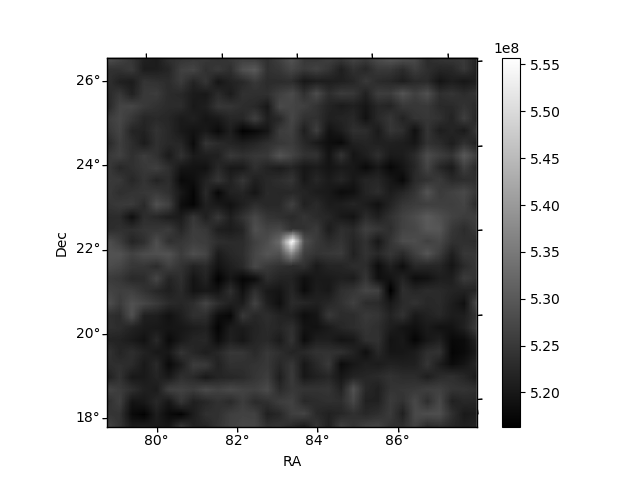
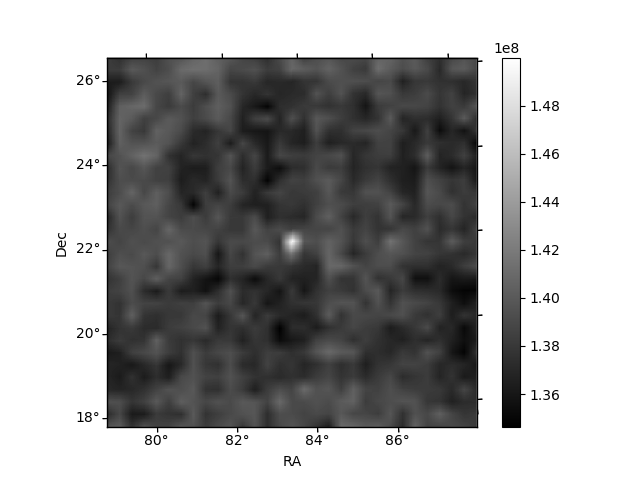
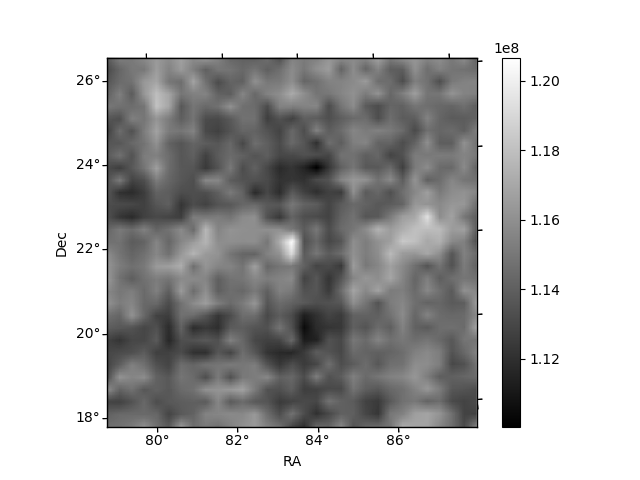
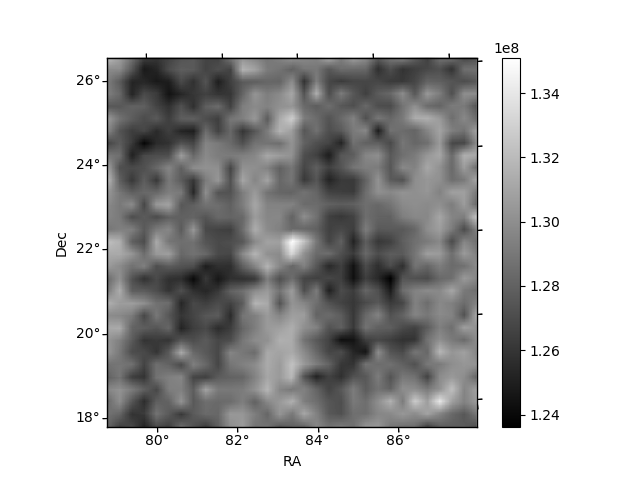
Histogram calculated using DETX and DETY for each event in the final _common_clean file
| Quadrant A | 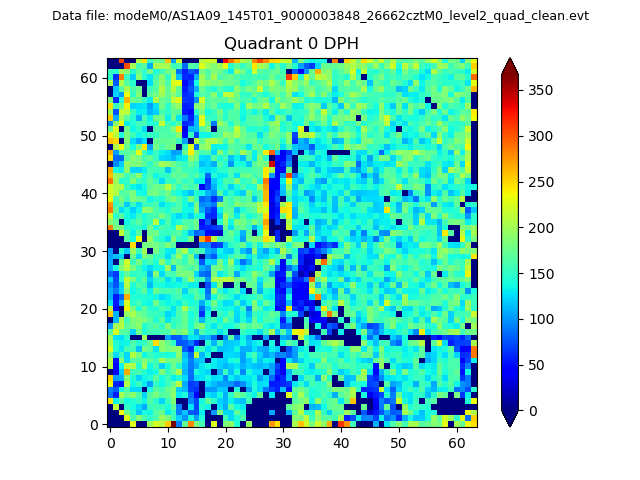 |
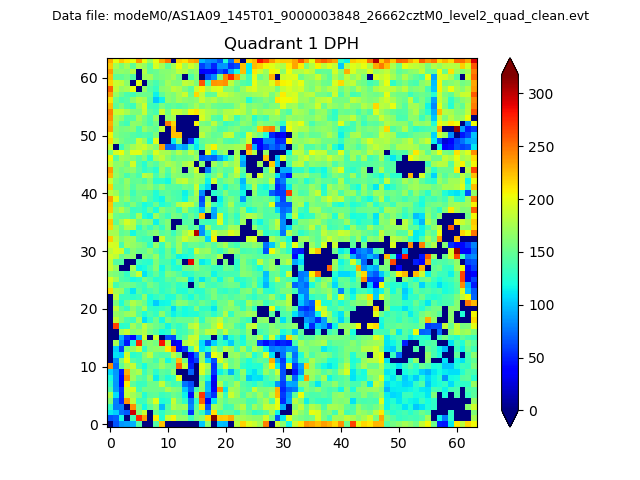 |
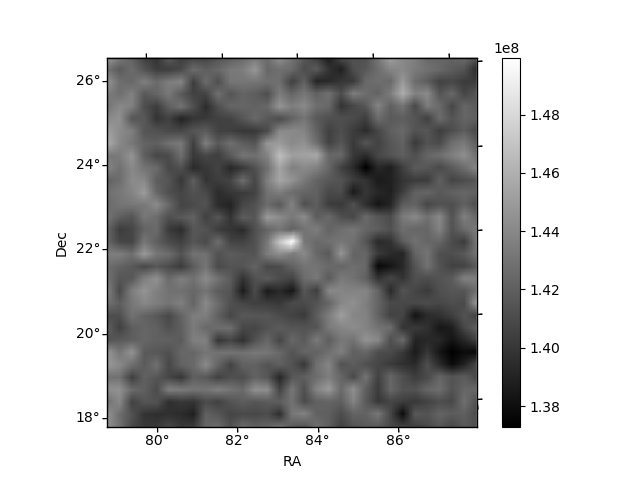
Quadrant B |
|---|---|---|---|
| Quadrant D | 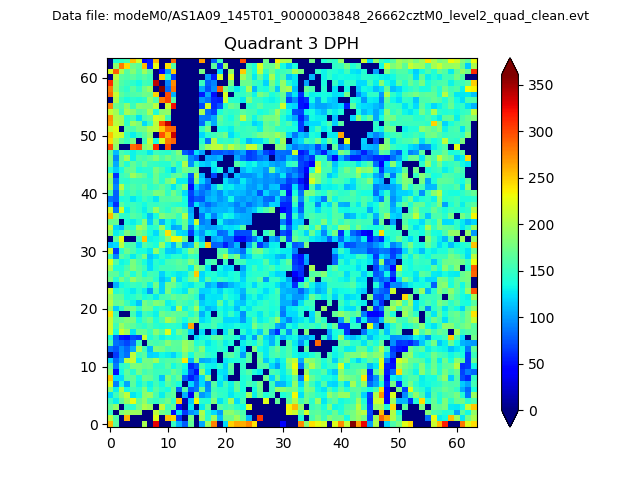 |
 |
Quadrant C |
| Plot type | Count rate plots | Images |
|---|---|---|
| Comparison with Poisson distribution Blue bars denote a histogram of data divided into 1 sec bins. Red curve is a Poisson curve with rate = median count rate of data. |
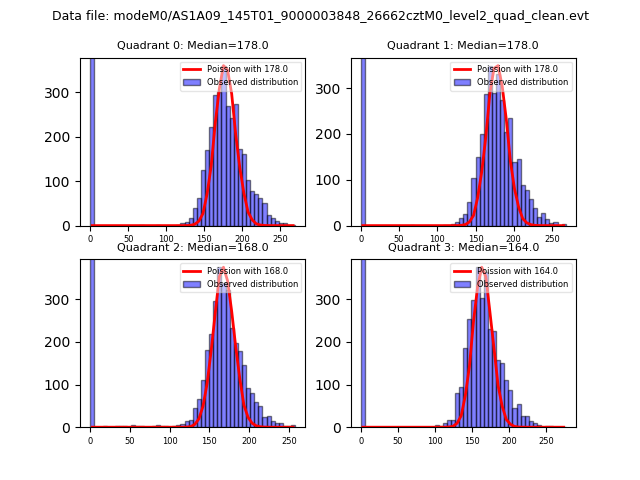 |
 |
| Quadrant-wise count rates Data is divided into 100 sec bins |
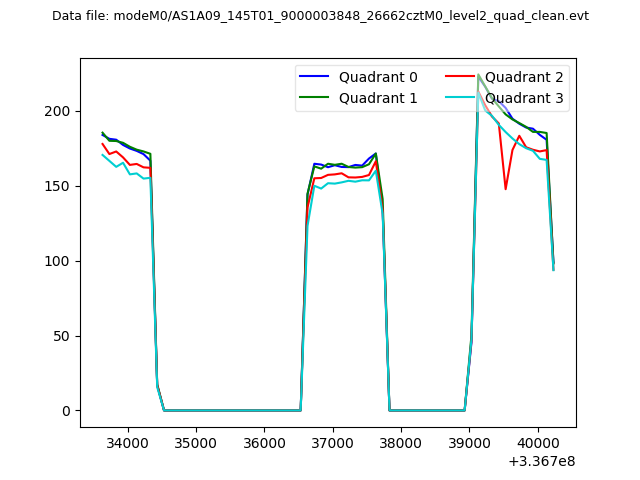 |
|
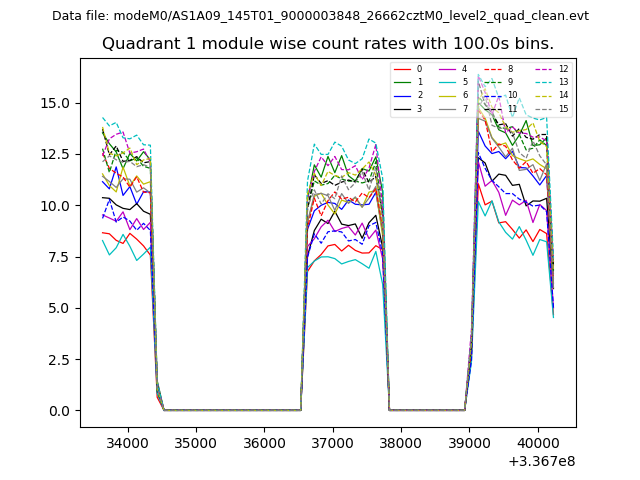
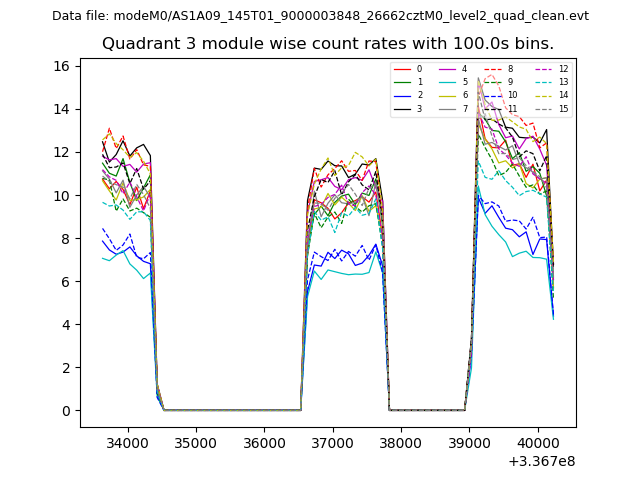
| Module-wise count rates for Quadrant A Data is divided into 100 sec bins |
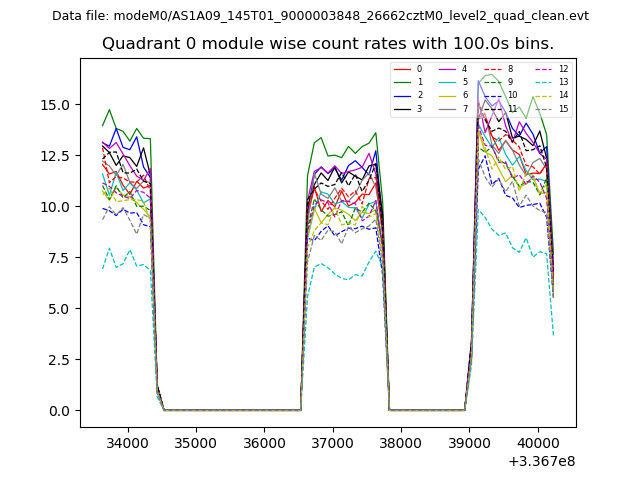 |
 |
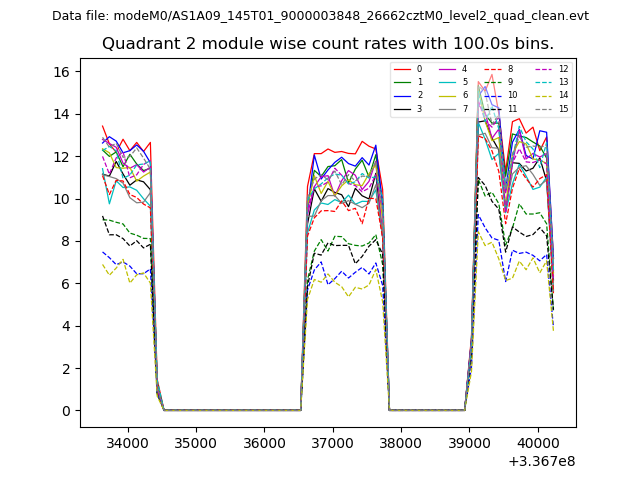
| Module-wise count rates for Quadrant B Data is divided into 100 sec bins |
 |
 |
| Module-wise count rates for Quadrant C Data is divided into 100 sec bins |
 |
 |
| Module-wise count rates for Quadrant D Data is divided into 100 sec bins |
 |
 |
| Parameter | Plot |
|---|---|
| CZT HV Monitor | 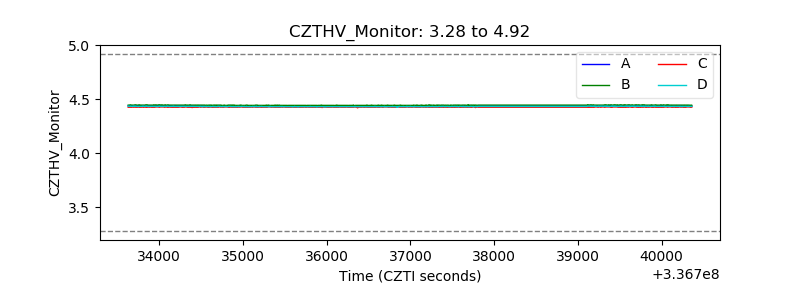 |
| D_VDD | 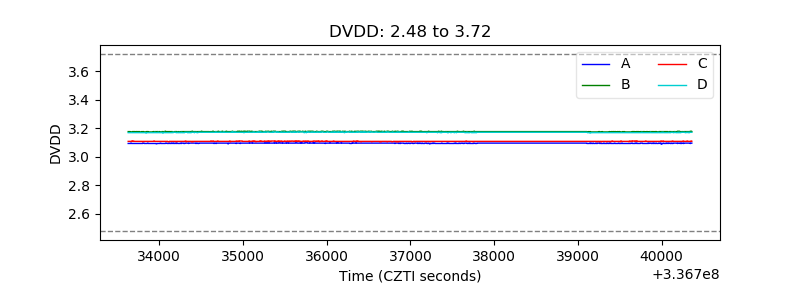 |
| Temperature 1 | 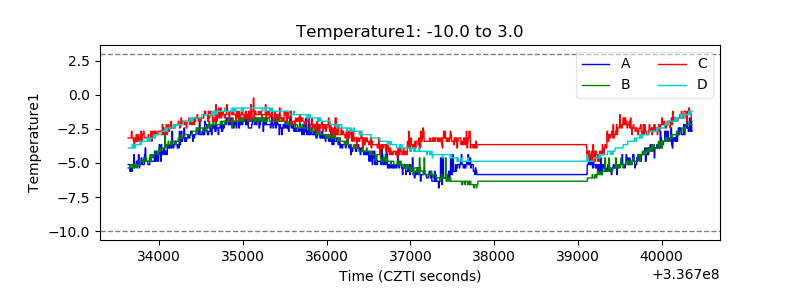 |
| Veto HV Monitor | 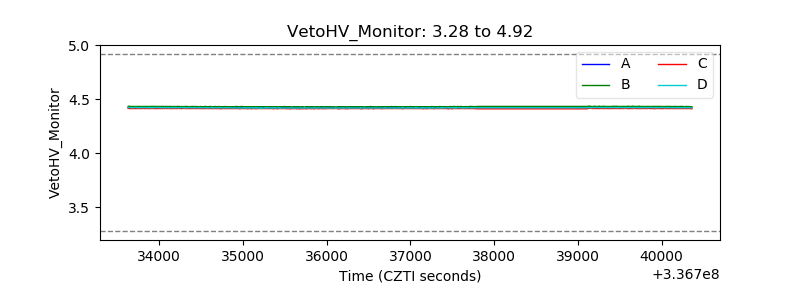 |
| Veto LLD | 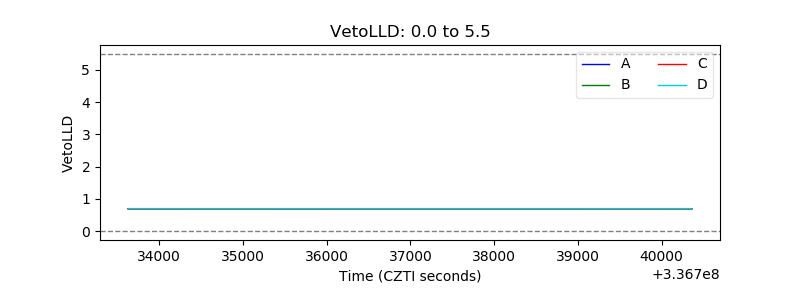 |
| Alpha Counter | 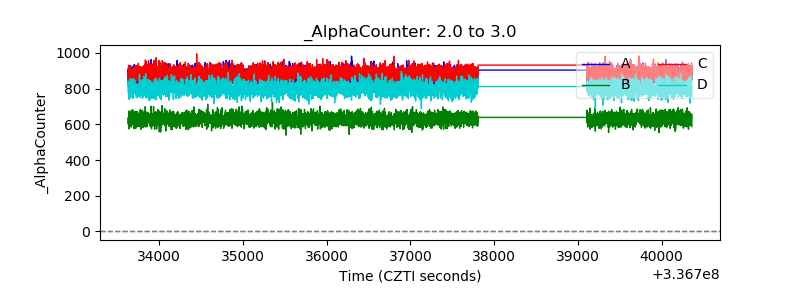 |
| _CPM_Rate |  |
| CZT Counter | 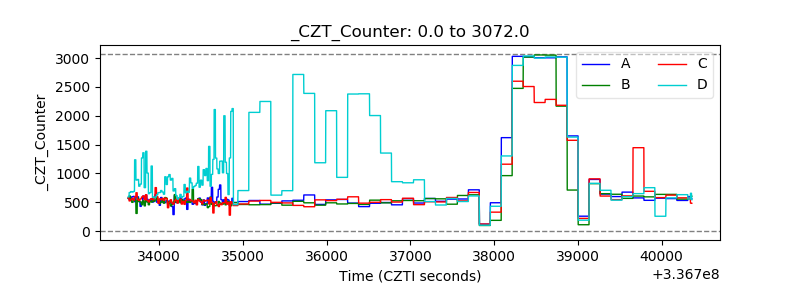 |
| +2.5 Volts monitor | 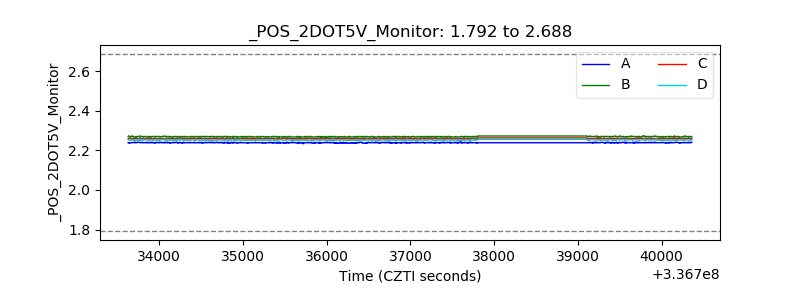 |
| +5 Volts monitor |  |
| _ROLL_ROT | 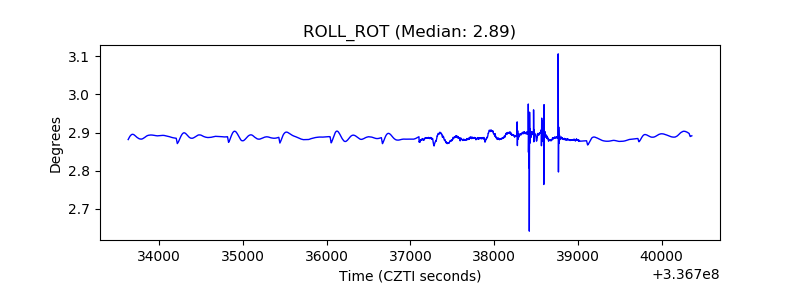 |
| _Roll_DEC | 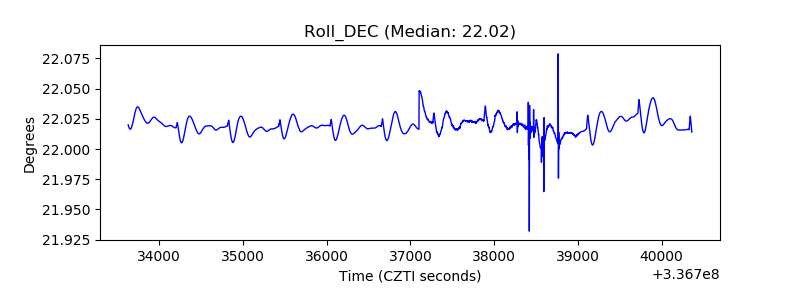 |
| _Roll_RA | 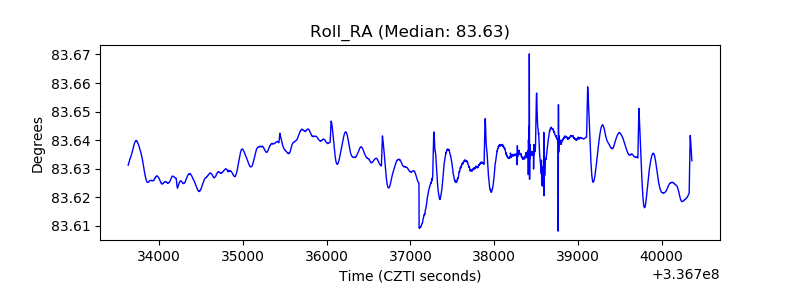 |
| Veto Counter | 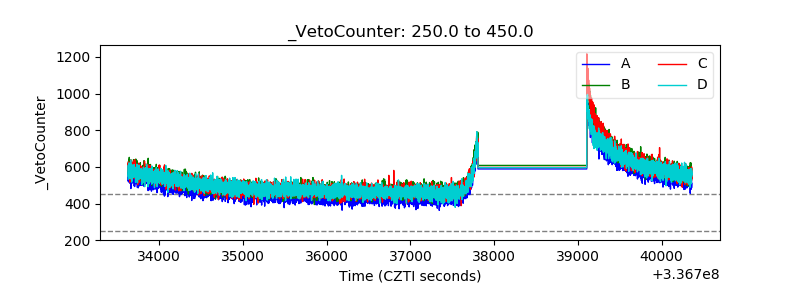 |