| Param | Original file | Final file |
|---|---|---|
| Filename | modeM0/AS1A09_145T01_9000003848_26663cztM0_level2.evt | modeM0/AS1A09_145T01_9000003848_26663cztM0_level2_quad_clean.evt |
| Size (bytes) | 471,749,760 | 79,015,680 |
| Size | 449.9 MB | 75.4 MB |
| Events in quadrant A | 3,221,884 | 513,773 |
| Events in quadrant B | 3,087,866 | 515,660 |
| Events in quadrant C | 3,251,055 | 490,612 |
| Events in quadrant D | 4,342,087 | 476,939 |
| Mode M0 | |||
|---|---|---|---|
| Quadrant | BADHDUFLAG | Total packets | Discarded packets |
| A | 0 | 12937 | 0 |
| B | 0 | 12251 | 0 |
| C | 0 | 12904 | 0 |
| D | 0 | 16487 | 0 |
| Mode M9 | |||
|---|---|---|---|
| Quadrant | BADHDUFLAG | Total packets | Discarded packets |
| A | 0 | 12 | 0 |
| B | 0 | 12 | 0 |
| C | 0 | 12 | 0 |
| D | 0 | 12 | 0 |
| Quadrant | Total seconds | Saturated seconds | Saturation percentage |
|---|---|---|---|
| A | 5656 | 82 | 1.449788% |
| B | 5656 | 82 | 1.449788% |
| C | 5656 | 130 | 2.298444% |
| D | 5656 | 410 | 7.248939% |
Noise dominated data is calculated using 1-second bins in cleaned event files. If a bin has >2000 counts, and if more than 50% of those come from <1% of pixels, then it is considered to be noise-dominated and hence unusable.
| Quadrant | # 1 sec bins | Bins with >0 counts | Bins with >2000 counts | High rate bins dominated by noise | Noise dominated (total time) | Noise dominated (detector-on time) | Marked lightcurve |
|---|---|---|---|---|---|---|---|
| A | 6946 | 5657 | 1 | 1 | 0.01% | 0.02% | 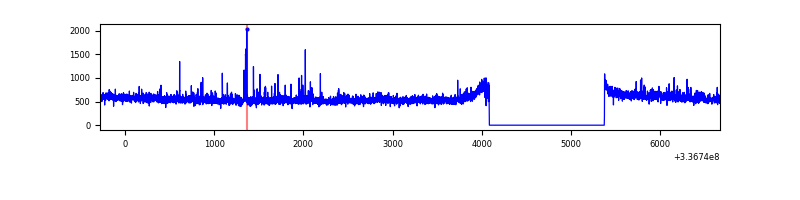 |
| B | 6946 | 5657 | 0 | 0 | 0.00% | 0.00% | 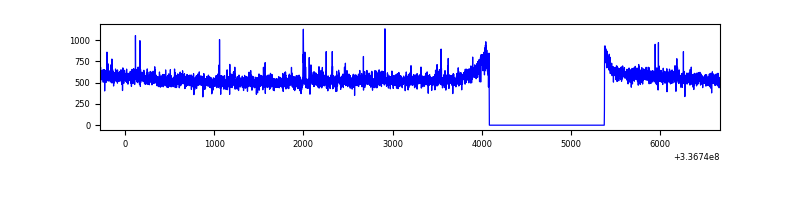 |
| C | 6946 | 5657 | 21 | 21 | 0.30% | 0.37% | 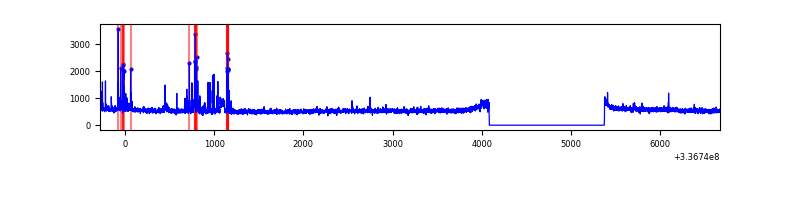 |
| D | 6946 | 5657 | 278 | 278 | 4.00% | 4.91% | 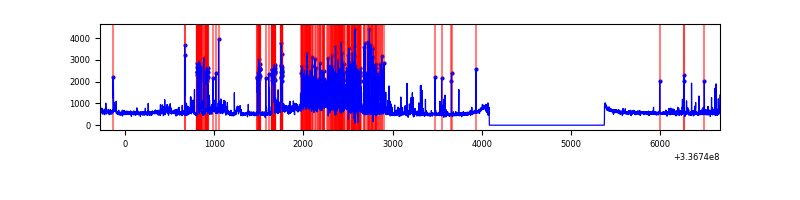 |
Top three noisy pixels from each quadrant. If the there are fewer than three noisy pixels in the level2.evt file, extra rows are filled as -1
| Pixel properties | Quadrant properties | ||||||
|---|---|---|---|---|---|---|---|
| Quadrant | DetID | PixID | Counts | Sigma | Mean | Median | Sigma |
| A | 0 | 13 | 140730 | 883.67 | 797 | 784 | 158.4 |
| A | 13 | 254 | 9604 | 55.69 | 797 | 784 | 158.4 |
| A | 0 | 226 | 7037 | 39.48 | 797 | 784 | 158.4 |
| B | 3 | 112 | 27224 | 181.06 | 776 | 761 | 146.2 |
| B | 12 | 111 | 16673 | 108.87 | 776 | 761 | 146.2 |
| B | 11 | 111 | 15268 | 99.25 | 776 | 761 | 146.2 |
| C | 2 | 16 | 182666 | 1046.68 | 749 | 758 | 173.8 |
| C | 14 | 238 | 122132 | 698.38 | 749 | 758 | 173.8 |
| C | 3 | 233 | 21253 | 117.93 | 749 | 758 | 173.8 |
| D | 7 | 80 | 777835 | 4248.58 | 757 | 737 | 182.9 |
| D | 1 | 52 | 475978 | 2598.25 | 757 | 737 | 182.9 |
| D | 2 | 250 | 119326 | 648.35 | 757 | 737 | 182.9 |
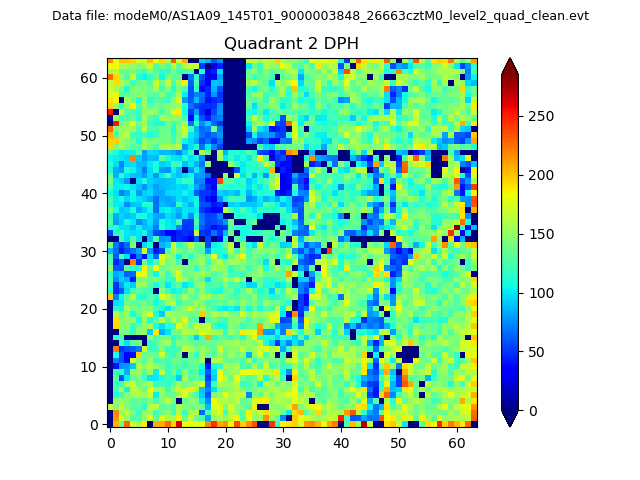
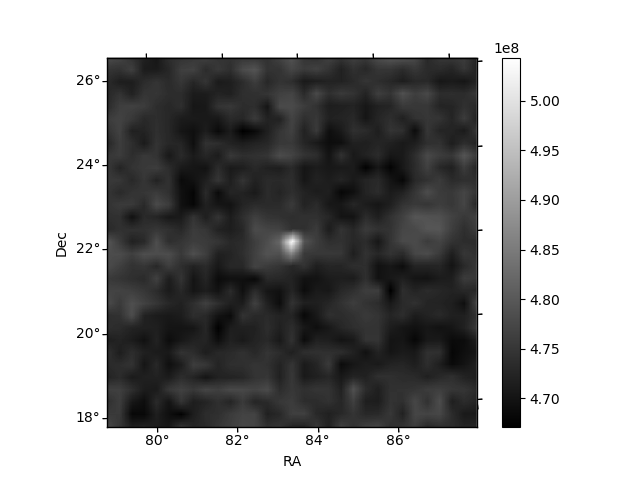
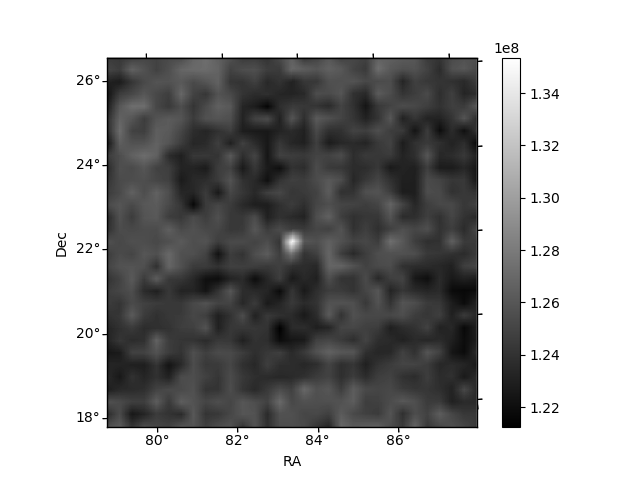
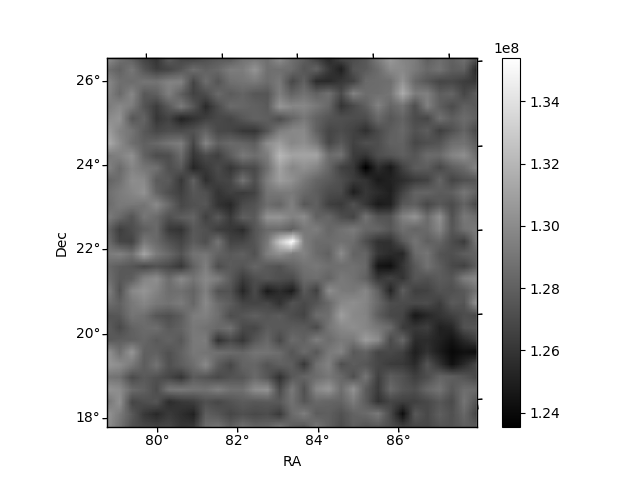
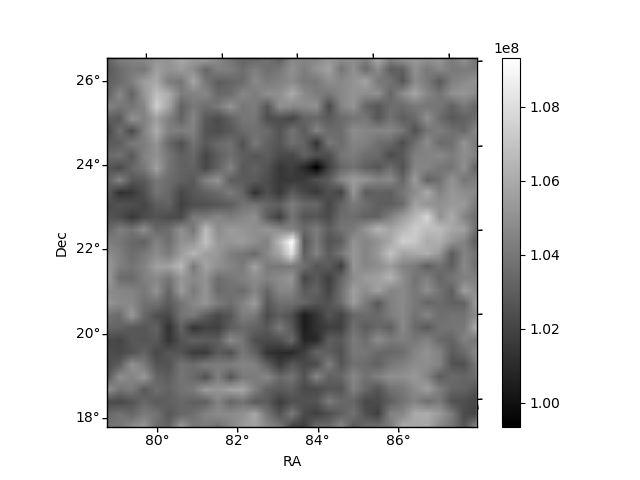
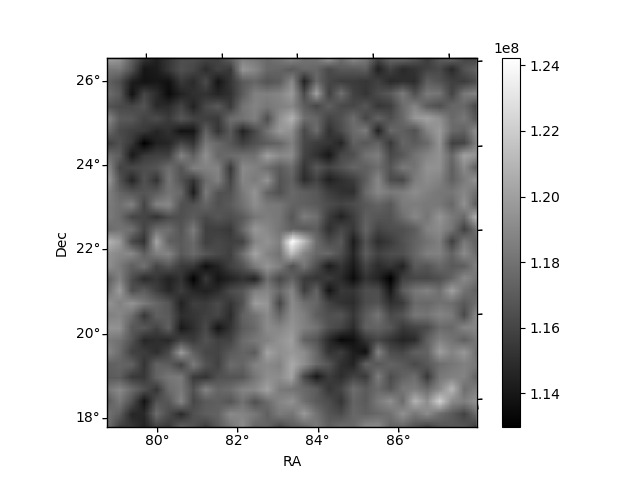
Histogram calculated using DETX and DETY for each event in the final _common_clean file
| Quadrant A | 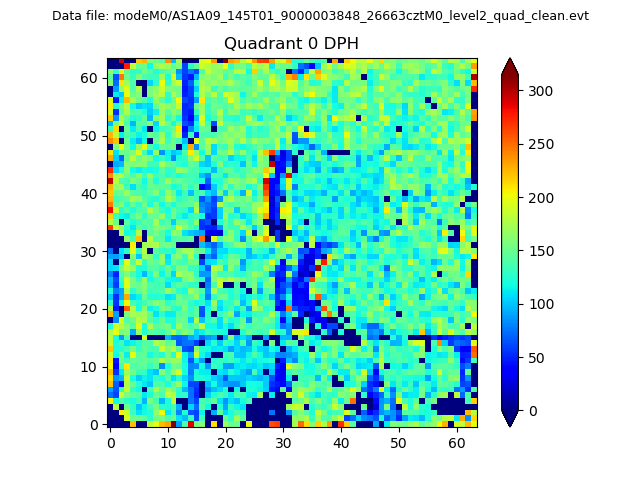 |
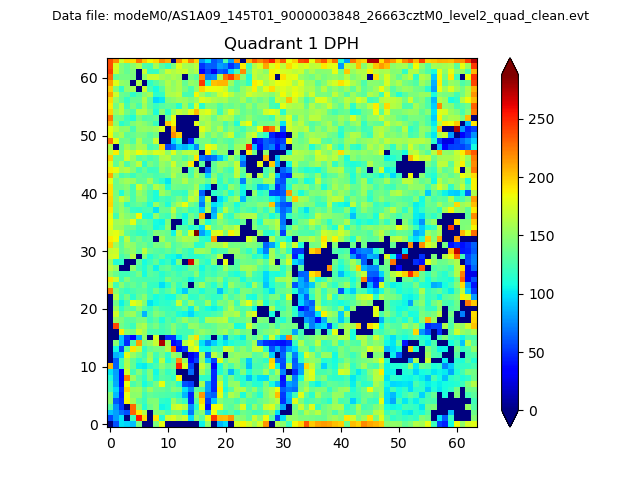 |
Quadrant B |
|---|---|---|---|
| Quadrant D | 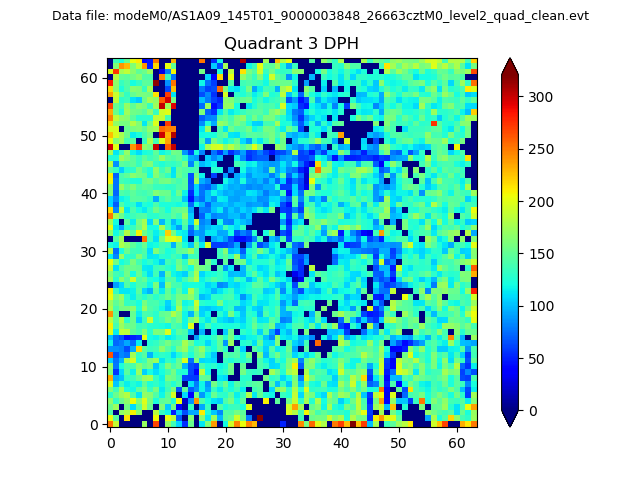 |
 |
Quadrant C |
| Plot type | Count rate plots | Images |
|---|---|---|
| Comparison with Poisson distribution Blue bars denote a histogram of data divided into 1 sec bins. Red curve is a Poisson curve with rate = median count rate of data. |
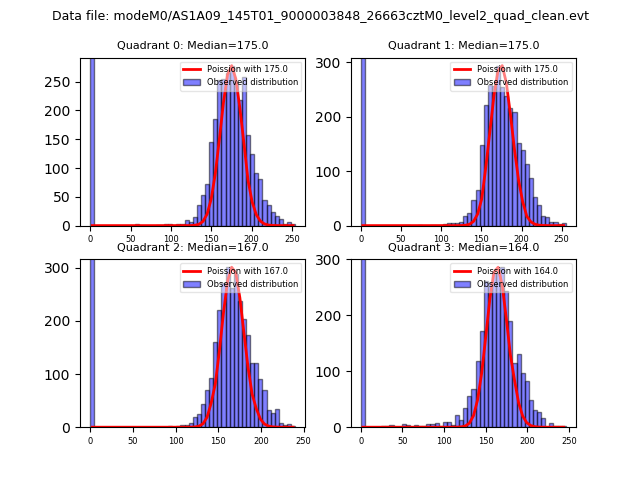 |
 |
| Quadrant-wise count rates Data is divided into 100 sec bins |
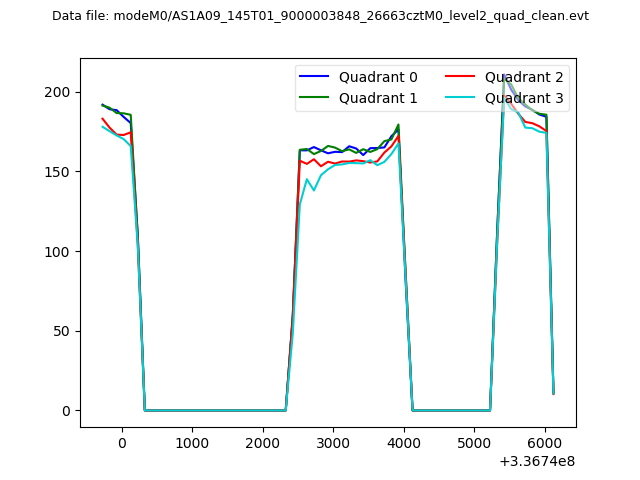 |
|
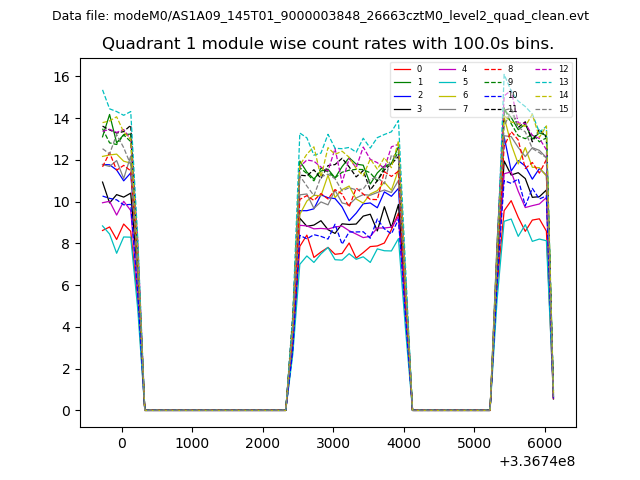
| Module-wise count rates for Quadrant A Data is divided into 100 sec bins |
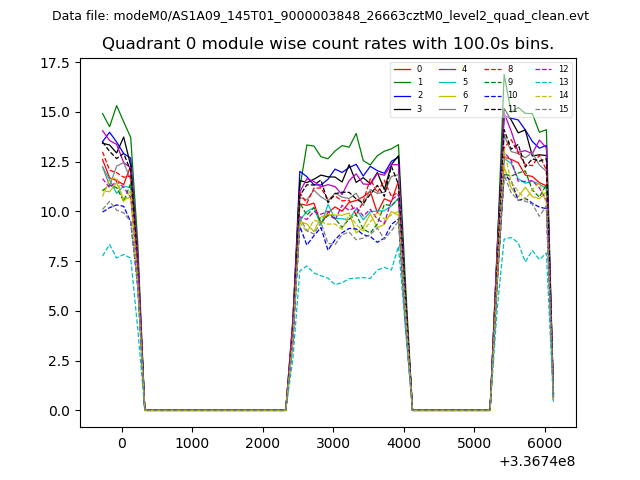 |
 |
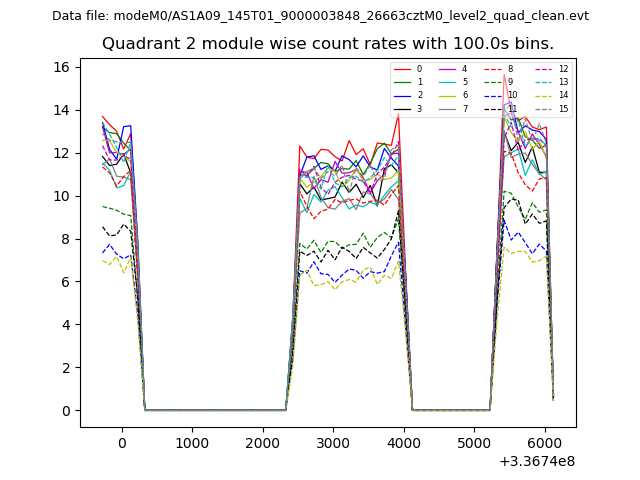
| Module-wise count rates for Quadrant B Data is divided into 100 sec bins |
 |
 |
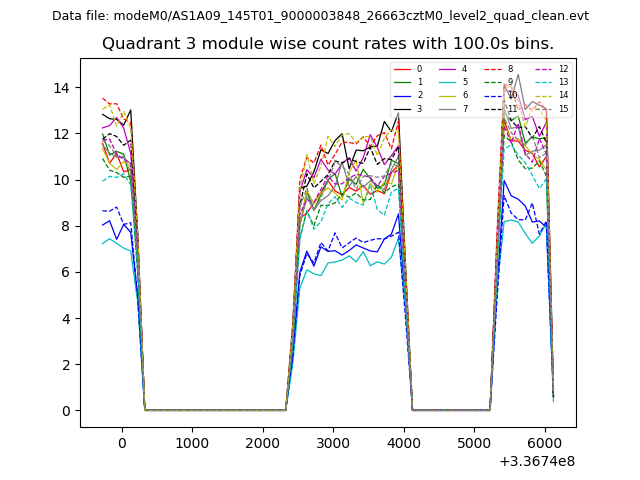
| Module-wise count rates for Quadrant C Data is divided into 100 sec bins |
 |
 |
| Module-wise count rates for Quadrant D Data is divided into 100 sec bins |
 |
 |
| Parameter | Plot |
|---|---|
| CZT HV Monitor | 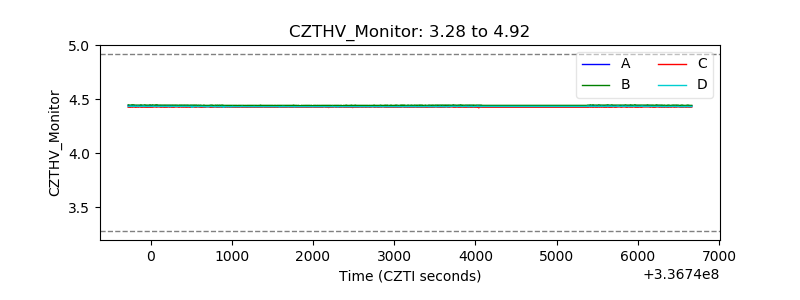 |
| D_VDD | 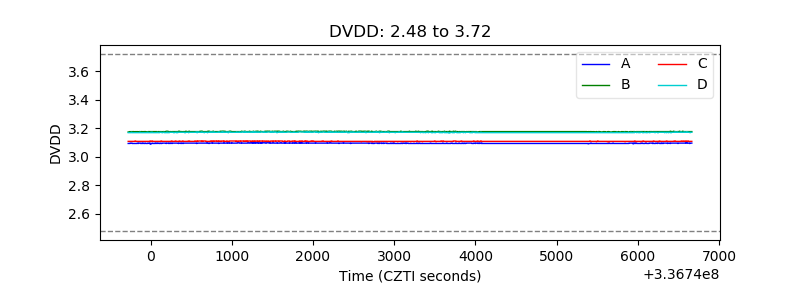 |
| Temperature 1 | 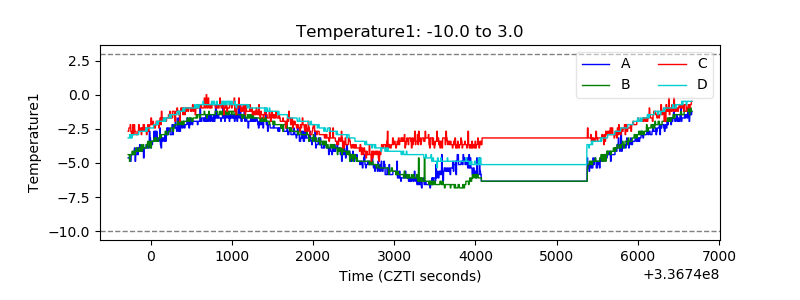 |
| Veto HV Monitor | 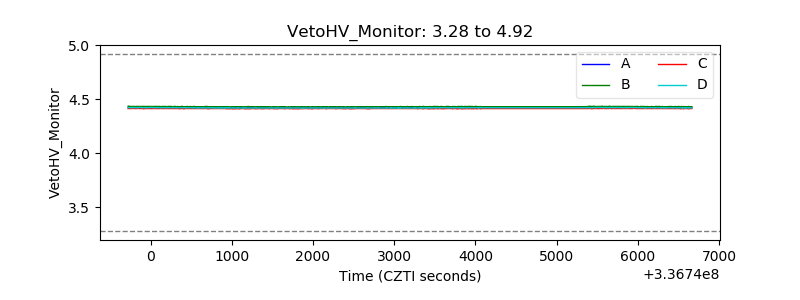 |
| Veto LLD | 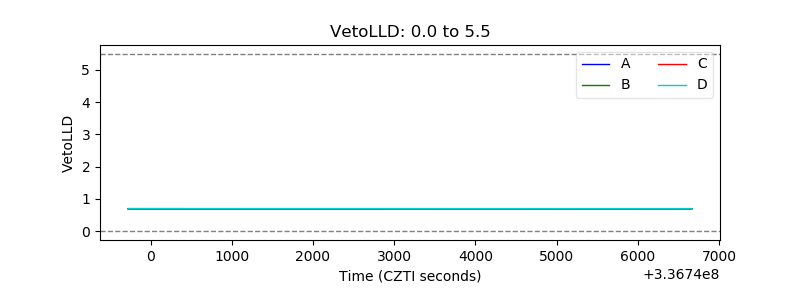 |
| Alpha Counter | 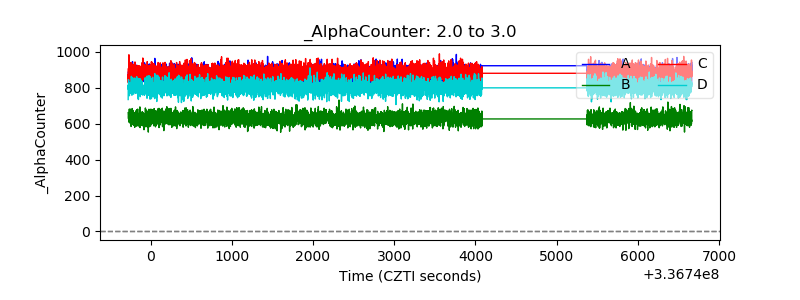 |
| _CPM_Rate | 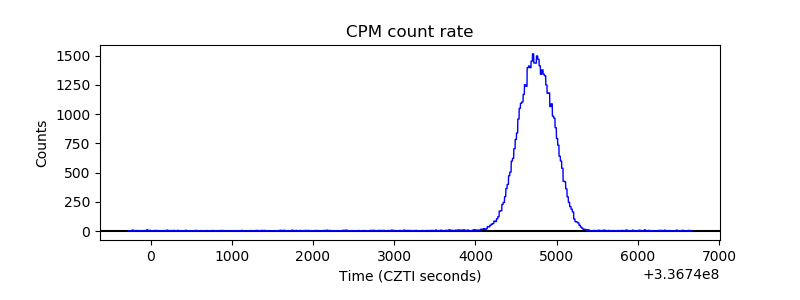 |
| CZT Counter | 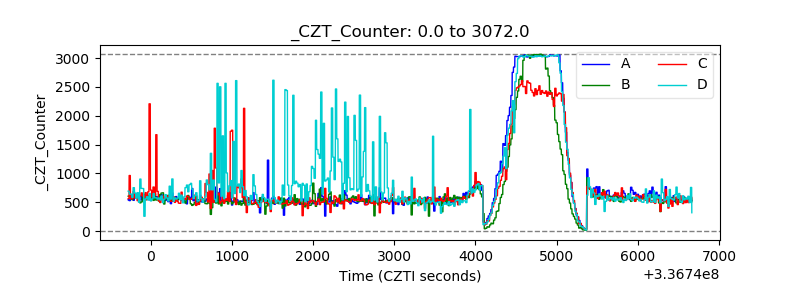 |
| +2.5 Volts monitor | 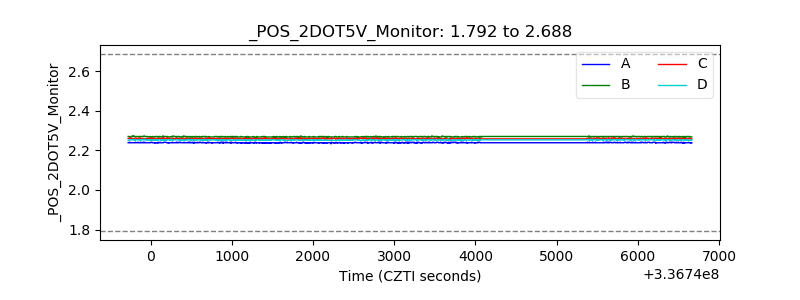 |
| +5 Volts monitor | 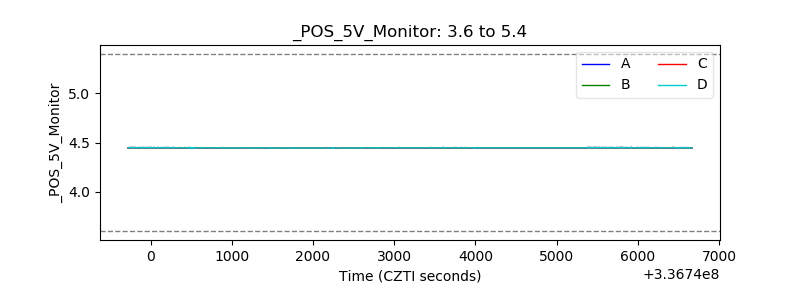 |
| _ROLL_ROT | 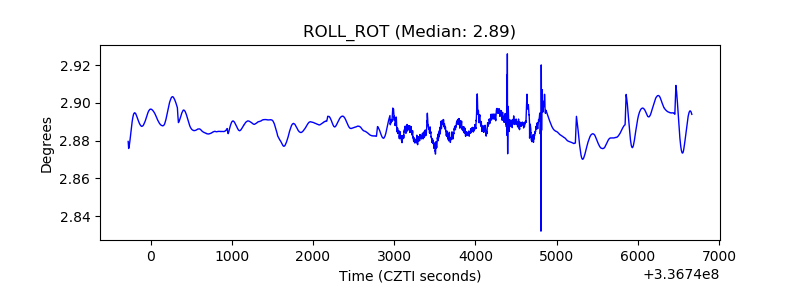 |
| _Roll_DEC |  |
| _Roll_RA | 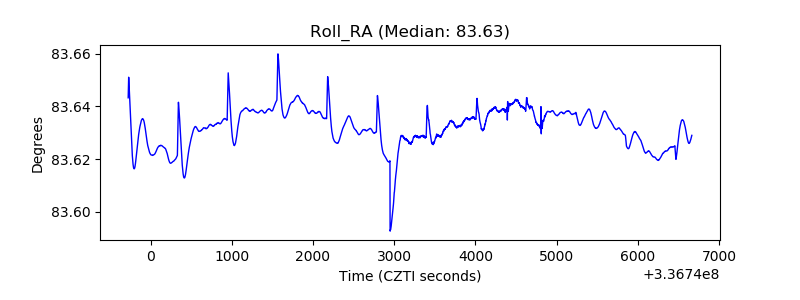 |
| Veto Counter | 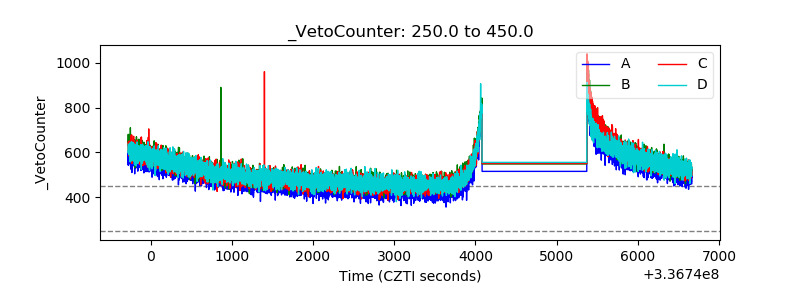 |