| Param | Original file | Final file |
|---|---|---|
| Filename | modeM0/AS1A09_145T01_9000003848_26664cztM0_level2.evt | modeM0/AS1A09_145T01_9000003848_26664cztM0_level2_quad_clean.evt |
| Size (bytes) | 556,721,280 | 85,651,200 |
| Size | 530.9 MB | 81.7 MB |
| Events in quadrant A | 3,692,616 | 553,299 |
| Events in quadrant B | 3,628,394 | 556,049 |
| Events in quadrant C | 3,663,184 | 531,404 |
| Events in quadrant D | 5,422,836 | 486,631 |
| Mode M0 | |||
|---|---|---|---|
| Quadrant | BADHDUFLAG | Total packets | Discarded packets |
| A | 0 | 14902 | 0 |
| B | 0 | 14477 | 0 |
| C | 0 | 14639 | 0 |
| D | 0 | 20347 | 0 |
| Mode M9 | |||
|---|---|---|---|
| Quadrant | BADHDUFLAG | Total packets | Discarded packets |
| A | 0 | 12 | 0 |
| B | 0 | 12 | 0 |
| C | 0 | 12 | 0 |
| D | 0 | 12 | 0 |
| Quadrant | Total seconds | Saturated seconds | Saturation percentage |
|---|---|---|---|
| A | 6690 | 130 | 1.943199% |
| B | 6691 | 146 | 2.182036% |
| C | 6691 | 179 | 2.675235% |
| D | 6691 | 747 | 11.164250% |
Noise dominated data is calculated using 1-second bins in cleaned event files. If a bin has >2000 counts, and if more than 50% of those come from <1% of pixels, then it is considered to be noise-dominated and hence unusable.
| Quadrant | # 1 sec bins | Bins with >0 counts | Bins with >2000 counts | High rate bins dominated by noise | Noise dominated (total time) | Noise dominated (detector-on time) | Marked lightcurve |
|---|---|---|---|---|---|---|---|
| A | 7835 | 6691 | 0 | 0 | 0.00% | 0.00% | 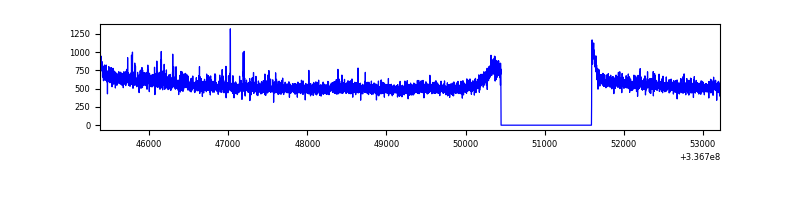 |
| B | 7836 | 6692 | 0 | 0 | 0.00% | 0.00% | 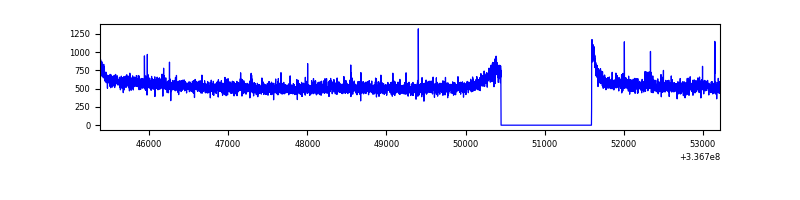 |
| C | 7836 | 6692 | 6 | 6 | 0.08% | 0.09% | 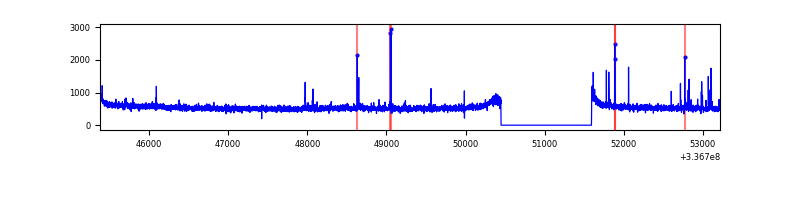 |
| D | 7836 | 6691 | 439 | 439 | 5.60% | 6.56% | 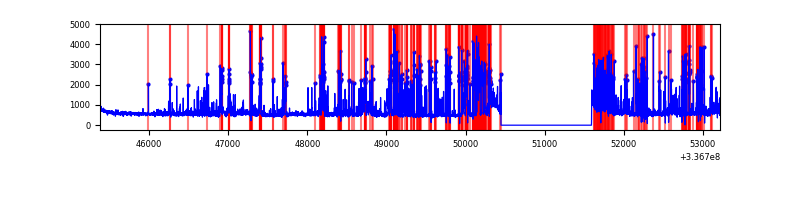 |
Top three noisy pixels from each quadrant. If the there are fewer than three noisy pixels in the level2.evt file, extra rows are filled as -1
| Pixel properties | Quadrant properties | ||||||
|---|---|---|---|---|---|---|---|
| Quadrant | DetID | PixID | Counts | Sigma | Mean | Median | Sigma |
| A | 0 | 13 | 83489 | 439.36 | 936 | 920 | 187.9 |
| A | 13 | 254 | 11989 | 58.9 | 936 | 920 | 187.9 |
| A | 0 | 226 | 8223 | 38.86 | 936 | 920 | 187.9 |
| B | 3 | 112 | 28988 | 162.14 | 914 | 893 | 173.3 |
| B | 12 | 111 | 20304 | 112.02 | 914 | 893 | 173.3 |
| B | 11 | 111 | 18210 | 99.94 | 914 | 893 | 173.3 |
| C | 14 | 238 | 144617 | 705.73 | 881 | 888 | 203.7 |
| C | 2 | 16 | 47149 | 227.15 | 881 | 888 | 203.7 |
| C | 15 | 208 | 32253 | 154.01 | 881 | 888 | 203.7 |
| D | 7 | 80 | 1374518 | 6570.76 | 864 | 841 | 209.1 |
| D | 1 | 52 | 319488 | 1524.2 | 864 | 841 | 209.1 |
| D | 2 | 250 | 236823 | 1128.78 | 864 | 841 | 209.1 |
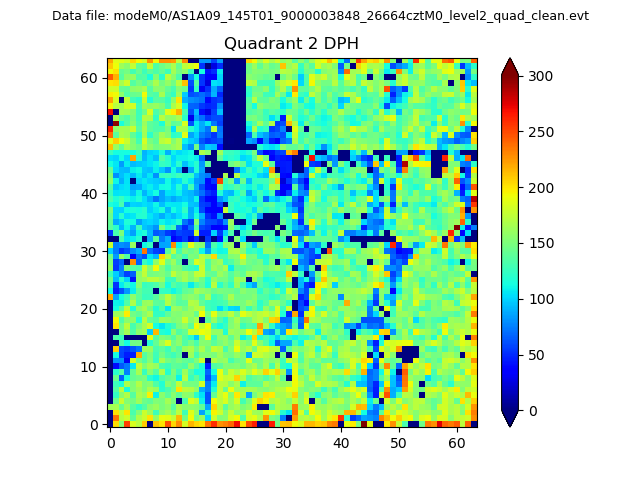
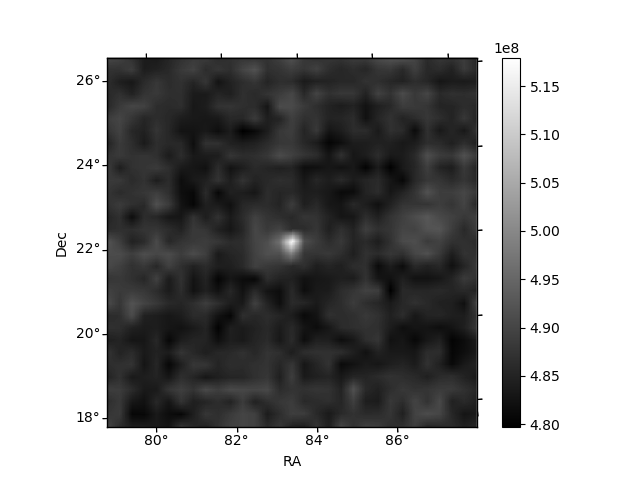
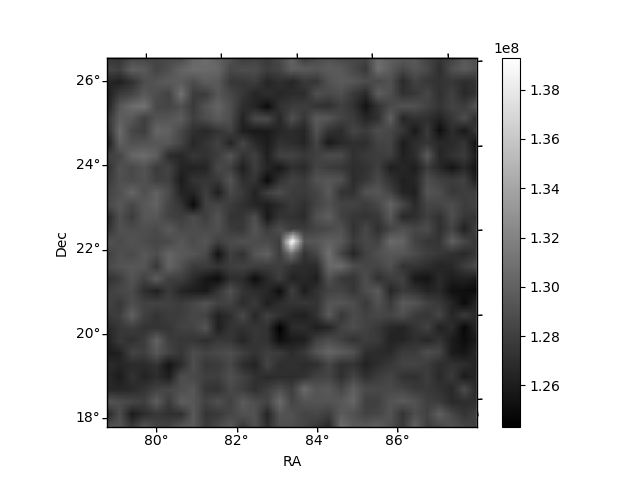
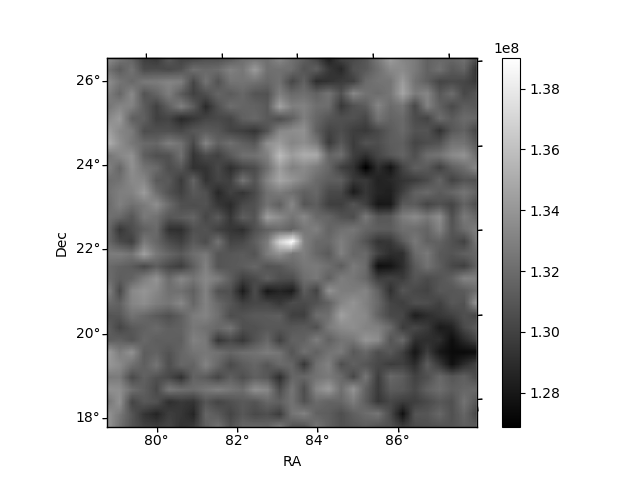
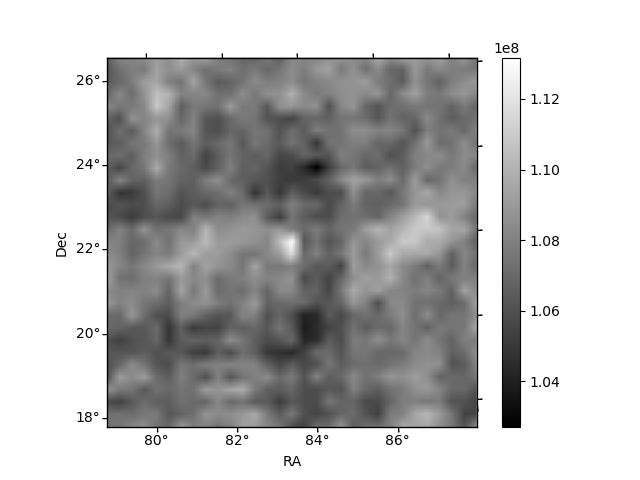
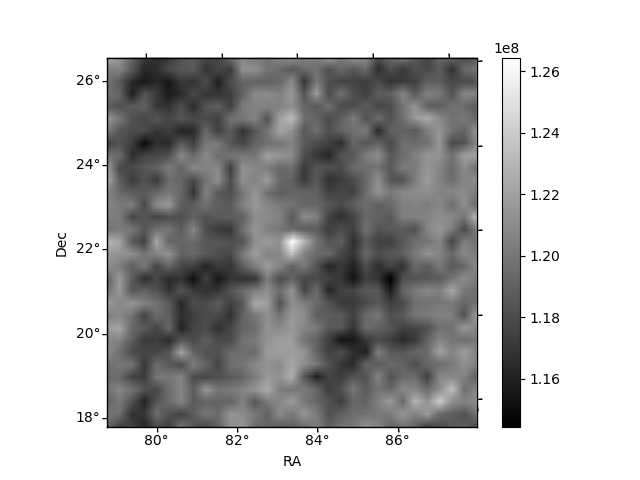
Histogram calculated using DETX and DETY for each event in the final _common_clean file
| Quadrant A | 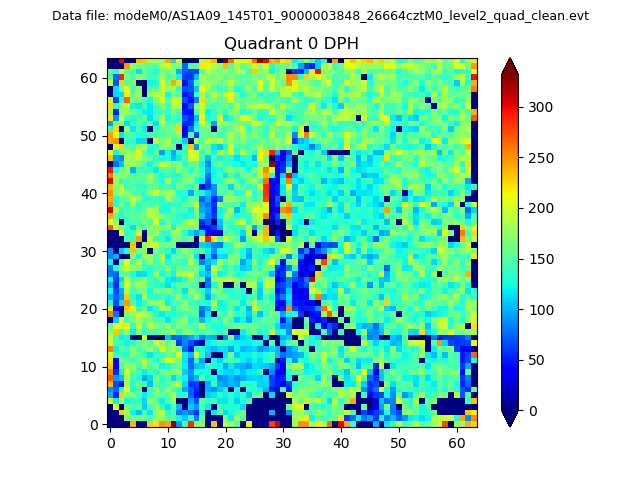 |
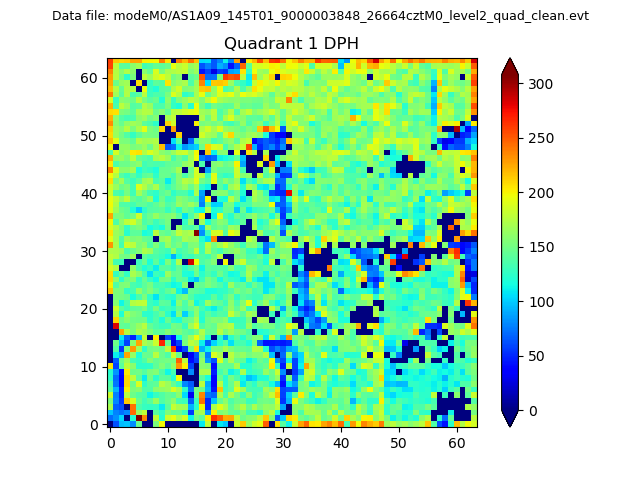 |
Quadrant B |
|---|---|---|---|
| Quadrant D | 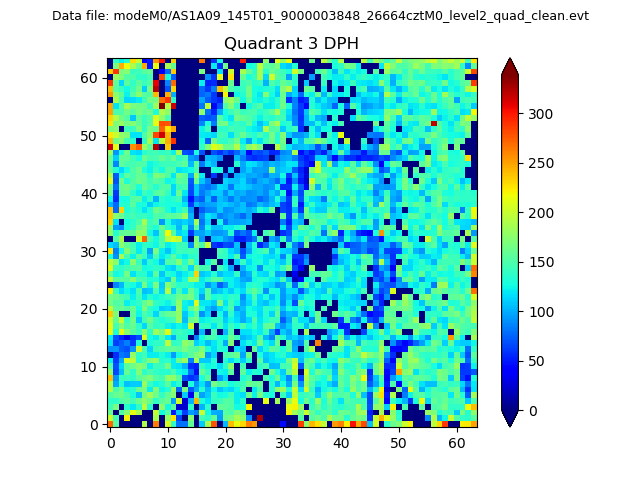 |
 |
Quadrant C |
| Plot type | Count rate plots | Images |
|---|---|---|
| Comparison with Poisson distribution Blue bars denote a histogram of data divided into 1 sec bins. Red curve is a Poisson curve with rate = median count rate of data. |
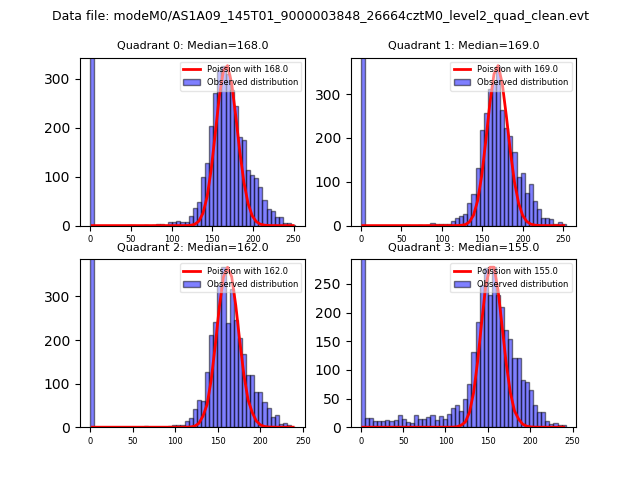 |
 |
| Quadrant-wise count rates Data is divided into 100 sec bins |
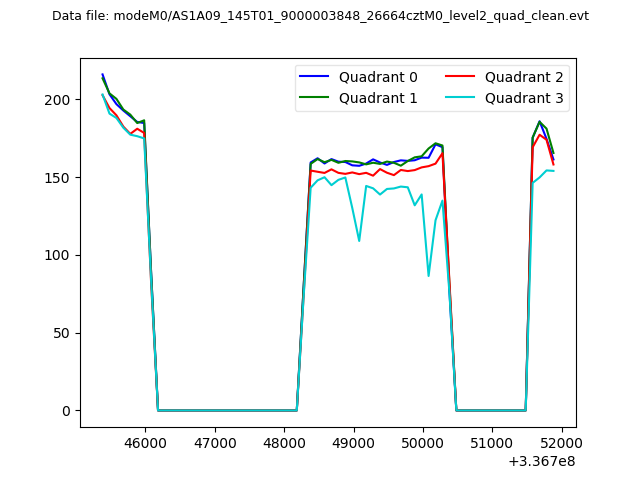 |
|
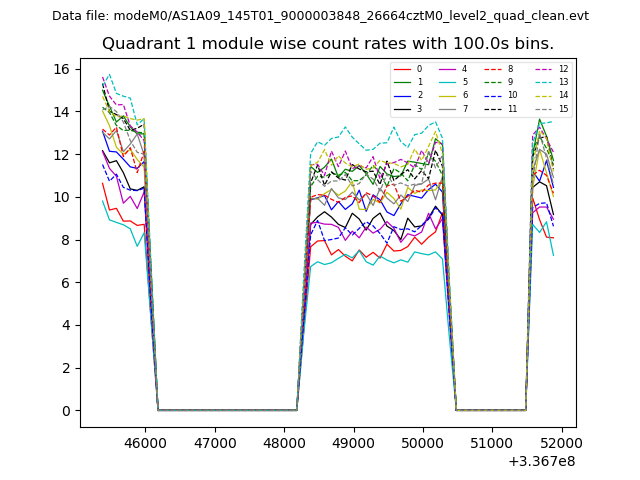
| Module-wise count rates for Quadrant A Data is divided into 100 sec bins |
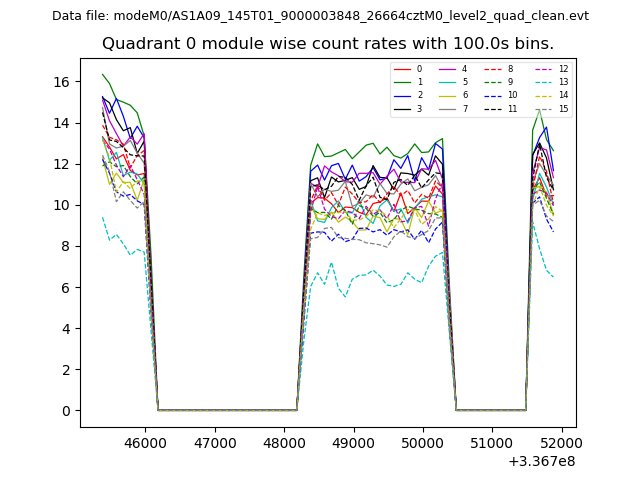 |
 |
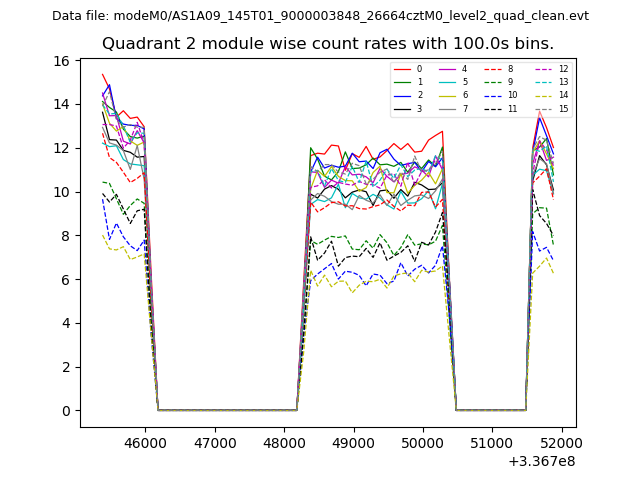
| Module-wise count rates for Quadrant B Data is divided into 100 sec bins |
 |
 |
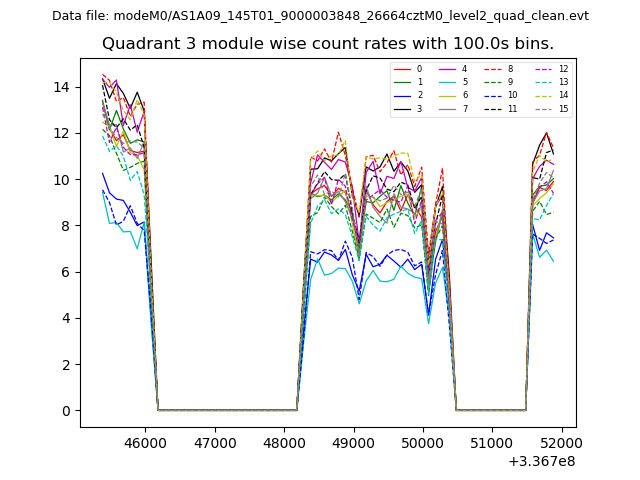
| Module-wise count rates for Quadrant C Data is divided into 100 sec bins |
 |
 |
| Module-wise count rates for Quadrant D Data is divided into 100 sec bins |
 |
 |
| Parameter | Plot |
|---|---|
| CZT HV Monitor | 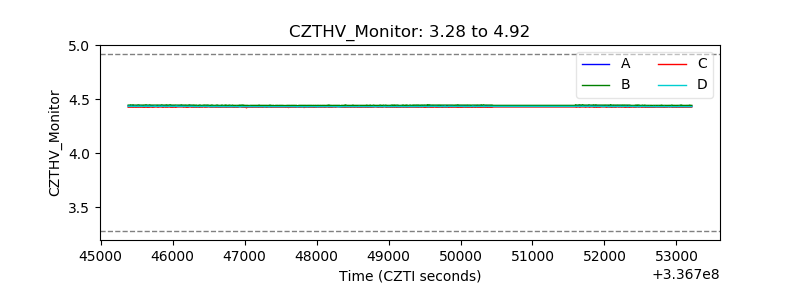 |
| D_VDD | 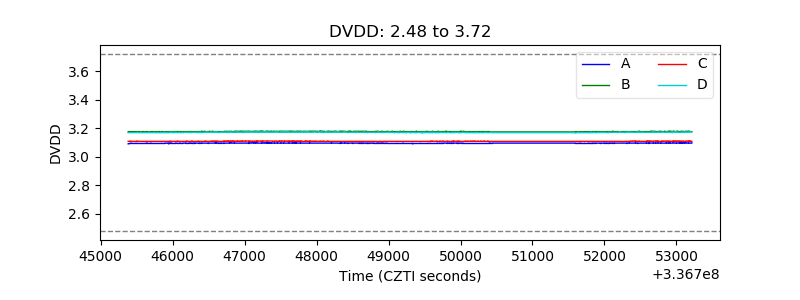 |
| Temperature 1 | 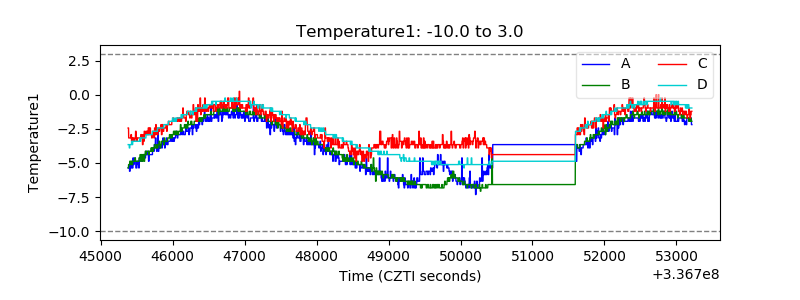 |
| Veto HV Monitor | 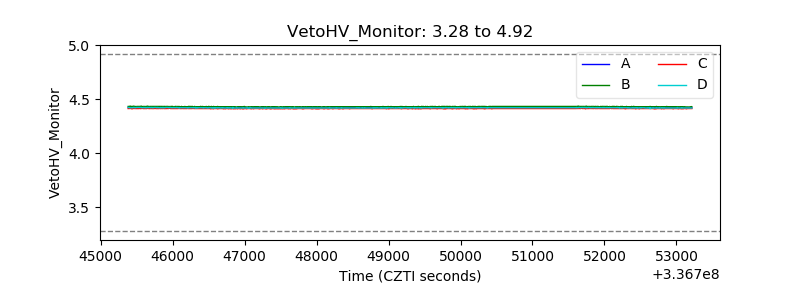 |
| Veto LLD | 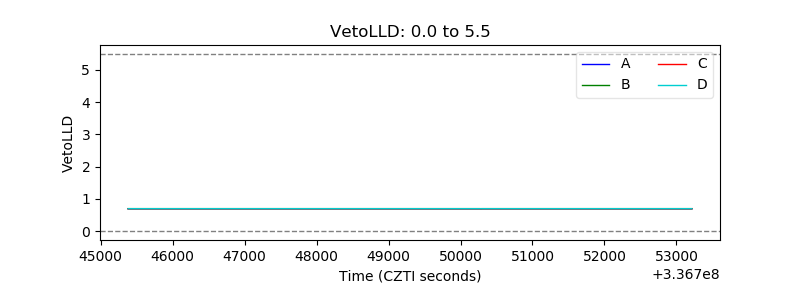 |
| Alpha Counter | 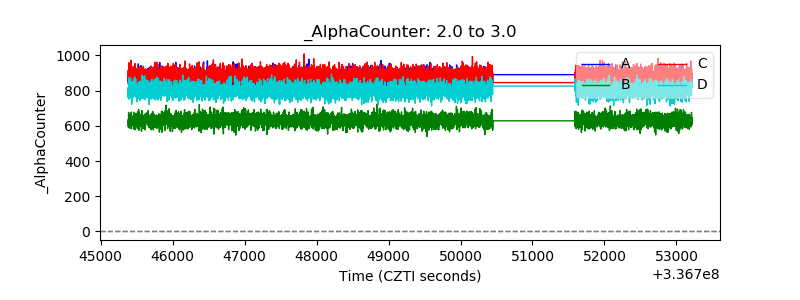 |
| _CPM_Rate | 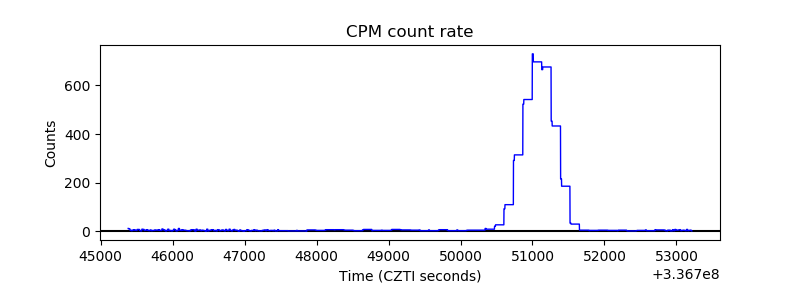 |
| CZT Counter | 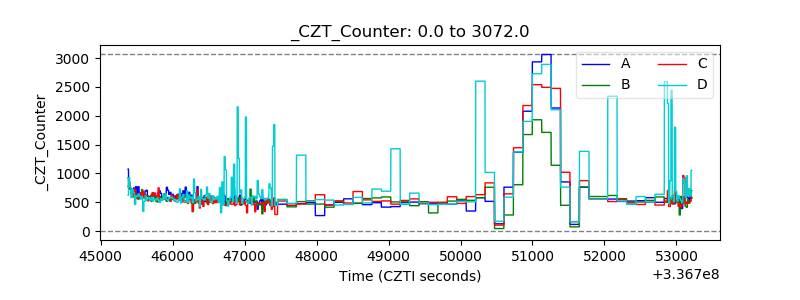 |
| +2.5 Volts monitor | 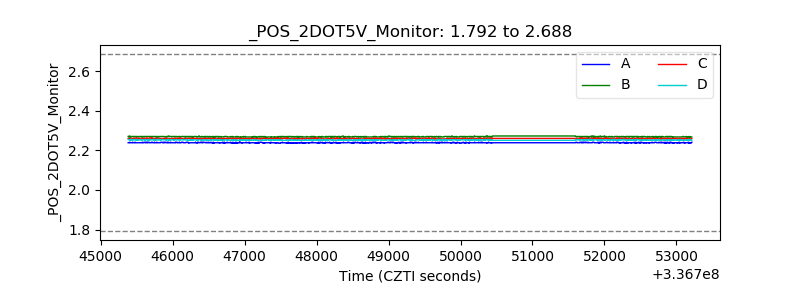 |
| +5 Volts monitor |  |
| _ROLL_ROT | 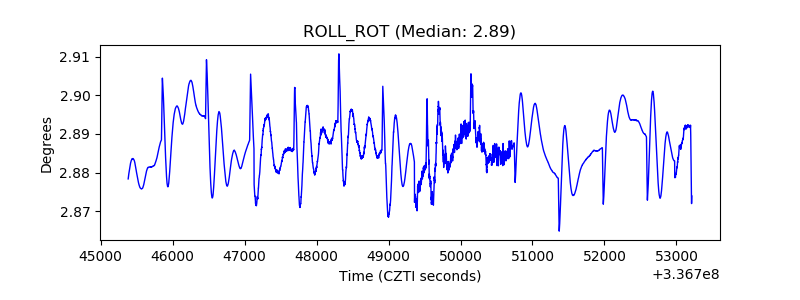 |
| _Roll_DEC | 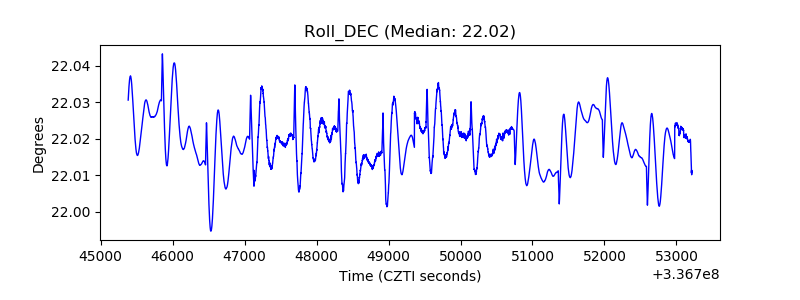 |
| _Roll_RA | 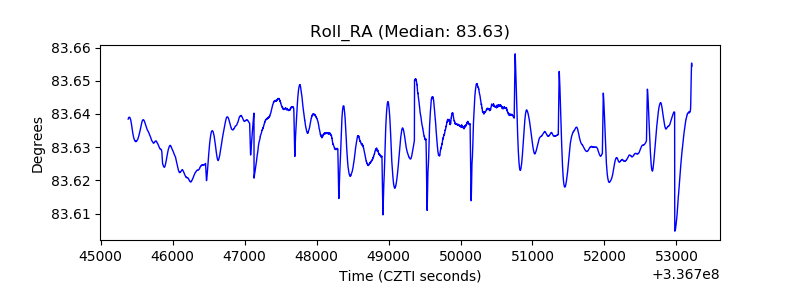 |
| Veto Counter | 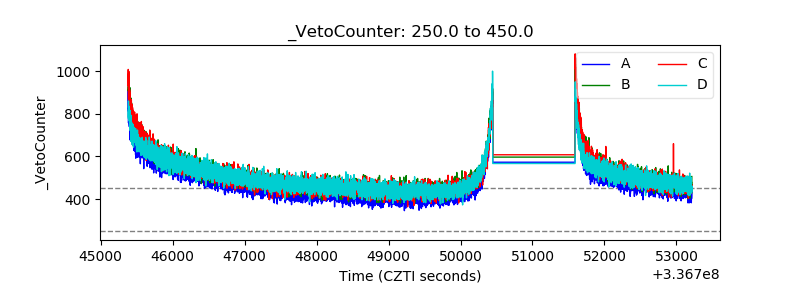 |