| Param | Original file | Final file |
|---|---|---|
| Filename | modeM0/AS1A09_145T01_9000003848_26665cztM0_level2.evt | modeM0/AS1A09_145T01_9000003848_26665cztM0_level2_quad_clean.evt |
| Size (bytes) | 650,373,120 | 72,293,760 |
| Size | 620.2 MB | 68.9 MB |
| Events in quadrant A | 3,660,295 | 454,291 |
| Events in quadrant B | 3,469,419 | 456,363 |
| Events in quadrant C | 3,491,635 | 439,861 |
| Events in quadrant D | 8,625,324 | 374,583 |
| Mode M0 | |||
|---|---|---|---|
| Quadrant | BADHDUFLAG | Total packets | Discarded packets |
| A | 0 | 14650 | 0 |
| B | 0 | 13998 | 0 |
| C | 0 | 14076 | 0 |
| D | 0 | 30146 | 0 |
| Mode M9 | |||
|---|---|---|---|
| Quadrant | BADHDUFLAG | Total packets | Discarded packets |
| A | 0 | 10 | 0 |
| B | 0 | 10 | 0 |
| C | 0 | 10 | 0 |
| D | 0 | 10 | 0 |
| Quadrant | Total seconds | Saturated seconds | Saturation percentage |
|---|---|---|---|
| A | 6649 | 89 | 1.338547% |
| B | 6650 | 86 | 1.293233% |
| C | 6650 | 110 | 1.654135% |
| D | 6650 | 1961 | 29.488722% |
Noise dominated data is calculated using 1-second bins in cleaned event files. If a bin has >2000 counts, and if more than 50% of those come from <1% of pixels, then it is considered to be noise-dominated and hence unusable.
| Quadrant | # 1 sec bins | Bins with >0 counts | Bins with >2000 counts | High rate bins dominated by noise | Noise dominated (total time) | Noise dominated (detector-on time) | Marked lightcurve |
|---|---|---|---|---|---|---|---|
| A | 7609 | 6650 | 0 | 0 | 0.00% | 0.00% | 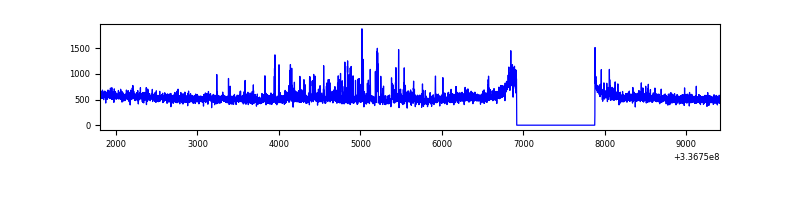 |
| B | 7610 | 6651 | 1 | 1 | 0.01% | 0.02% | 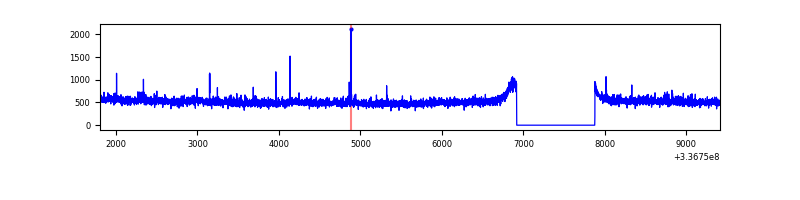 |
| C | 7610 | 6650 | 6 | 6 | 0.08% | 0.09% | 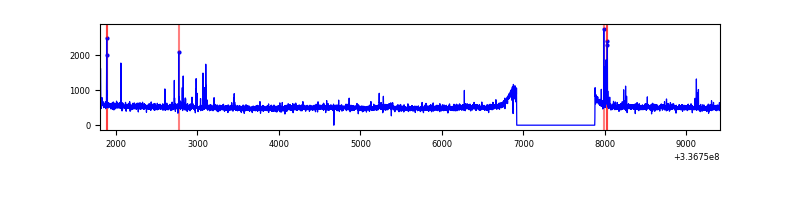 |
| D | 7610 | 6651 | 1307 | 1307 | 17.17% | 19.65% | 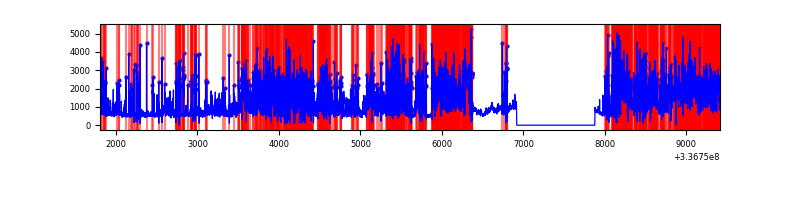 |
Top three noisy pixels from each quadrant. If the there are fewer than three noisy pixels in the level2.evt file, extra rows are filled as -1
| Pixel properties | Quadrant properties | ||||||
|---|---|---|---|---|---|---|---|
| Quadrant | DetID | PixID | Counts | Sigma | Mean | Median | Sigma |
| A | 0 | 13 | 268503 | 1520.11 | 877 | 864 | 176.1 |
| A | 13 | 254 | 11429 | 60.01 | 877 | 864 | 176.1 |
| A | 12 | 189 | 8811 | 45.14 | 877 | 864 | 176.1 |
| B | 3 | 112 | 36781 | 218.32 | 865 | 847 | 164.6 |
| B | 10 | 245 | 23610 | 138.3 | 865 | 847 | 164.6 |
| B | 12 | 111 | 19423 | 112.86 | 865 | 847 | 164.6 |
| C | 14 | 238 | 133974 | 682.13 | 835 | 845 | 195.2 |
| C | 2 | 16 | 72237 | 365.8 | 835 | 845 | 195.2 |
| C | 3 | 233 | 21504 | 105.85 | 835 | 845 | 195.2 |
| D | 7 | 80 | 3995782 | 22032.03 | 740 | 721 | 181.3 |
| D | 1 | 52 | 1124736 | 6198.74 | 740 | 721 | 181.3 |
| D | 2 | 250 | 568253 | 3129.84 | 740 | 721 | 181.3 |
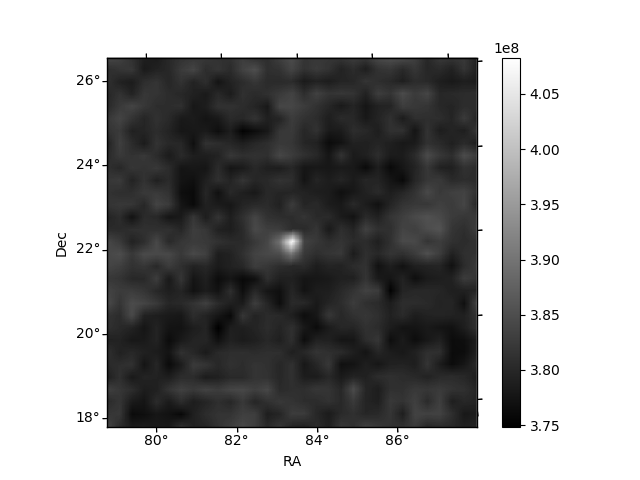
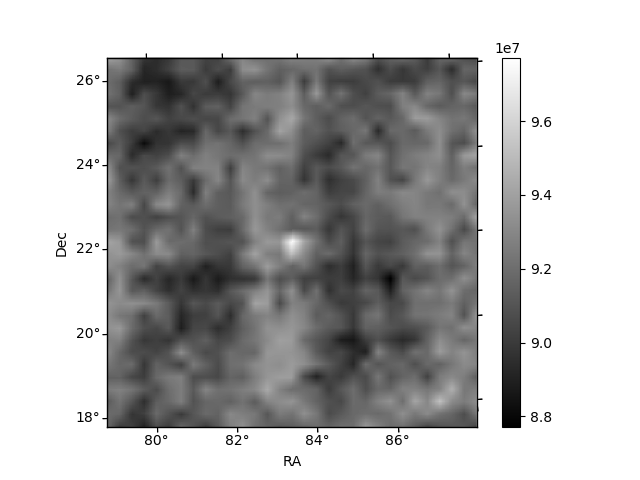
Histogram calculated using DETX and DETY for each event in the final _common_clean file
| Quadrant A | 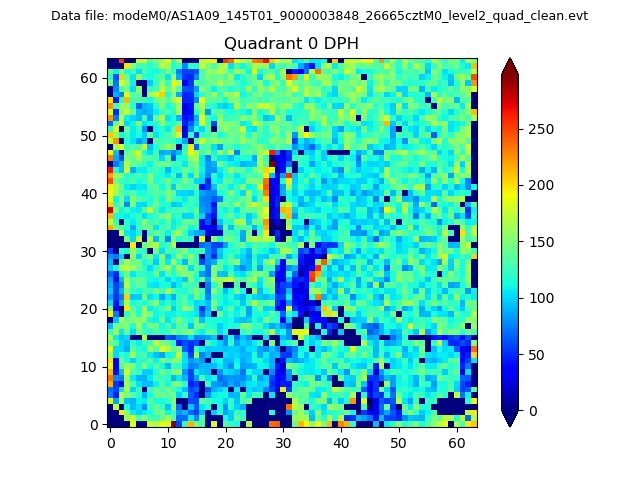 |
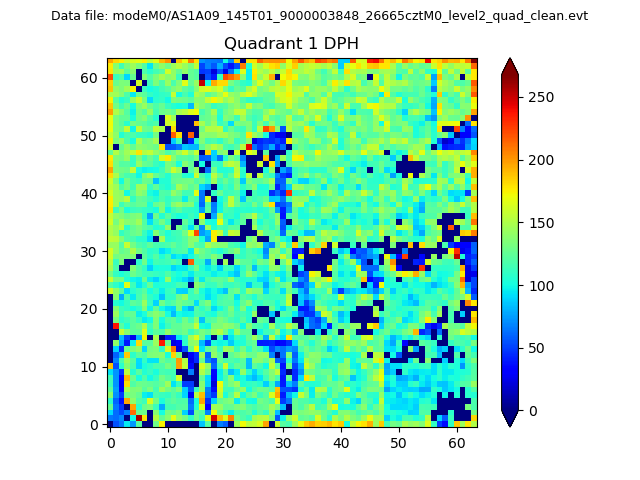 |
Quadrant B |
|---|---|---|---|
| Quadrant D | 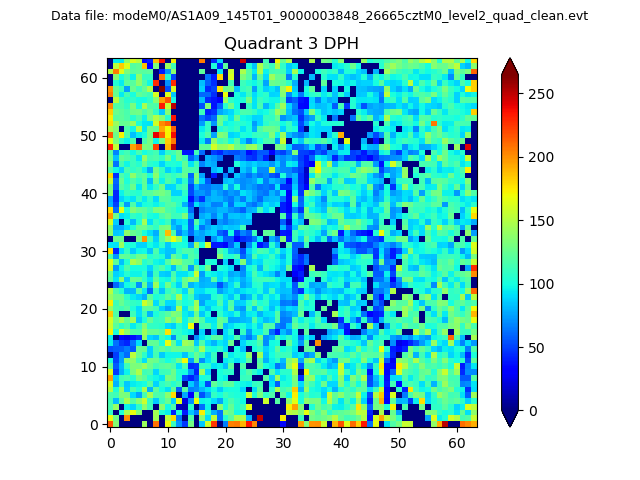 |
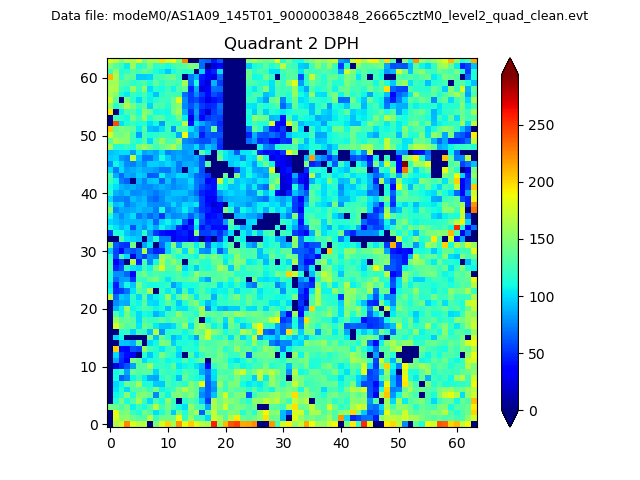 |
Quadrant C |
| Plot type | Count rate plots | Images |
|---|---|---|
| Comparison with Poisson distribution Blue bars denote a histogram of data divided into 1 sec bins. Red curve is a Poisson curve with rate = median count rate of data. |
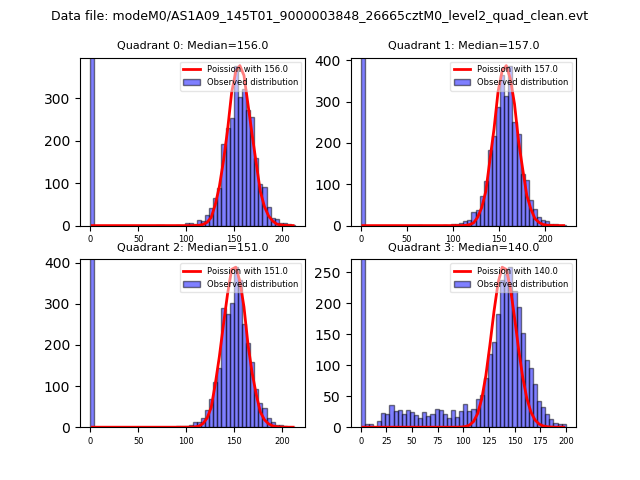 |
 |
| Quadrant-wise count rates Data is divided into 100 sec bins |
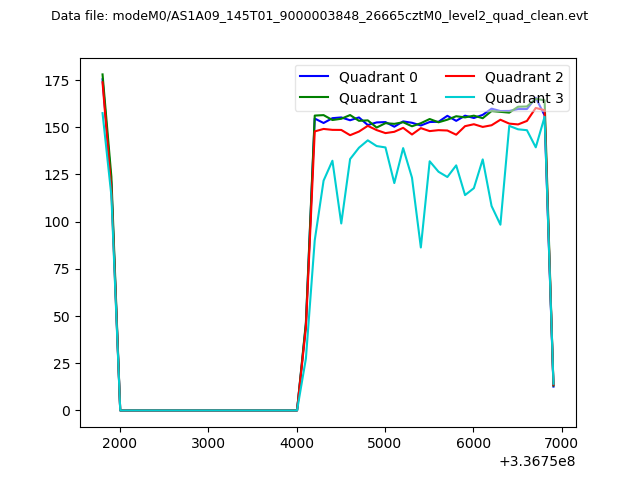 |
|
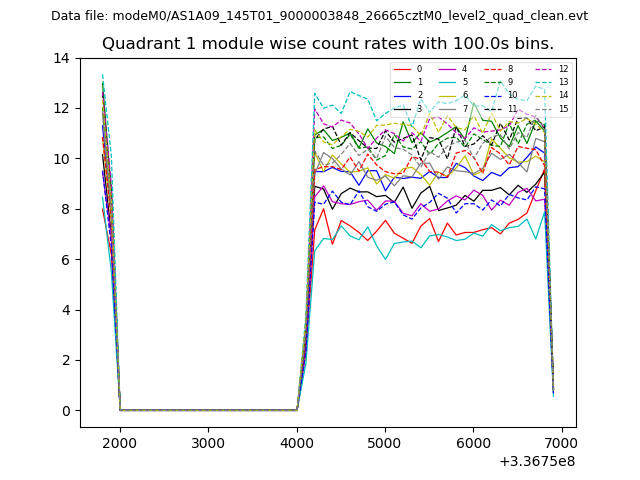
| Module-wise count rates for Quadrant A Data is divided into 100 sec bins |
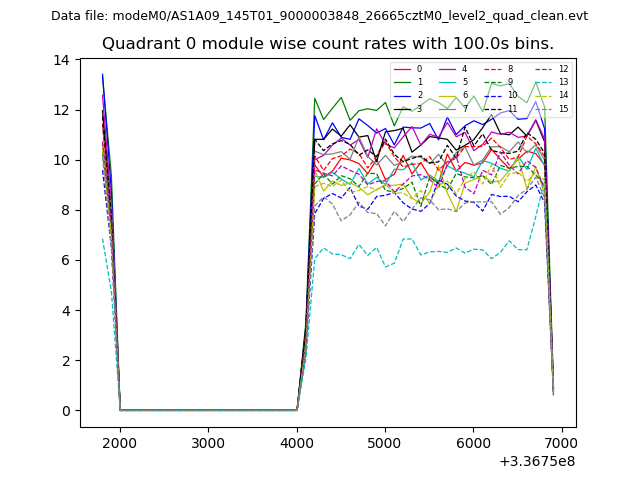 |
 |
| Module-wise count rates for Quadrant B Data is divided into 100 sec bins |
 |
 |
| Module-wise count rates for Quadrant C Data is divided into 100 sec bins |
 |
 |
| Module-wise count rates for Quadrant D Data is divided into 100 sec bins |
 |
 |
| Parameter | Plot |
|---|---|
| CZT HV Monitor | 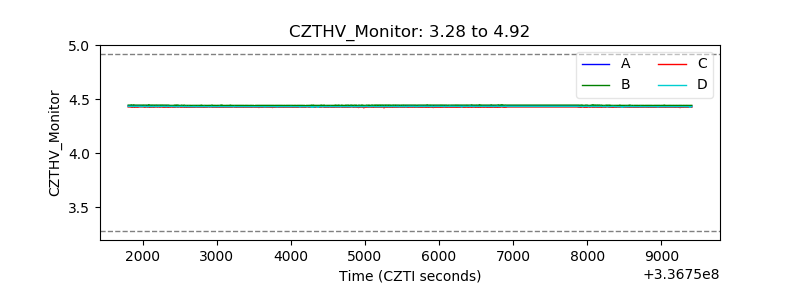 |
| D_VDD | 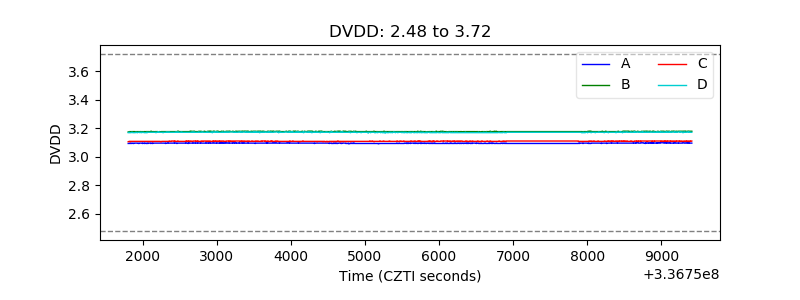 |
| Temperature 1 | 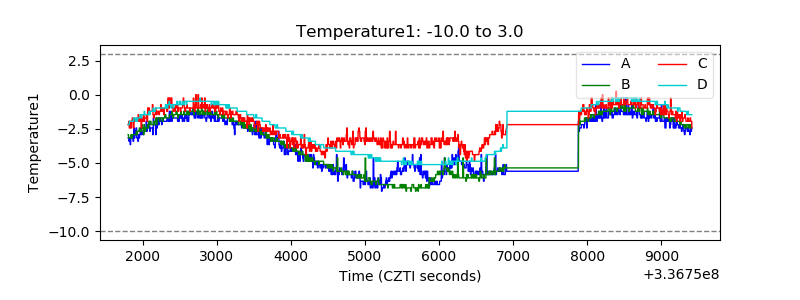 |
| Veto HV Monitor | 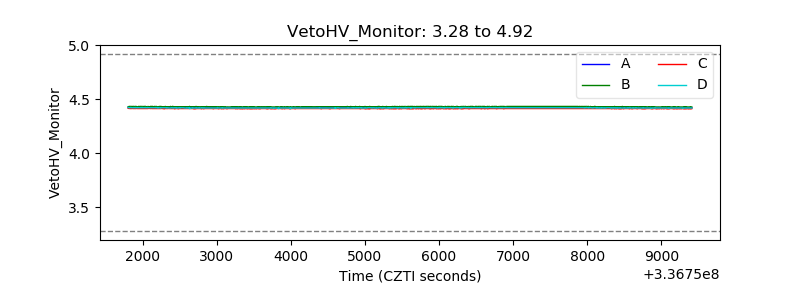 |
| Veto LLD | 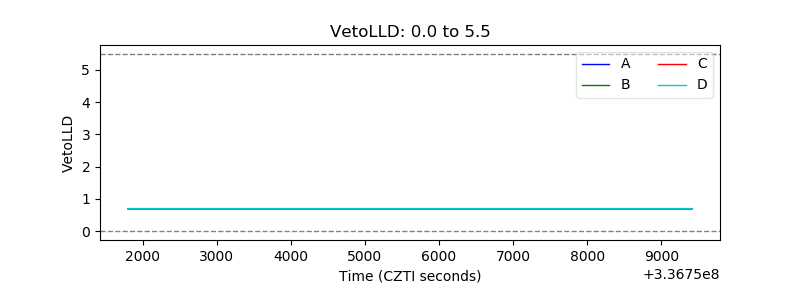 |
| Alpha Counter | 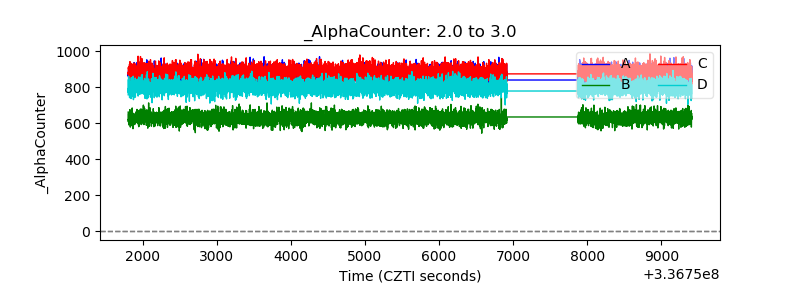 |
| _CPM_Rate | 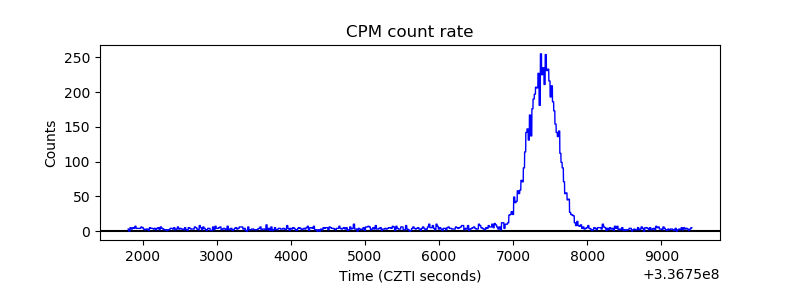 |
| CZT Counter | 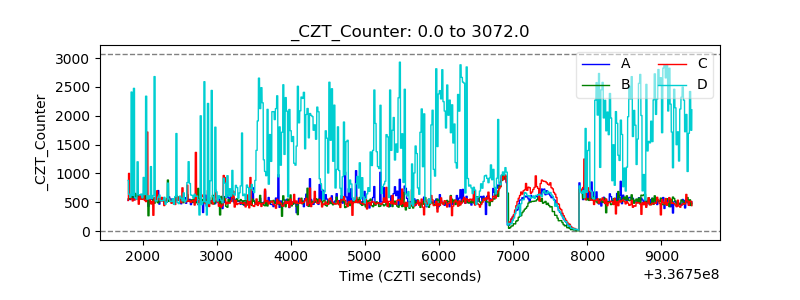 |
| +2.5 Volts monitor |  |
| +5 Volts monitor | 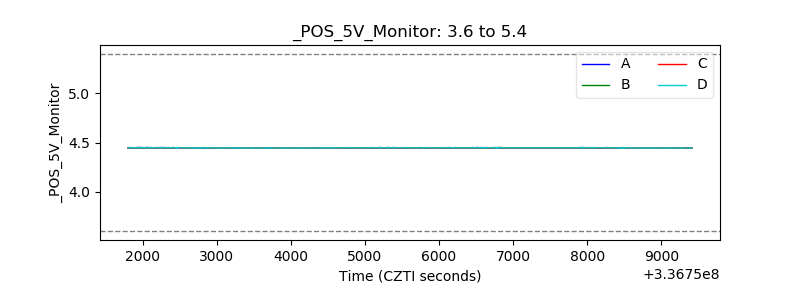 |
| _ROLL_ROT |  |
| _Roll_DEC | 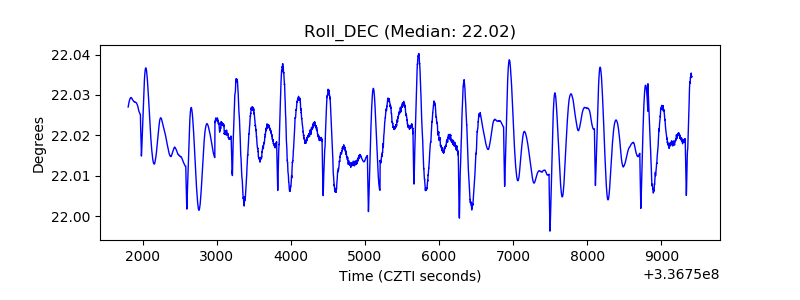 |
| _Roll_RA | 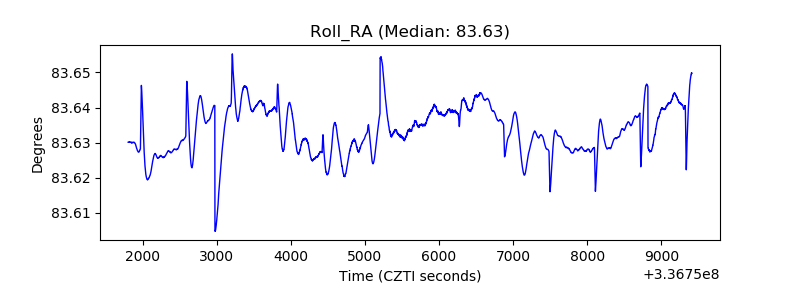 |
| Veto Counter | 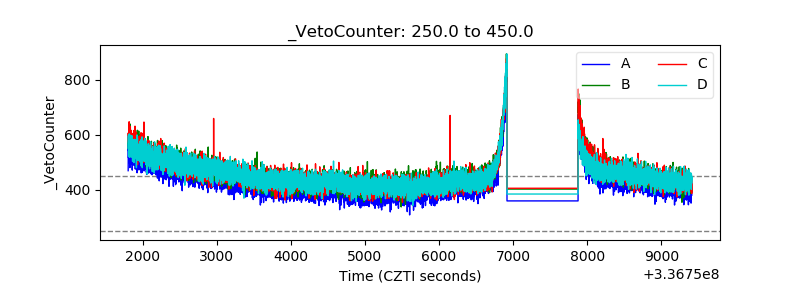 |