| Param | Original file | Final file |
|---|---|---|
| Filename | modeM0/AS1A09_145T01_9000003848_26666cztM0_level2.evt | modeM0/AS1A09_145T01_9000003848_26666cztM0_level2_quad_clean.evt |
| Size (bytes) | 603,146,880 | 82,831,680 |
| Size | 575.2 MB | 79.0 MB |
| Events in quadrant A | 3,600,152 | 520,041 |
| Events in quadrant B | 3,508,262 | 523,266 |
| Events in quadrant C | 3,536,123 | 501,651 |
| Events in quadrant D | 7,154,800 | 483,160 |
| Mode M0 | |||
|---|---|---|---|
| Quadrant | BADHDUFLAG | Total packets | Discarded packets |
| A | 0 | 14729 | 0 |
| B | 0 | 14403 | 0 |
| C | 0 | 14514 | 0 |
| D | 0 | 25877 | 0 |
| Mode M9 | |||
|---|---|---|---|
| Quadrant | BADHDUFLAG | Total packets | Discarded packets |
| A | 0 | 6 | 0 |
| B | 0 | 6 | 0 |
| C | 0 | 6 | 0 |
| D | 0 | 6 | 0 |
| Quadrant | Total seconds | Saturated seconds | Saturation percentage |
|---|---|---|---|
| A | 6889 | 75 | 1.088692% |
| B | 6889 | 78 | 1.132240% |
| C | 6889 | 124 | 1.799971% |
| D | 6889 | 1361 | 19.756133% |
Noise dominated data is calculated using 1-second bins in cleaned event files. If a bin has >2000 counts, and if more than 50% of those come from <1% of pixels, then it is considered to be noise-dominated and hence unusable.
| Quadrant | # 1 sec bins | Bins with >0 counts | Bins with >2000 counts | High rate bins dominated by noise | Noise dominated (total time) | Noise dominated (detector-on time) | Marked lightcurve |
|---|---|---|---|---|---|---|---|
| A | 7479 | 6890 | 5 | 5 | 0.07% | 0.07% | 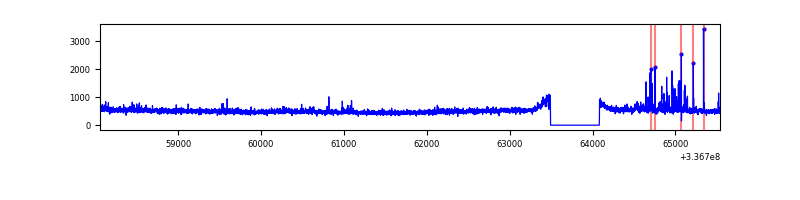 |
| B | 7479 | 6890 | 0 | 0 | 0.00% | 0.00% | 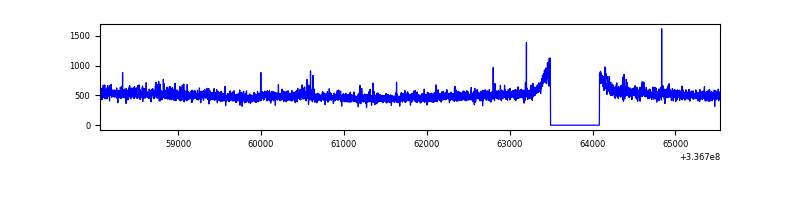 |
| C | 7479 | 6890 | 5 | 5 | 0.07% | 0.07% | 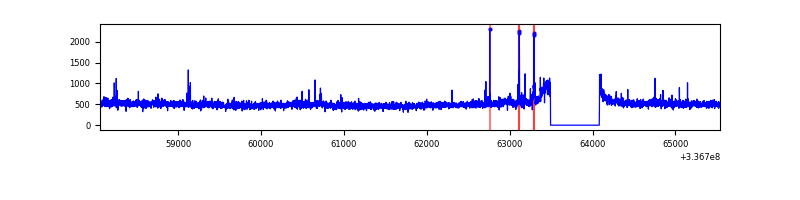 |
| D | 7479 | 6890 | 990 | 990 | 13.24% | 14.37% | 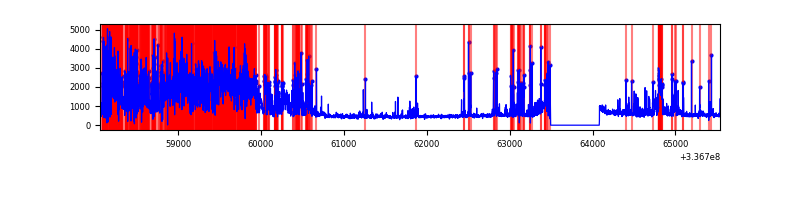 |
Top three noisy pixels from each quadrant. If the there are fewer than three noisy pixels in the level2.evt file, extra rows are filled as -1
| Pixel properties | Quadrant properties | ||||||
|---|---|---|---|---|---|---|---|
| Quadrant | DetID | PixID | Counts | Sigma | Mean | Median | Sigma |
| A | 0 | 13 | 162690 | 897.75 | 888 | 873 | 180.2 |
| A | 13 | 254 | 11627 | 59.66 | 888 | 873 | 180.2 |
| A | 3 | 137 | 7975 | 39.4 | 888 | 873 | 180.2 |
| B | 0 | 219 | 25175 | 145.47 | 879 | 862 | 167.1 |
| B | 3 | 112 | 20749 | 118.99 | 879 | 862 | 167.1 |
| B | 12 | 111 | 19971 | 114.34 | 879 | 862 | 167.1 |
| C | 14 | 238 | 135086 | 671.38 | 846 | 853 | 199.9 |
| C | 2 | 16 | 60307 | 297.36 | 846 | 853 | 199.9 |
| C | 15 | 208 | 23724 | 114.39 | 846 | 853 | 199.9 |
| D | 1 | 52 | 2056951 | 10722.85 | 787 | 766 | 191.8 |
| D | 7 | 80 | 1380489 | 7195.15 | 787 | 766 | 191.8 |
| D | 2 | 250 | 599463 | 3122.16 | 787 | 766 | 191.8 |
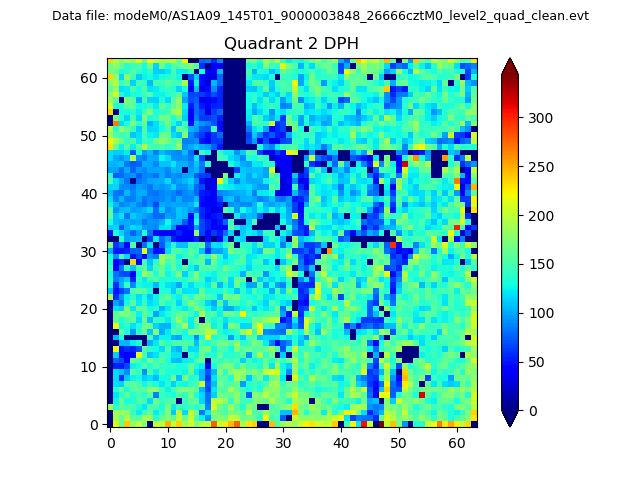
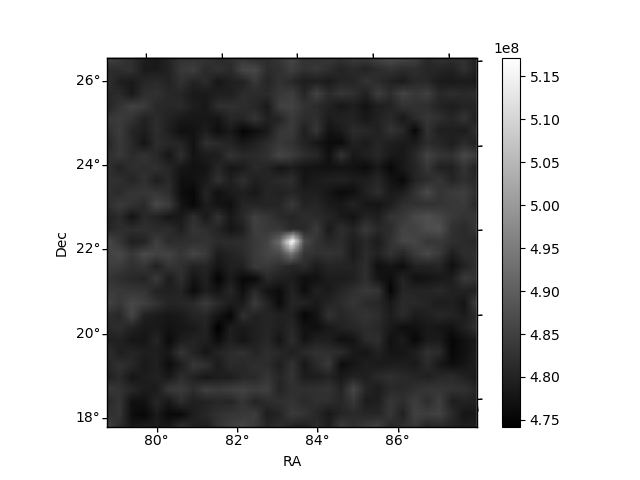
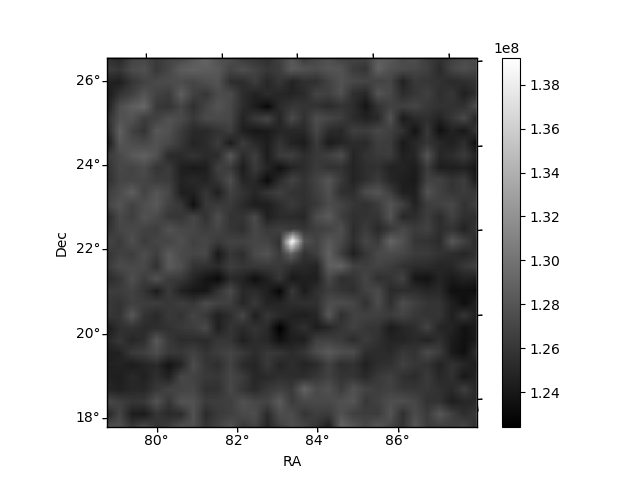
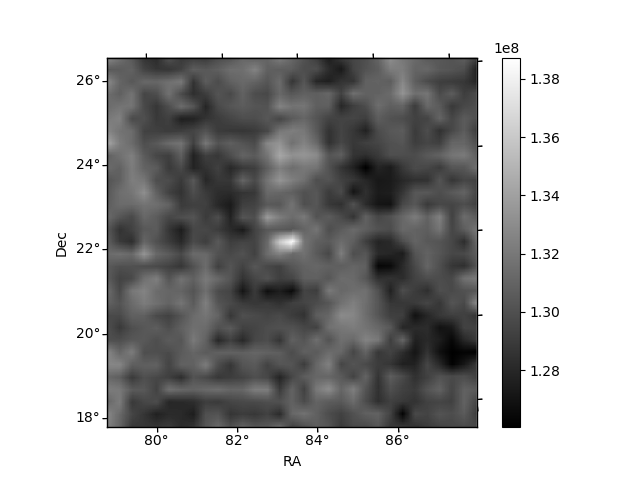
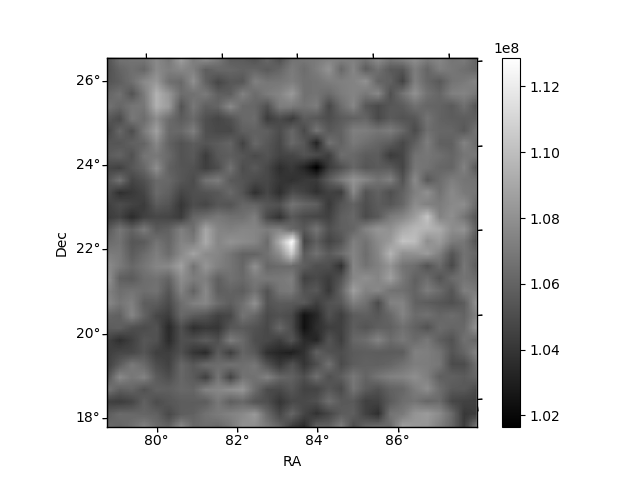
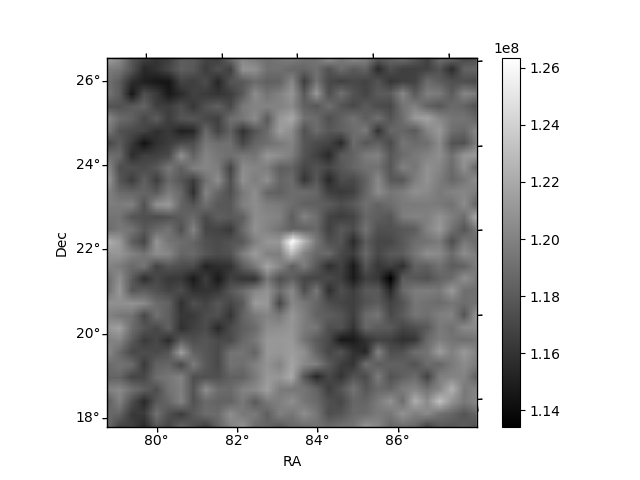
Histogram calculated using DETX and DETY for each event in the final _common_clean file
| Quadrant A | 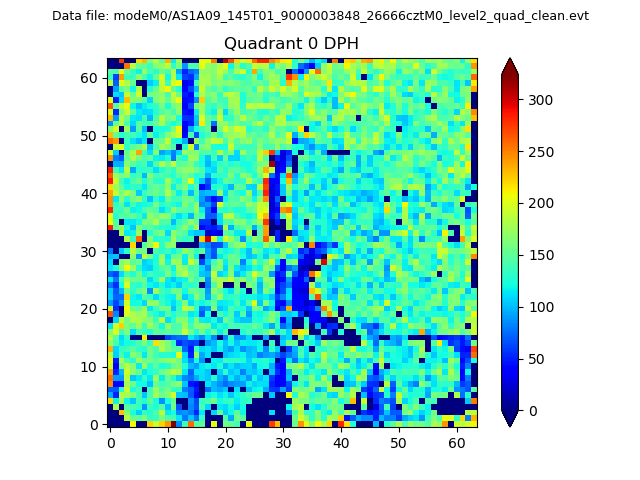 |
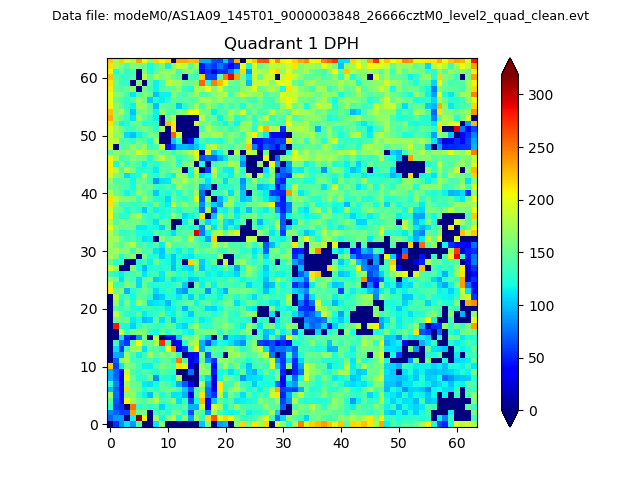 |
Quadrant B |
|---|---|---|---|
| Quadrant D | 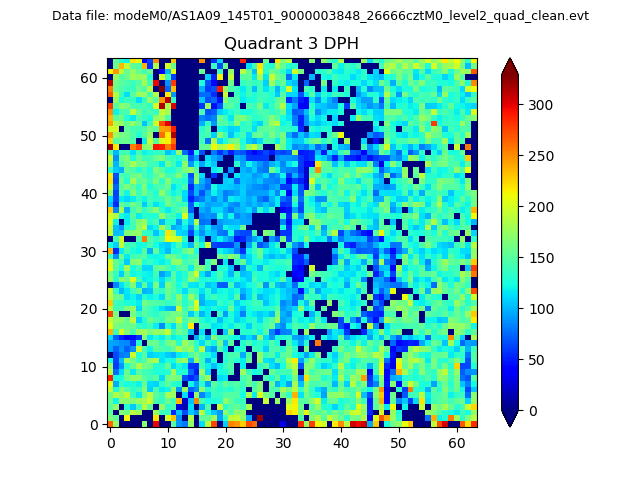 |
 |
Quadrant C |
| Plot type | Count rate plots | Images |
|---|---|---|
| Comparison with Poisson distribution Blue bars denote a histogram of data divided into 1 sec bins. Red curve is a Poisson curve with rate = median count rate of data. |
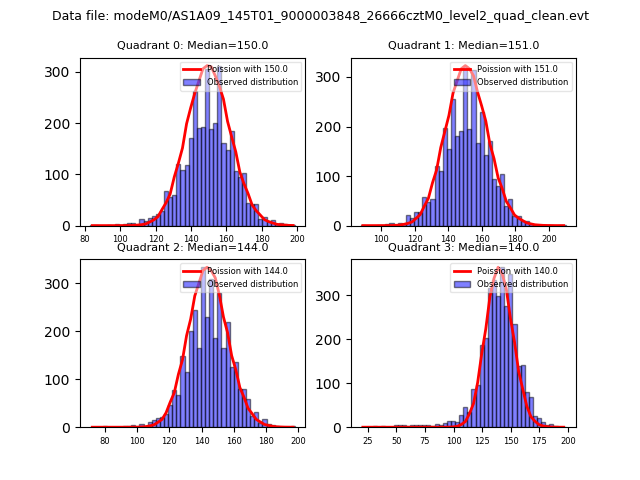 |
 |
| Quadrant-wise count rates Data is divided into 100 sec bins |
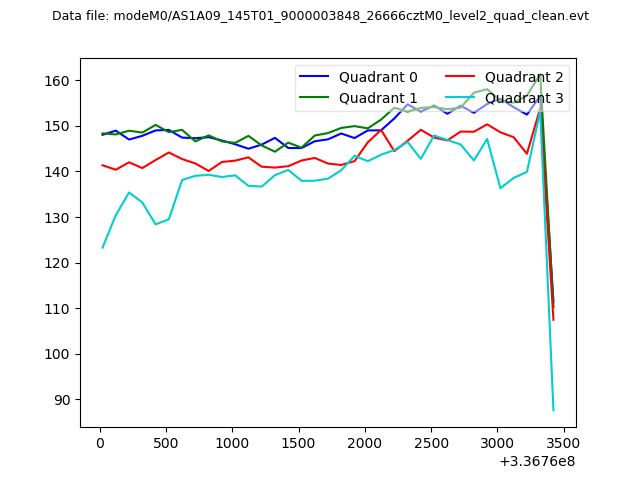 |
|
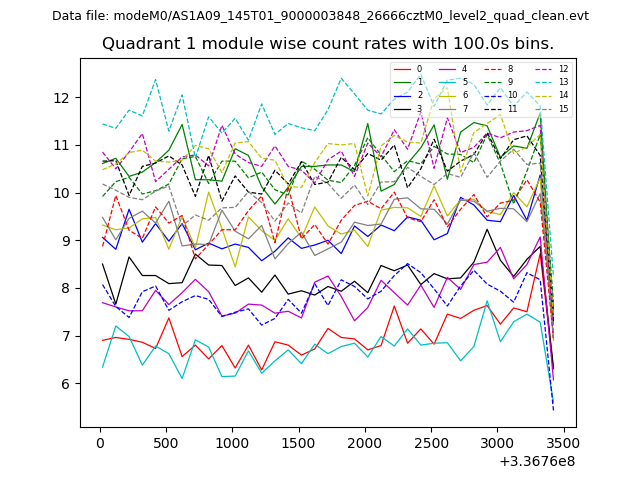
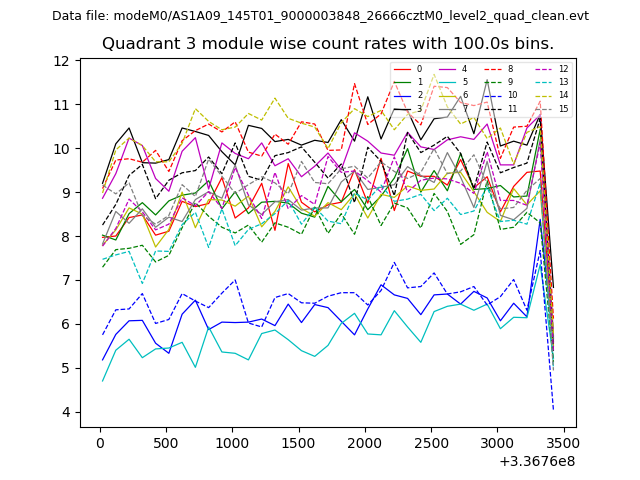
| Module-wise count rates for Quadrant A Data is divided into 100 sec bins |
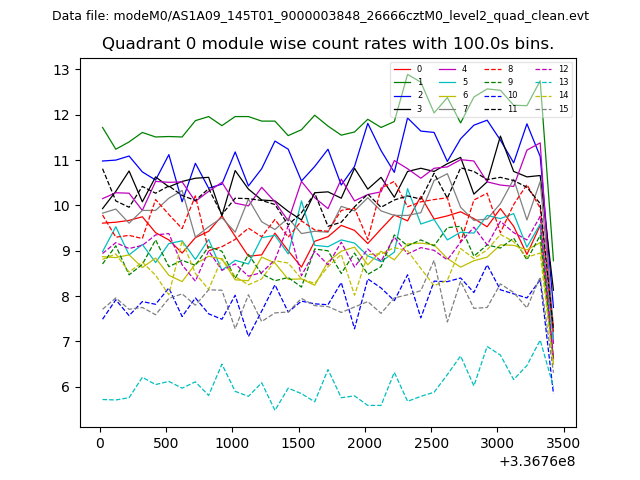 |
 |
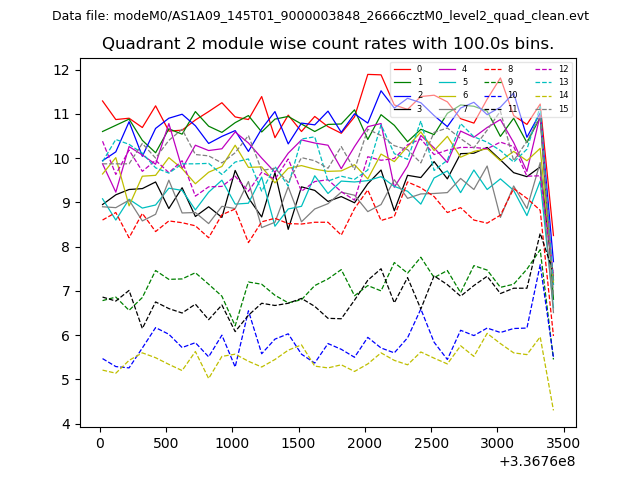
| Module-wise count rates for Quadrant B Data is divided into 100 sec bins |
 |
 |
| Module-wise count rates for Quadrant C Data is divided into 100 sec bins |
 |
 |
| Module-wise count rates for Quadrant D Data is divided into 100 sec bins |
 |
 |
| Parameter | Plot |
|---|---|
| CZT HV Monitor | 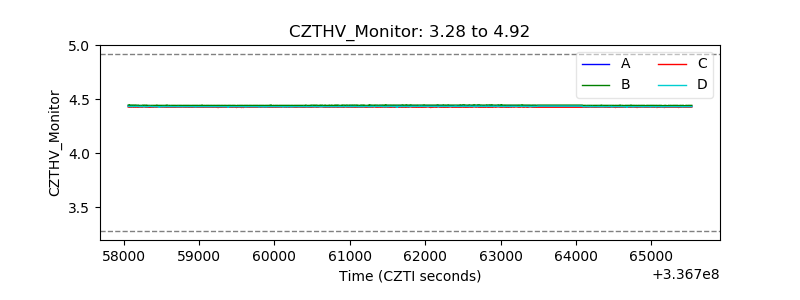 |
| D_VDD | 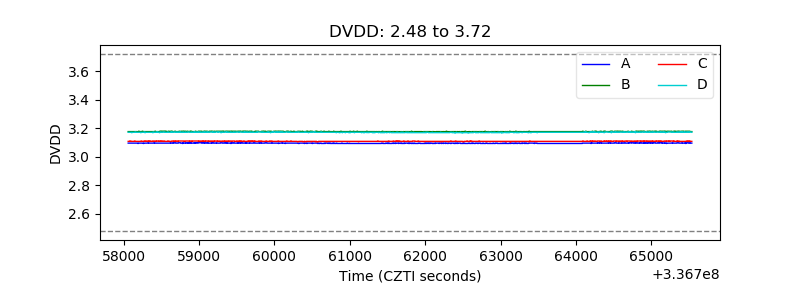 |
| Temperature 1 | 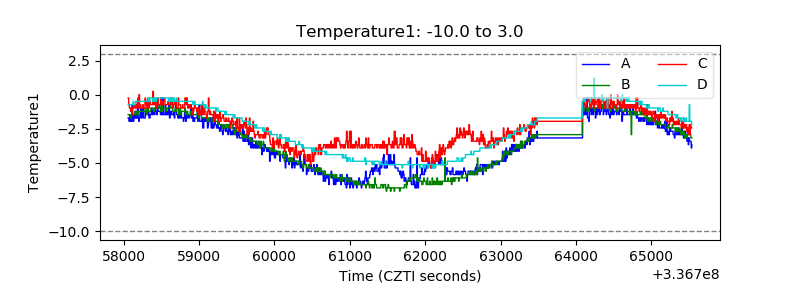 |
| Veto HV Monitor | 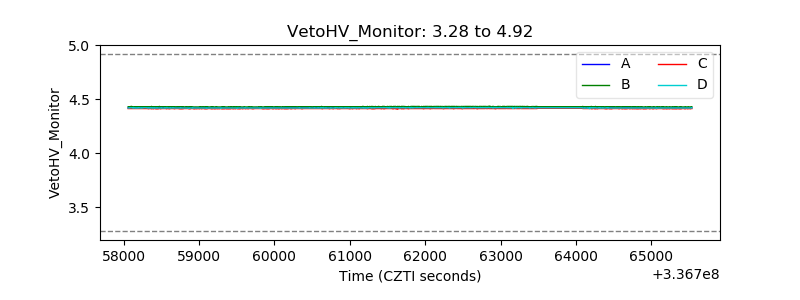 |
| Veto LLD | 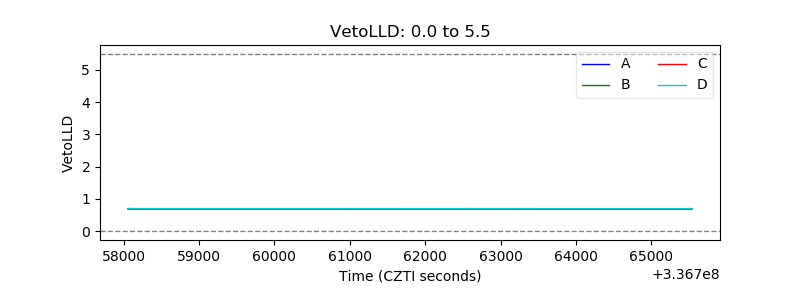 |
| Alpha Counter | 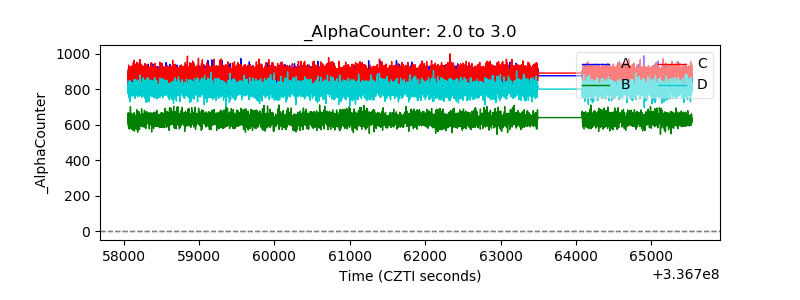 |
| _CPM_Rate | 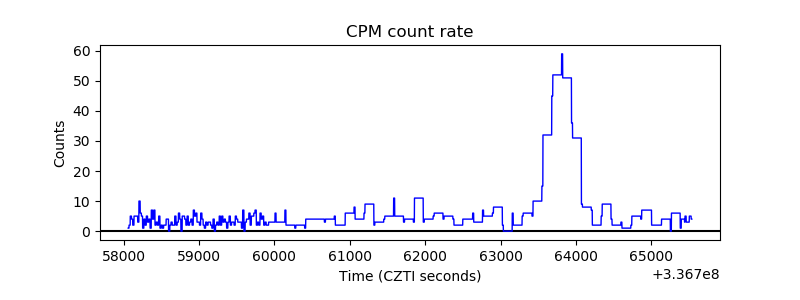 |
| CZT Counter | 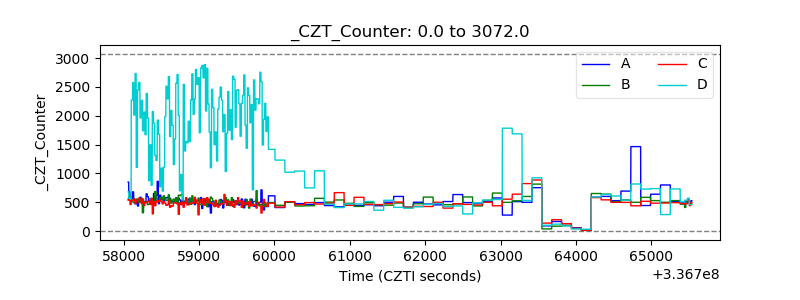 |
| +2.5 Volts monitor |  |
| +5 Volts monitor |  |
| _ROLL_ROT | 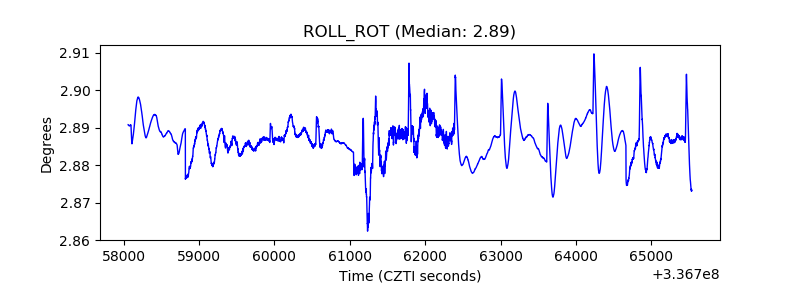 |
| _Roll_DEC | 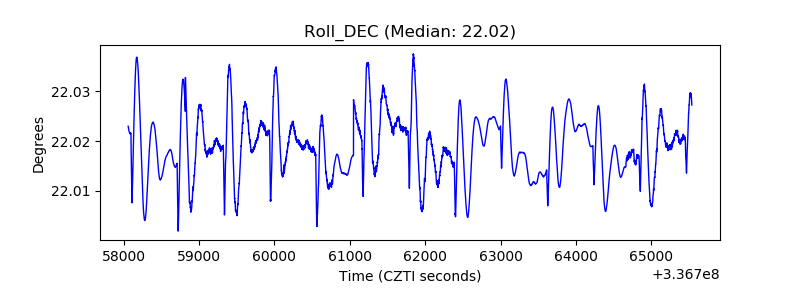 |
| _Roll_RA | 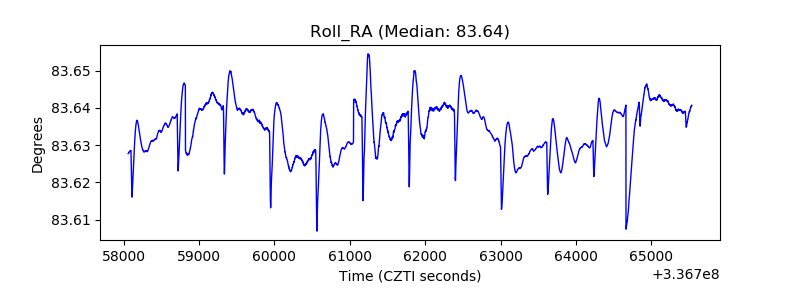 |
| Veto Counter | 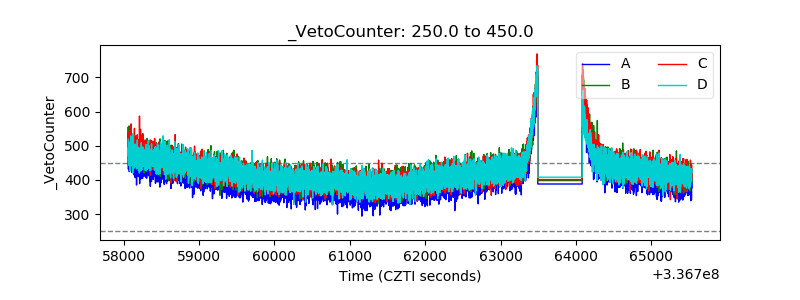 |