| Param | Original file | Final file |
|---|---|---|
| Filename | modeM0/AS1A09_145T01_9000003848_26667cztM0_level2.evt | modeM0/AS1A09_145T01_9000003848_26667cztM0_level2_quad_clean.evt |
| Size (bytes) | 562,227,840 | 87,912,000 |
| Size | 536.2 MB | 83.8 MB |
| Events in quadrant A | 3,977,485 | 550,996 |
| Events in quadrant B | 3,944,065 | 554,631 |
| Events in quadrant C | 3,960,890 | 531,009 |
| Events in quadrant D | 4,641,787 | 509,607 |
| Mode M0 | |||
|---|---|---|---|
| Quadrant | BADHDUFLAG | Total packets | Discarded packets |
| A | 0 | 16389 | 0 |
| B | 0 | 16214 | 0 |
| C | 0 | 16175 | 0 |
| D | 0 | 18611 | 0 |
| Mode M9 | |||
|---|---|---|---|
| Quadrant | BADHDUFLAG | Total packets | Discarded packets |
| A | 0 | 4 | 0 |
| B | 0 | 5 | 0 |
| C | 0 | 5 | 0 |
| D | 0 | 5 | 0 |
| Quadrant | Total seconds | Saturated seconds | Saturation percentage |
|---|---|---|---|
| A | 7413 | 106 | 1.429920% |
| B | 7413 | 153 | 2.063942% |
| C | 7413 | 180 | 2.428167% |
| D | 7412 | 296 | 3.993524% |
Noise dominated data is calculated using 1-second bins in cleaned event files. If a bin has >2000 counts, and if more than 50% of those come from <1% of pixels, then it is considered to be noise-dominated and hence unusable.
| Quadrant | # 1 sec bins | Bins with >0 counts | Bins with >2000 counts | High rate bins dominated by noise | Noise dominated (total time) | Noise dominated (detector-on time) | Marked lightcurve |
|---|---|---|---|---|---|---|---|
| A | 7758 | 7414 | 18 | 18 | 0.23% | 0.24% | 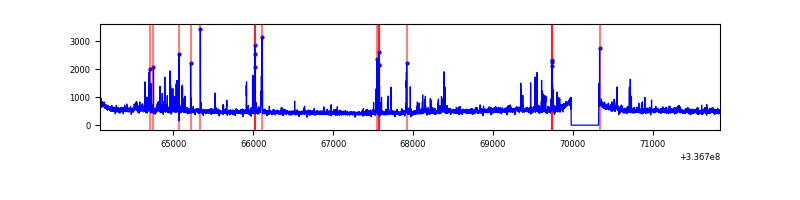 |
| B | 7758 | 7414 | 26 | 26 | 0.34% | 0.35% | 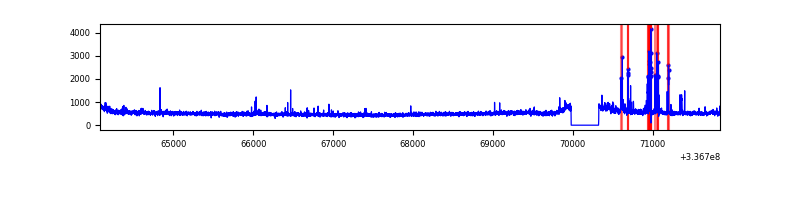 |
| C | 7758 | 7414 | 14 | 14 | 0.18% | 0.19% | 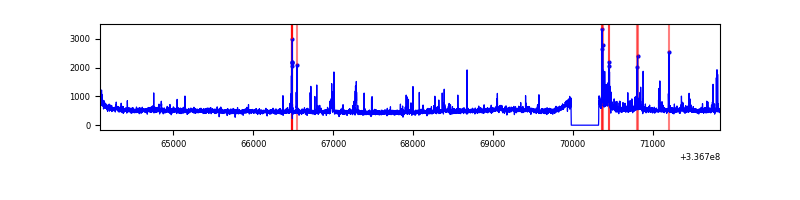 |
| D | 7757 | 7413 | 191 | 191 | 2.46% | 2.58% | 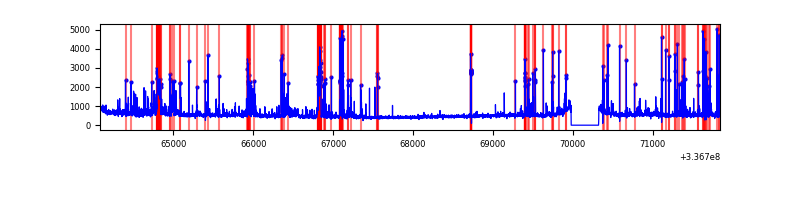 |
Top three noisy pixels from each quadrant. If the there are fewer than three noisy pixels in the level2.evt file, extra rows are filled as -1
| Pixel properties | Quadrant properties | ||||||
|---|---|---|---|---|---|---|---|
| Quadrant | DetID | PixID | Counts | Sigma | Mean | Median | Sigma |
| A | 0 | 13 | 291085 | 1494.92 | 951 | 932 | 194.1 |
| A | 13 | 254 | 11677 | 55.36 | 951 | 932 | 194.1 |
| A | 3 | 137 | 8739 | 40.22 | 951 | 932 | 194.1 |
| B | 5 | 172 | 150463 | 834.54 | 940 | 917 | 179.2 |
| B | 0 | 189 | 31874 | 172.75 | 940 | 917 | 179.2 |
| B | 0 | 219 | 23023 | 123.36 | 940 | 917 | 179.2 |
| C | 2 | 16 | 207000 | 967.59 | 903 | 907 | 213.0 |
| C | 14 | 238 | 144657 | 674.89 | 903 | 907 | 213.0 |
| C | 3 | 233 | 62341 | 288.43 | 903 | 907 | 213.0 |
| D | 1 | 52 | 524200 | 2353.3 | 909 | 883 | 222.4 |
| D | 12 | 233 | 240815 | 1078.95 | 909 | 883 | 222.4 |
| D | 2 | 250 | 179156 | 801.67 | 909 | 883 | 222.4 |
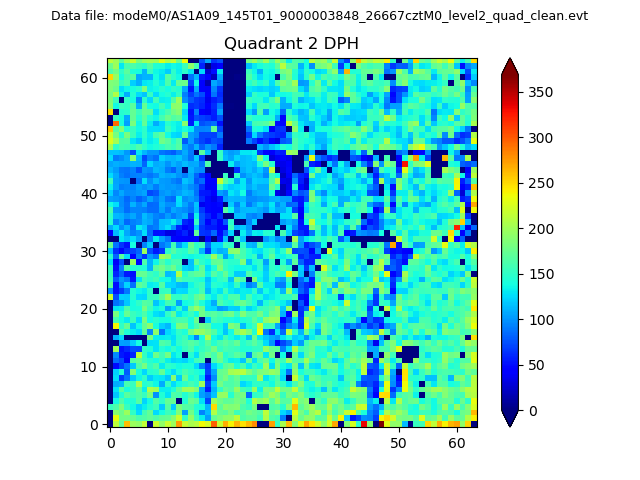
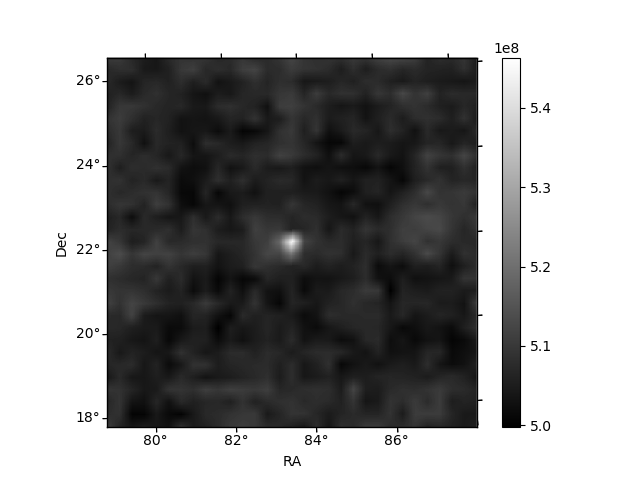
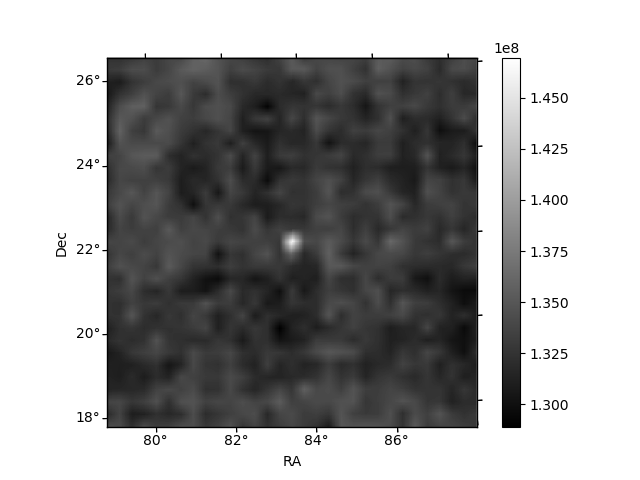
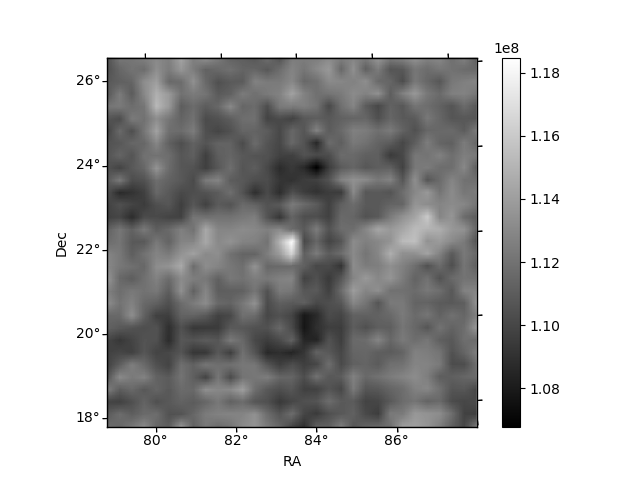
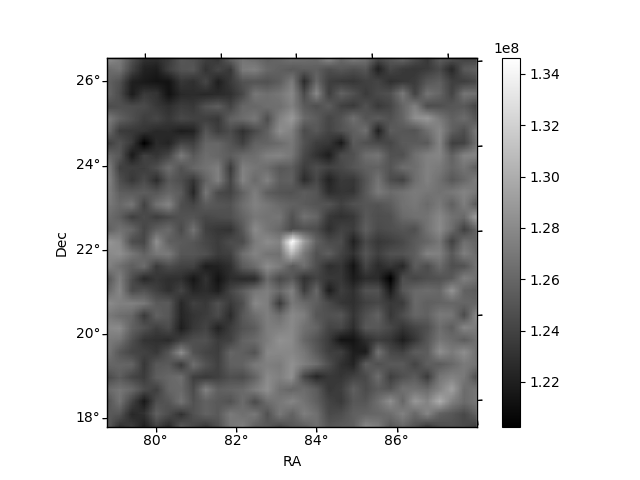
Histogram calculated using DETX and DETY for each event in the final _common_clean file
| Quadrant A | 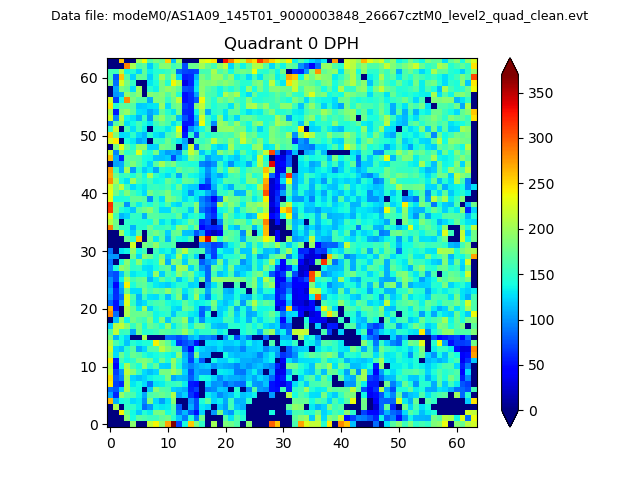 |
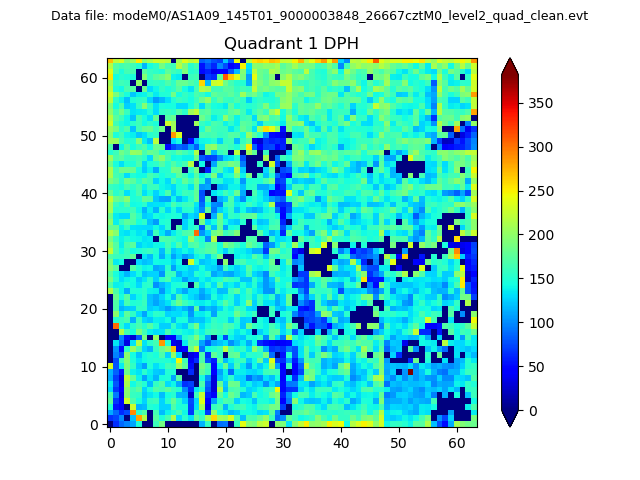 |
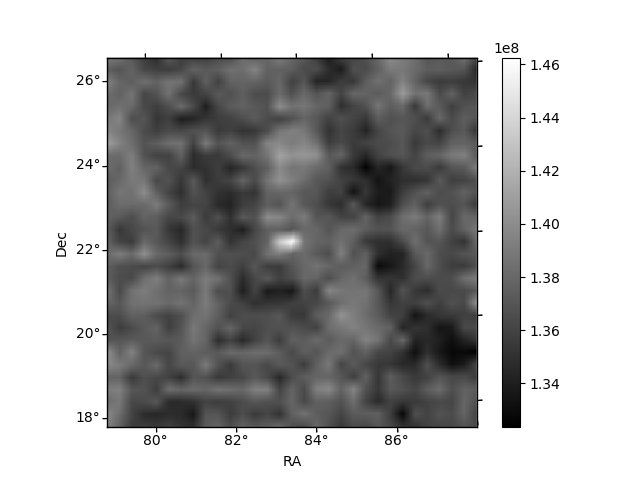
Quadrant B |
|---|---|---|---|
| Quadrant D | 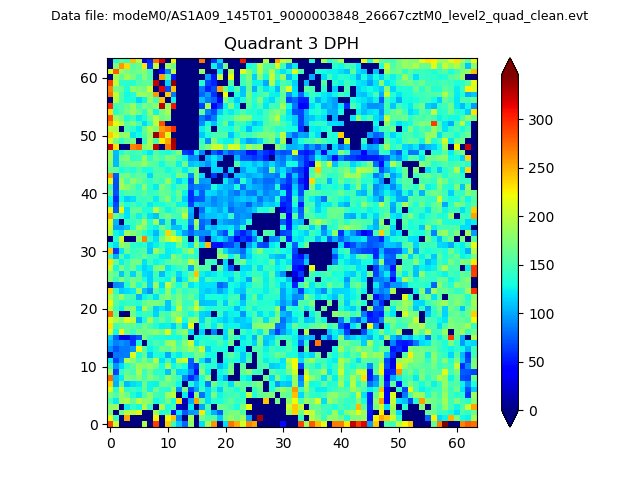 |
 |
Quadrant C |
| Plot type | Count rate plots | Images |
|---|---|---|
| Comparison with Poisson distribution Blue bars denote a histogram of data divided into 1 sec bins. Red curve is a Poisson curve with rate = median count rate of data. |
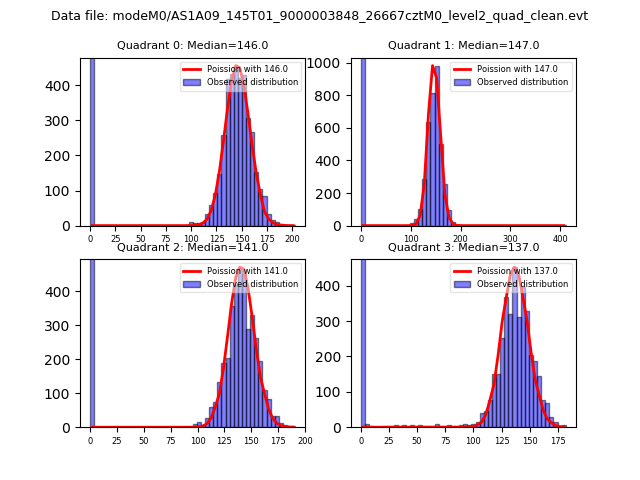 |
 |
| Quadrant-wise count rates Data is divided into 100 sec bins |
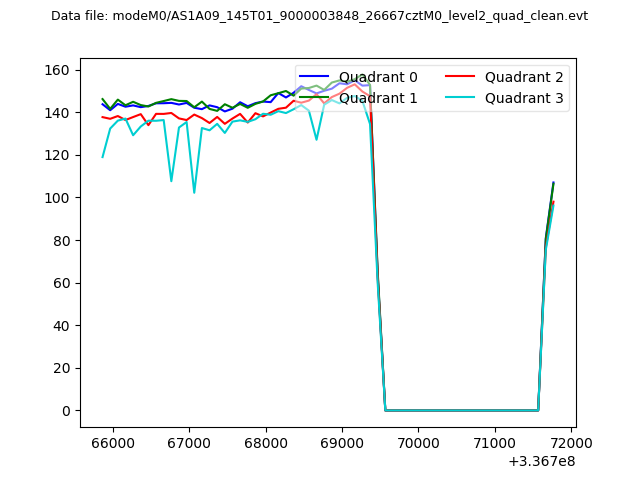 |
|
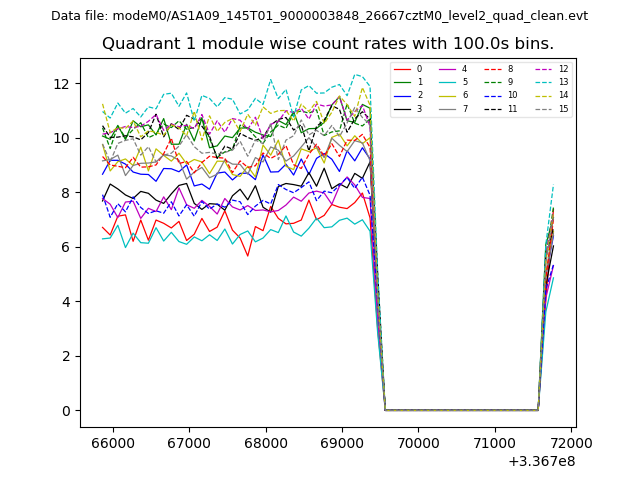
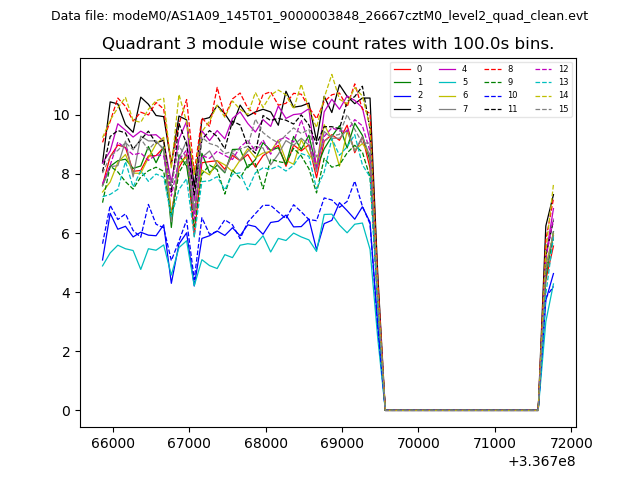
| Module-wise count rates for Quadrant A Data is divided into 100 sec bins |
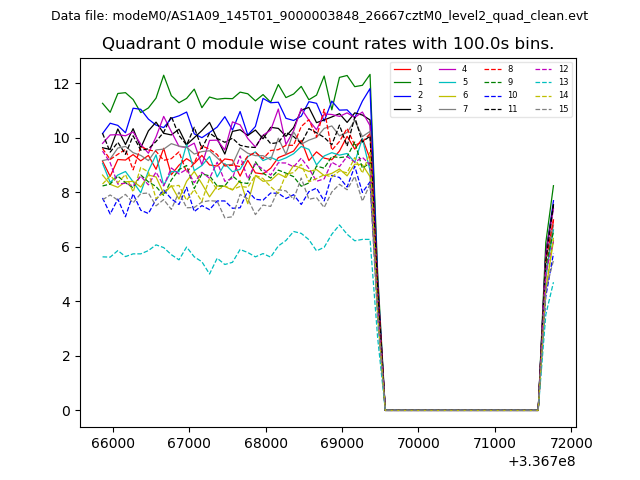 |
 |
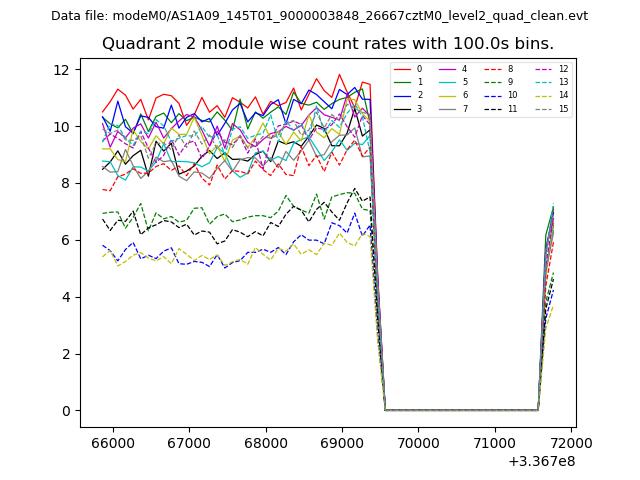
| Module-wise count rates for Quadrant B Data is divided into 100 sec bins |
 |
 |
| Module-wise count rates for Quadrant C Data is divided into 100 sec bins |
 |
 |
| Module-wise count rates for Quadrant D Data is divided into 100 sec bins |
 |
 |
| Parameter | Plot |
|---|---|
| CZT HV Monitor | 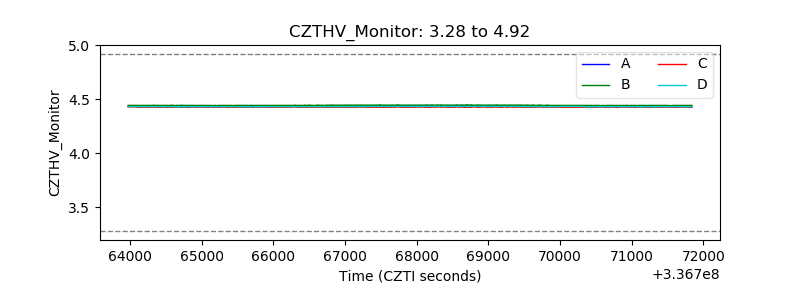 |
| D_VDD | 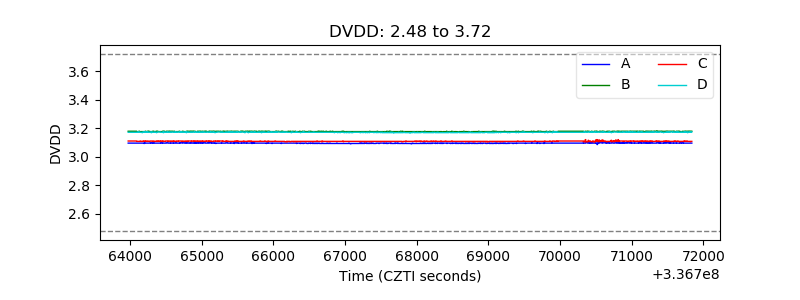 |
| Temperature 1 | 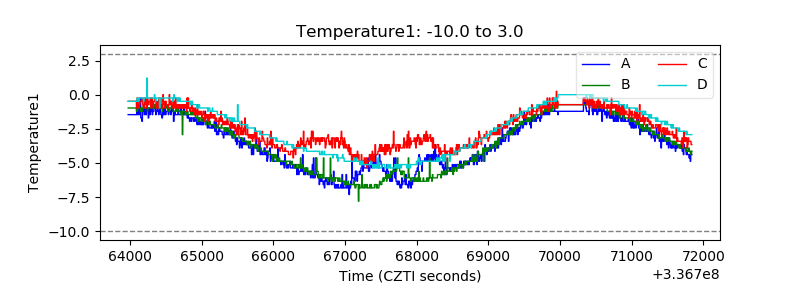 |
| Veto HV Monitor | 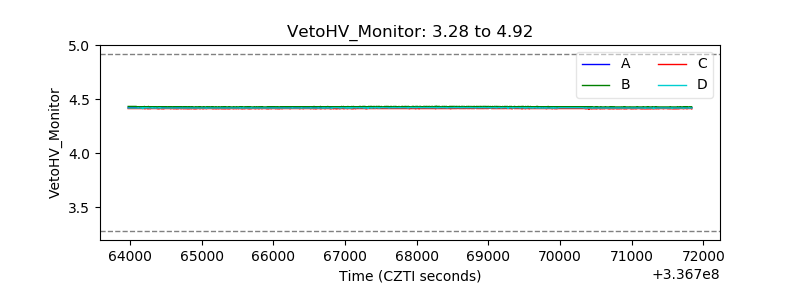 |
| Veto LLD | 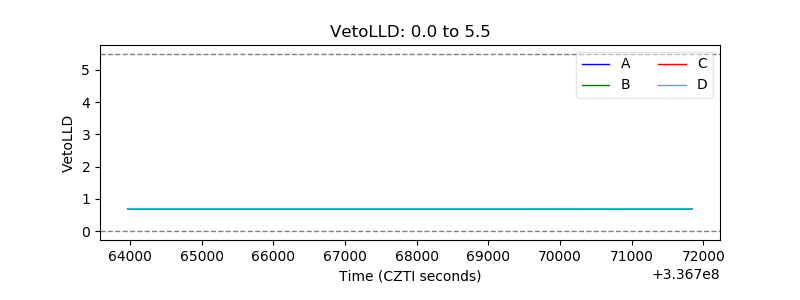 |
| Alpha Counter | 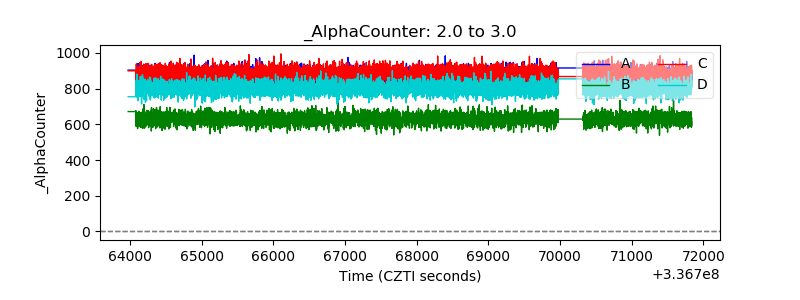 |
| _CPM_Rate | 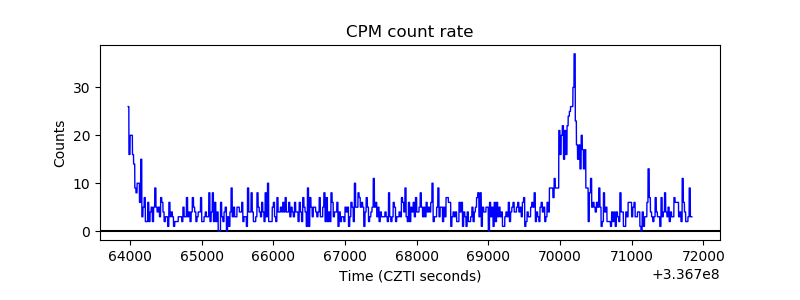 |
| CZT Counter | 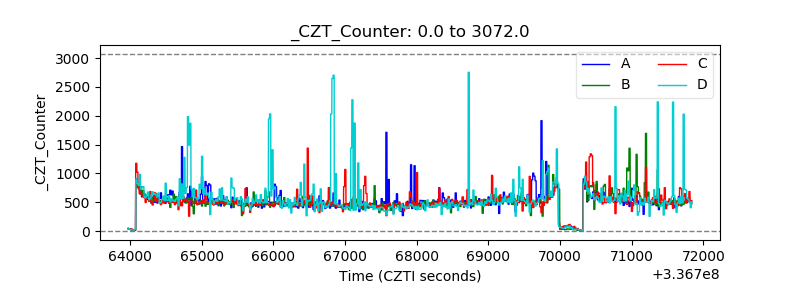 |
| +2.5 Volts monitor | 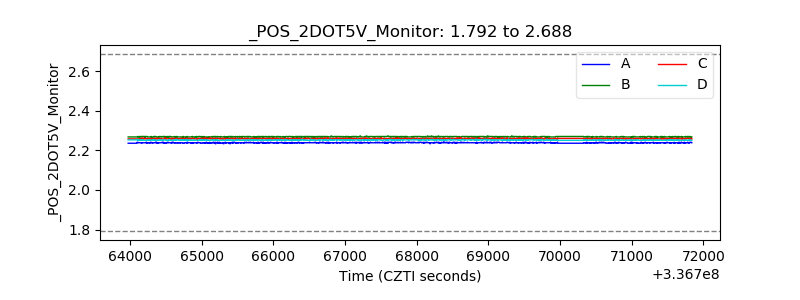 |
| +5 Volts monitor | 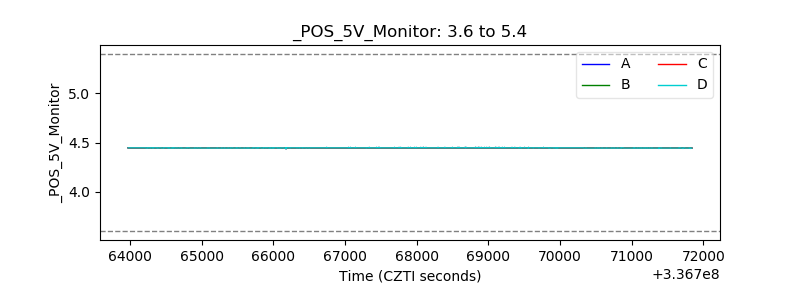 |
| _ROLL_ROT | 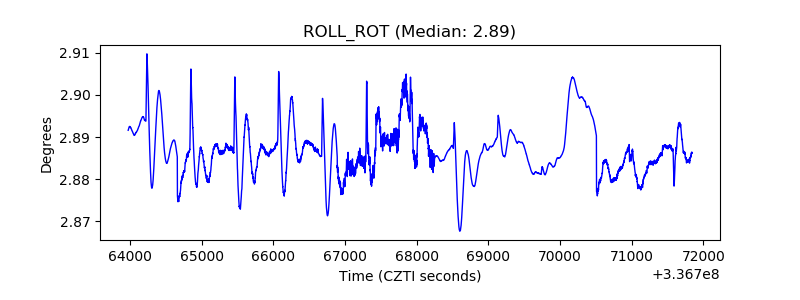 |
| _Roll_DEC | 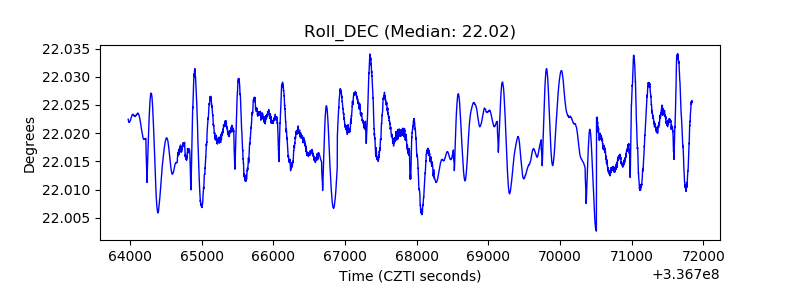 |
| _Roll_RA | 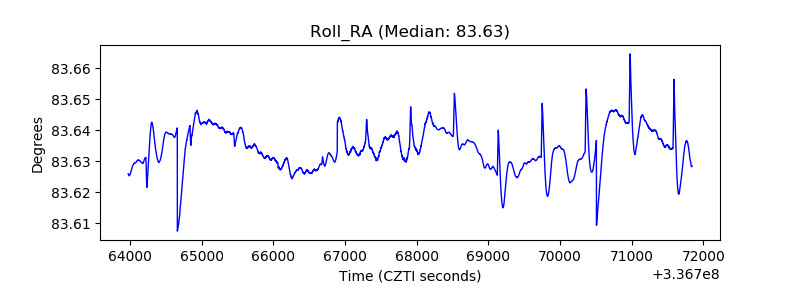 |
| Veto Counter | 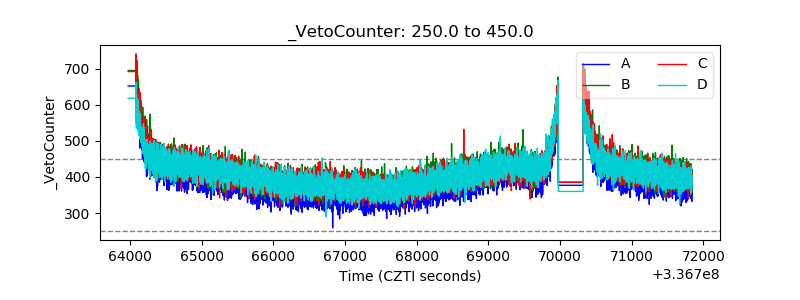 |