| Param | Original file | Final file |
|---|---|---|
| Filename | modeM0/AS1A09_145T01_9000003848_26668cztM0_level2.evt | modeM0/AS1A09_145T01_9000003848_26668cztM0_level2_quad_clean.evt |
| Size (bytes) | 612,181,440 | 93,648,960 |
| Size | 583.8 MB | 89.3 MB |
| Events in quadrant A | 3,616,269 | 612,389 |
| Events in quadrant B | 3,916,642 | 621,262 |
| Events in quadrant C | 3,470,481 | 594,443 |
| Events in quadrant D | 7,071,843 | 529,928 |
| Mode M0 | |||
|---|---|---|---|
| Quadrant | BADHDUFLAG | Total packets | Discarded packets |
| A | 0 | 14954 | 0 |
| B | 0 | 15814 | 0 |
| C | 0 | 14400 | 0 |
| D | 0 | 25649 | 0 |
| Mode M9 | |||
|---|---|---|---|
| Quadrant | BADHDUFLAG | Total packets | Discarded packets |
| A | 0 | 5 | 0 |
| B | 0 | 5 | 0 |
| C | 0 | 5 | 0 |
| D | 0 | 5 | 0 |
| Quadrant | Total seconds | Saturated seconds | Saturation percentage |
|---|---|---|---|
| A | 6859 | 90 | 1.312145% |
| B | 6860 | 294 | 4.285714% |
| C | 6860 | 86 | 1.253644% |
| D | 6860 | 1436 | 20.932945% |
Noise dominated data is calculated using 1-second bins in cleaned event files. If a bin has >2000 counts, and if more than 50% of those come from <1% of pixels, then it is considered to be noise-dominated and hence unusable.
| Quadrant | # 1 sec bins | Bins with >0 counts | Bins with >2000 counts | High rate bins dominated by noise | Noise dominated (total time) | Noise dominated (detector-on time) | Marked lightcurve |
|---|---|---|---|---|---|---|---|
| A | 7279 | 6860 | 29 | 29 | 0.40% | 0.42% | 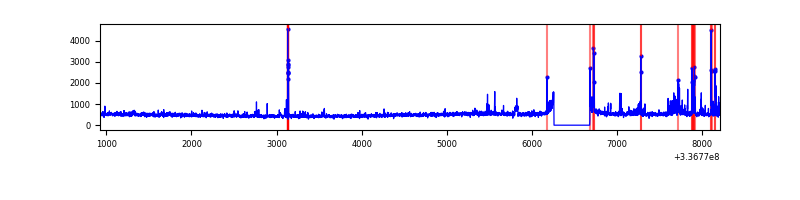 |
| B | 7280 | 6861 | 154 | 154 | 2.12% | 2.24% | 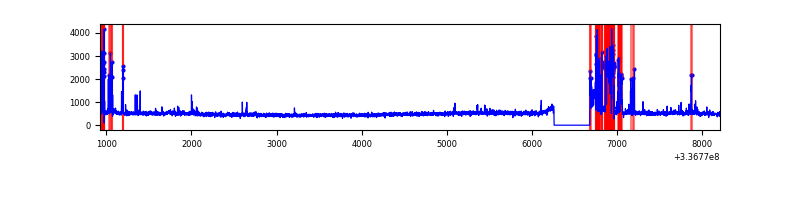 |
| C | 7280 | 6861 | 4 | 4 | 0.05% | 0.06% | 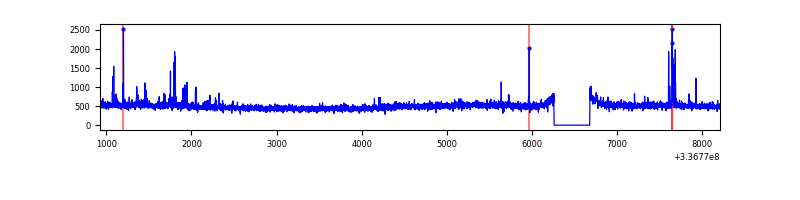 |
| D | 7280 | 6861 | 1119 | 1119 | 15.37% | 16.31% | 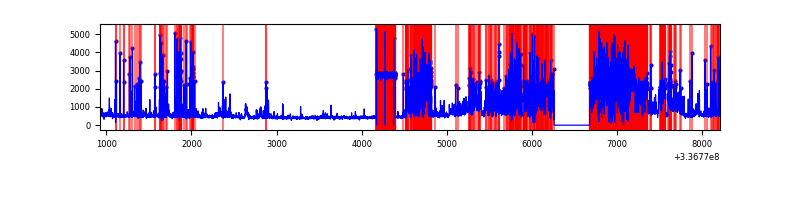 |
Top three noisy pixels from each quadrant. If the there are fewer than three noisy pixels in the level2.evt file, extra rows are filled as -1
| Pixel properties | Quadrant properties | ||||||
|---|---|---|---|---|---|---|---|
| Quadrant | DetID | PixID | Counts | Sigma | Mean | Median | Sigma |
| A | 0 | 13 | 277793 | 1592.99 | 855 | 838 | 173.9 |
| A | 13 | 170 | 32236 | 180.59 | 855 | 838 | 173.9 |
| A | 13 | 254 | 10639 | 56.37 | 855 | 838 | 173.9 |
| B | 5 | 172 | 568523 | 3541.38 | 833 | 815 | 160.3 |
| B | 0 | 244 | 30478 | 185.04 | 833 | 815 | 160.3 |
| B | 0 | 189 | 19454 | 116.27 | 833 | 815 | 160.3 |
| C | 14 | 238 | 131199 | 666.04 | 821 | 829 | 195.7 |
| C | 15 | 208 | 57921 | 291.67 | 821 | 829 | 195.7 |
| C | 3 | 233 | 48029 | 241.14 | 821 | 829 | 195.7 |
| D | 7 | 80 | 3233632 | 18026.66 | 725 | 704 | 179.3 |
| D | 1 | 52 | 707678 | 3942.05 | 725 | 704 | 179.3 |
| D | 2 | 250 | 267898 | 1489.86 | 725 | 704 | 179.3 |
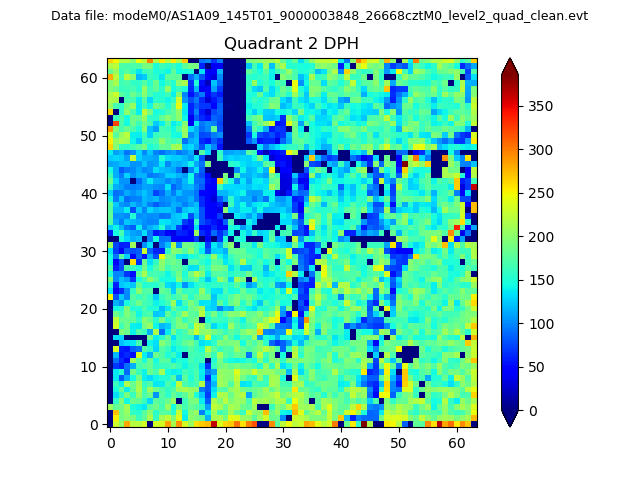
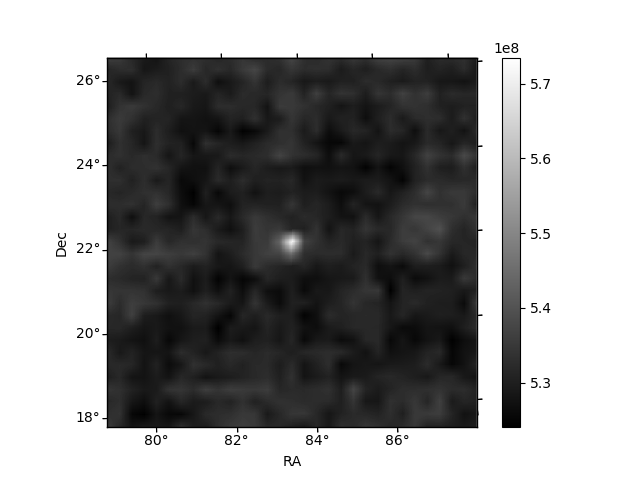
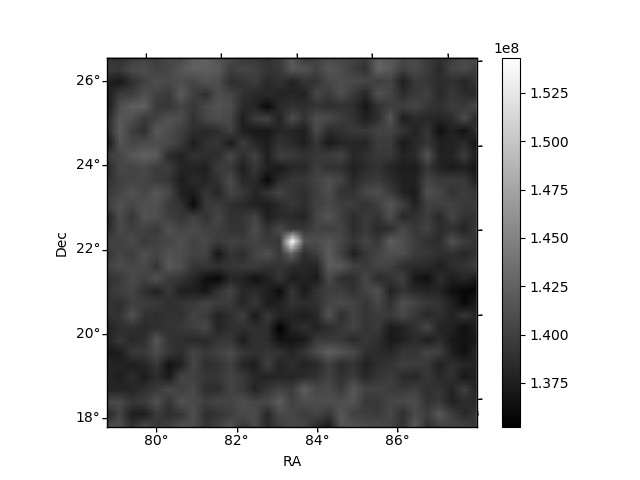
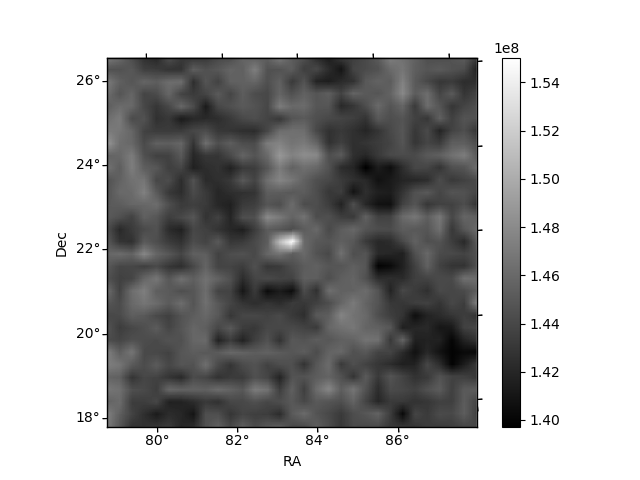
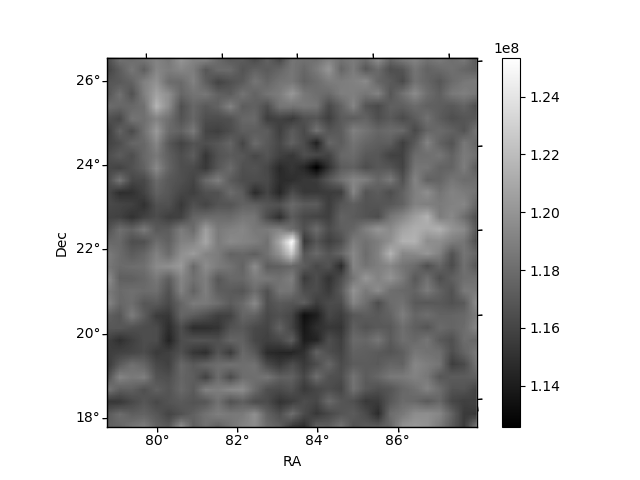
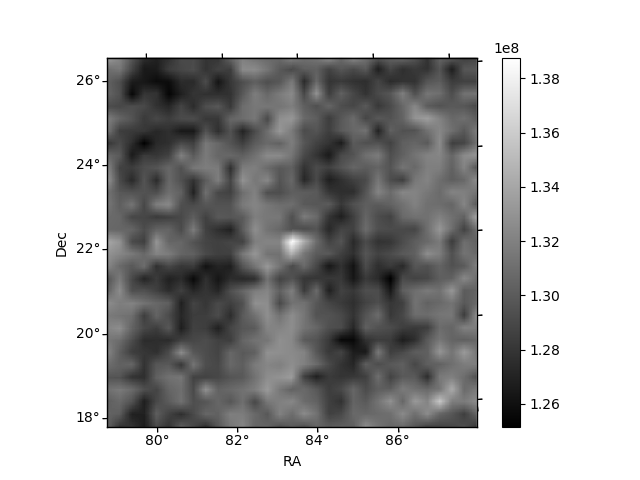
Histogram calculated using DETX and DETY for each event in the final _common_clean file
| Quadrant A | 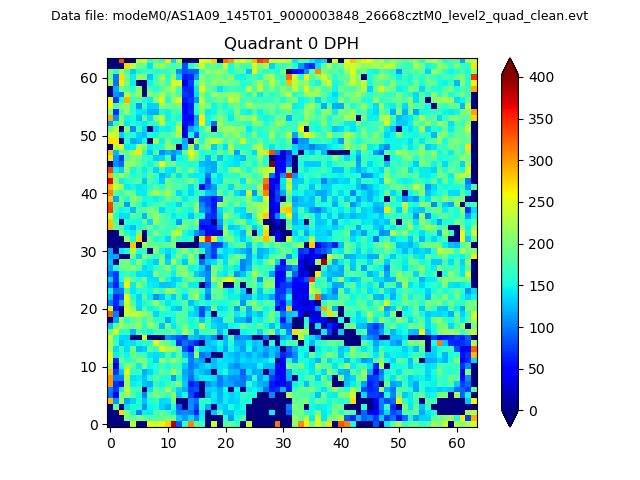 |
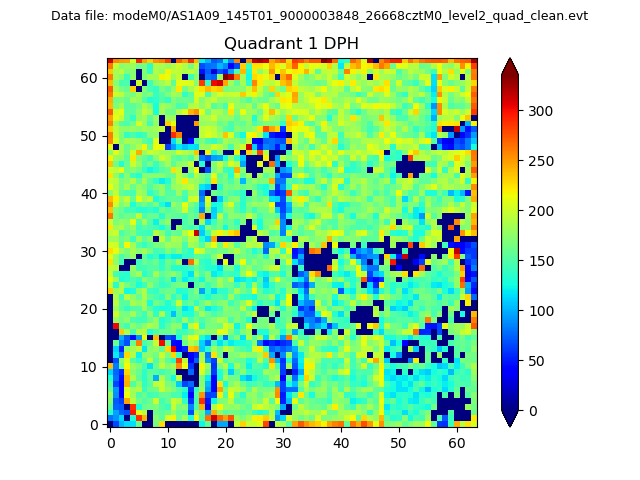 |
Quadrant B |
|---|---|---|---|
| Quadrant D | 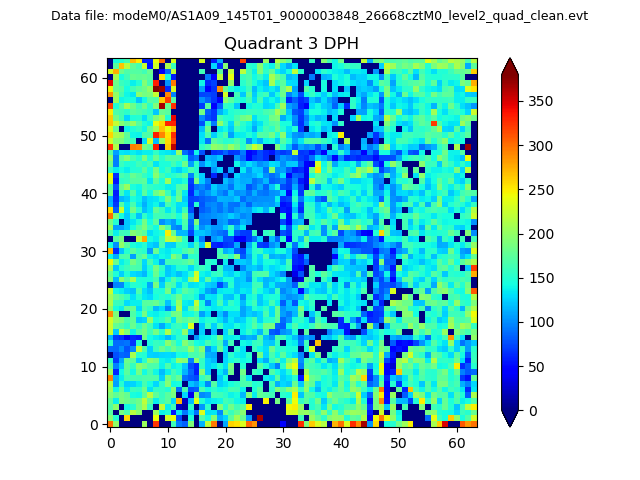 |
 |
Quadrant C |
| Plot type | Count rate plots | Images |
|---|---|---|
| Comparison with Poisson distribution Blue bars denote a histogram of data divided into 1 sec bins. Red curve is a Poisson curve with rate = median count rate of data. |
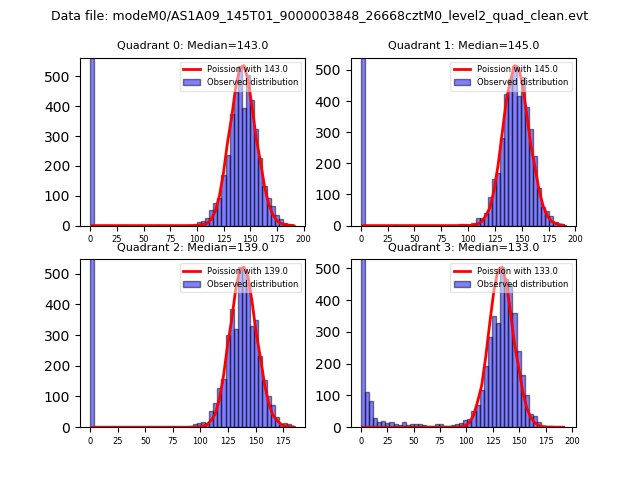 |
 |
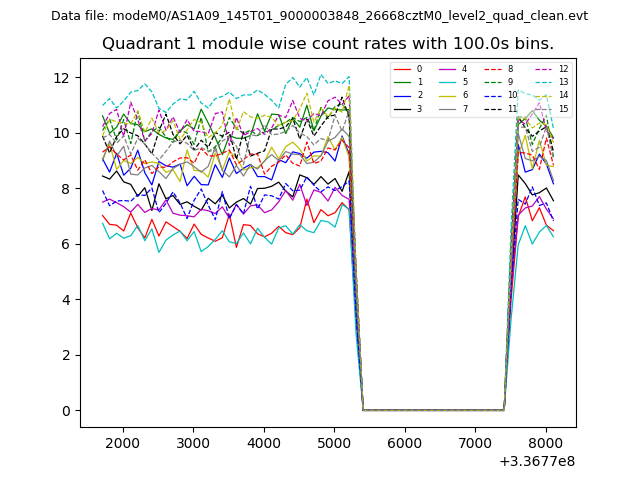
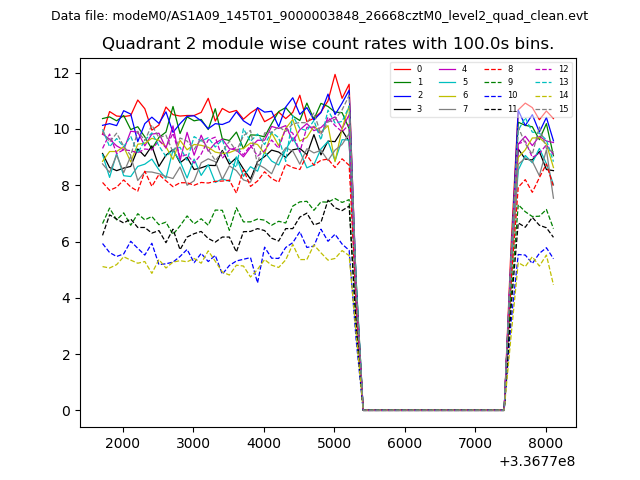
| Quadrant-wise count rates Data is divided into 100 sec bins |
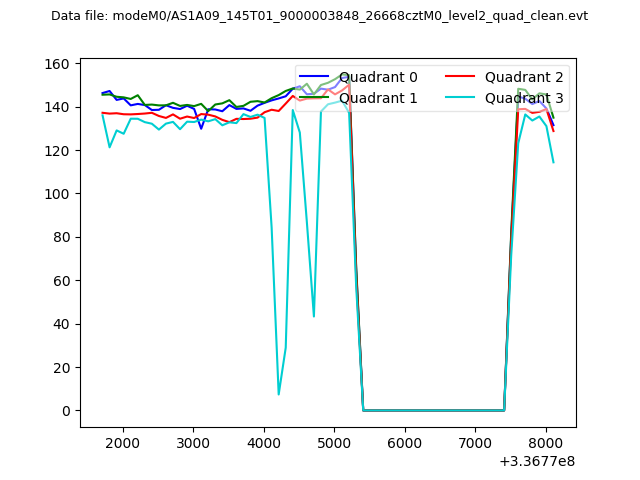 |
|
| Module-wise count rates for Quadrant A Data is divided into 100 sec bins |
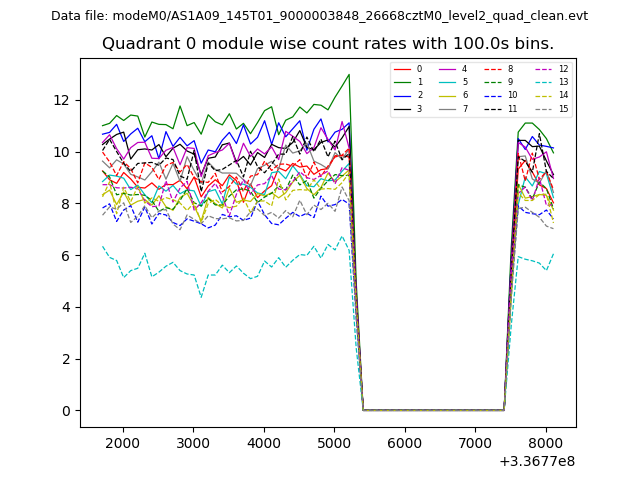 |
 |
| Module-wise count rates for Quadrant B Data is divided into 100 sec bins |
 |
 |
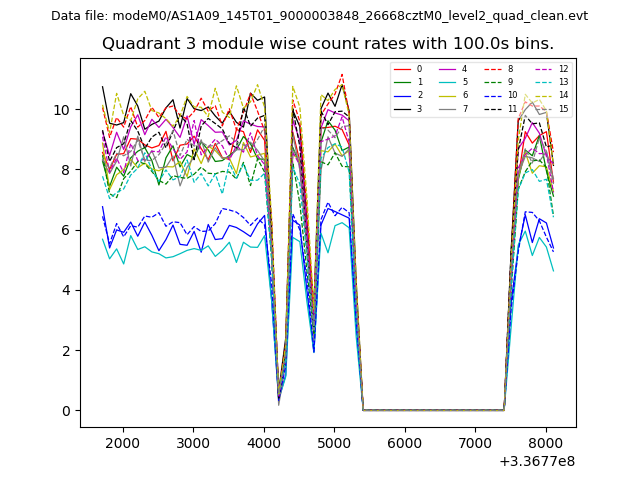
| Module-wise count rates for Quadrant C Data is divided into 100 sec bins |
 |
 |
| Module-wise count rates for Quadrant D Data is divided into 100 sec bins |
 |
 |
| Parameter | Plot |
|---|---|
| CZT HV Monitor | 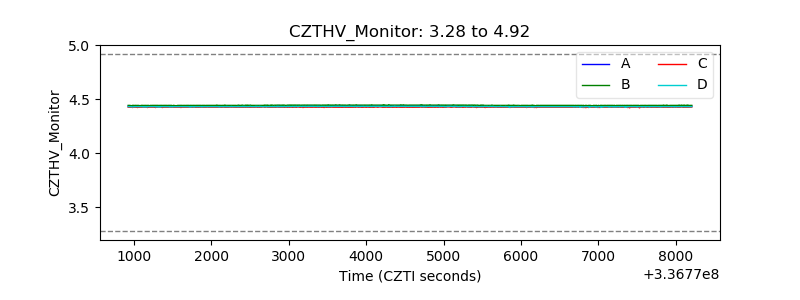 |
| D_VDD | 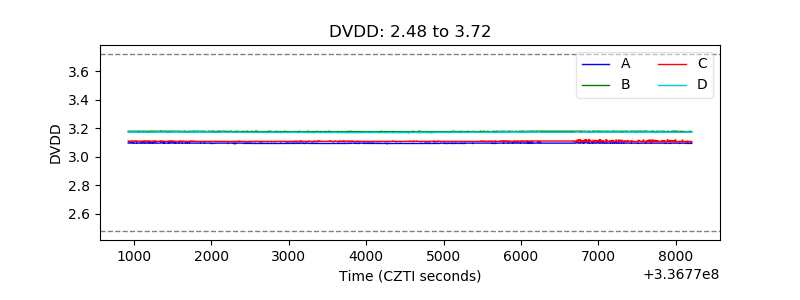 |
| Temperature 1 | 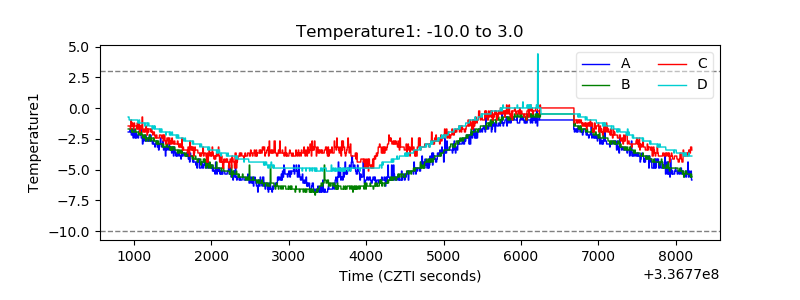 |
| Veto HV Monitor | 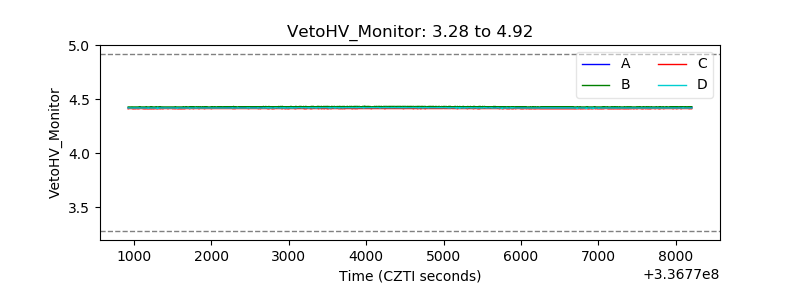 |
| Veto LLD | 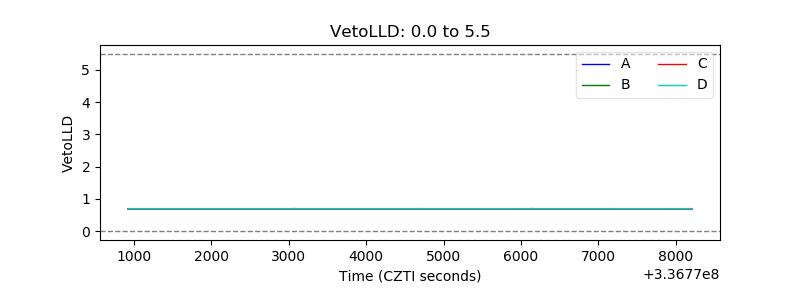 |
| Alpha Counter | 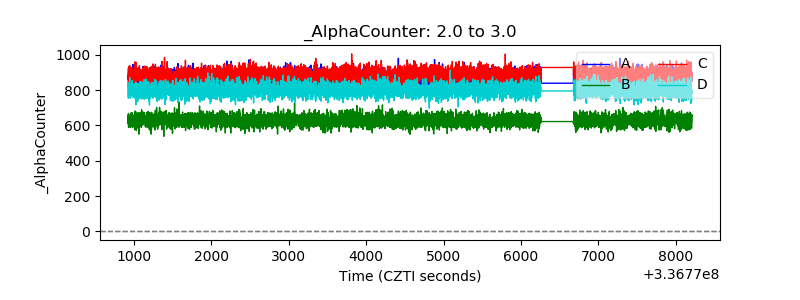 |
| _CPM_Rate | 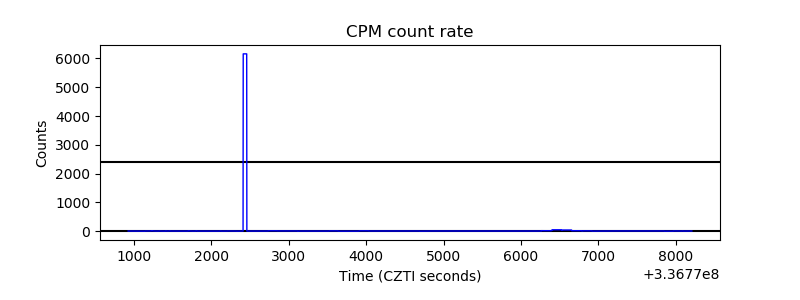 |
| CZT Counter | 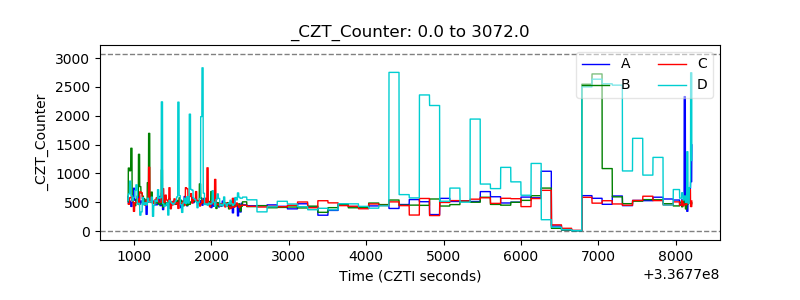 |
| +2.5 Volts monitor |  |
| +5 Volts monitor |  |
| _ROLL_ROT | 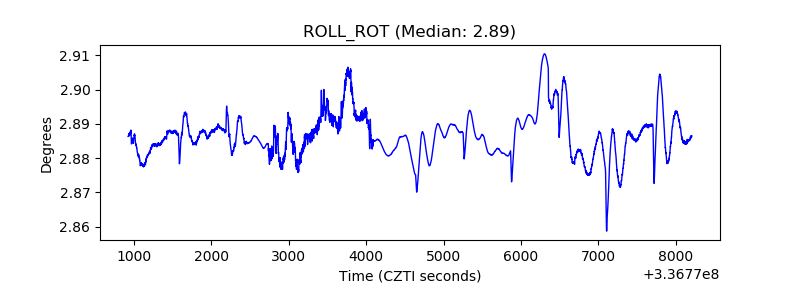 |
| _Roll_DEC | 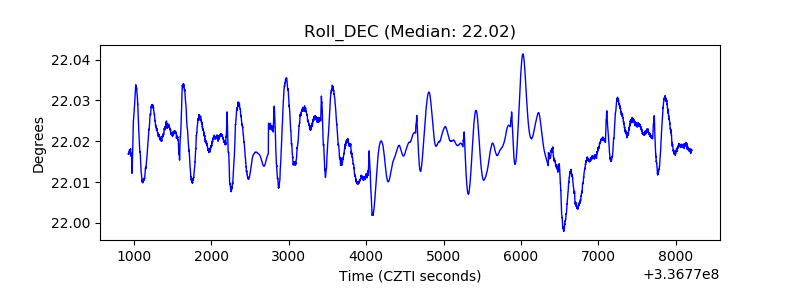 |
| _Roll_RA | 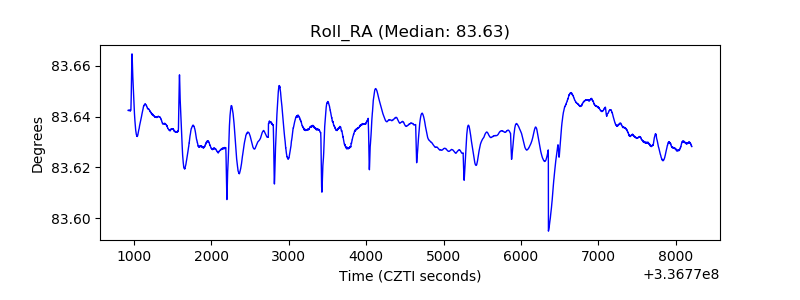 |
| Veto Counter |  |