| Param | Original file | Final file |
|---|---|---|
| Filename | modeM0/AS1A09_145T01_9000003848_26672cztM0_level2.evt | modeM0/AS1A09_145T01_9000003848_26672cztM0_level2_quad_clean.evt |
| Size (bytes) | 503,668,800 | 103,890,240 |
| Size | 480.3 MB | 99.1 MB |
| Events in quadrant A | 3,360,450 | 680,777 |
| Events in quadrant B | 3,363,938 | 696,131 |
| Events in quadrant C | 3,694,064 | 662,651 |
| Events in quadrant D | 4,376,897 | 636,144 |
| Mode M0 | |||
|---|---|---|---|
| Quadrant | BADHDUFLAG | Total packets | Discarded packets |
| A | 0 | 14251 | 0 |
| B | 0 | 14170 | 0 |
| C | 0 | 15135 | 0 |
| D | 0 | 17525 | 0 |
| Mode M9 | |||
|---|---|---|---|
| Quadrant | BADHDUFLAG | Total packets | Discarded packets |
| A | 0 | 13 | 0 |
| B | 0 | 14 | 0 |
| C | 0 | 14 | 0 |
| D | 0 | 14 | 0 |
| Quadrant | Total seconds | Saturated seconds | Saturation percentage |
|---|---|---|---|
| A | 6742 | 42 | 0.622961% |
| B | 6742 | 50 | 0.741620% |
| C | 6742 | 172 | 2.551172% |
| D | 6742 | 241 | 3.574607% |
Noise dominated data is calculated using 1-second bins in cleaned event files. If a bin has >2000 counts, and if more than 50% of those come from <1% of pixels, then it is considered to be noise-dominated and hence unusable.
| Quadrant | # 1 sec bins | Bins with >0 counts | Bins with >2000 counts | High rate bins dominated by noise | Noise dominated (total time) | Noise dominated (detector-on time) | Marked lightcurve |
|---|---|---|---|---|---|---|---|
| A | 7727 | 6743 | 3 | 3 | 0.04% | 0.04% | 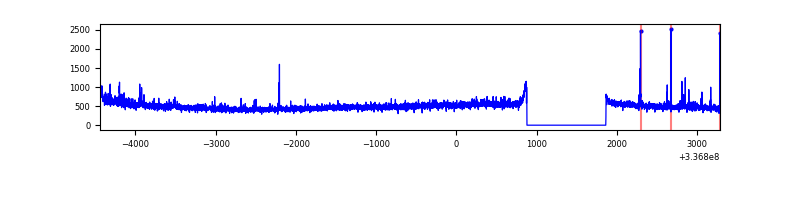 |
| B | 7727 | 6743 | 3 | 3 | 0.04% | 0.04% | 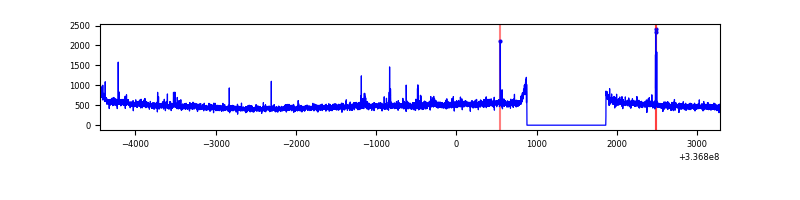 |
| C | 7727 | 6743 | 59 | 59 | 0.76% | 0.87% | 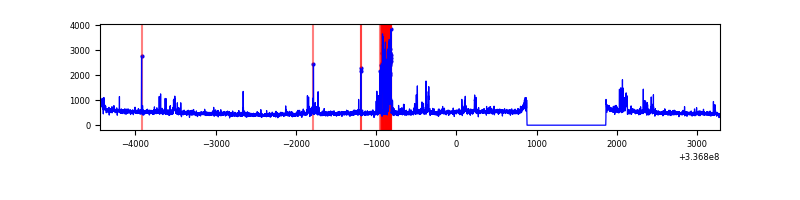 |
| D | 7727 | 6743 | 176 | 176 | 2.28% | 2.61% | 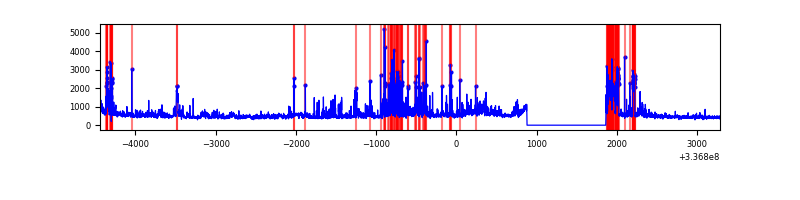 |
Top three noisy pixels from each quadrant. If the there are fewer than three noisy pixels in the level2.evt file, extra rows are filled as -1
| Pixel properties | Quadrant properties | ||||||
|---|---|---|---|---|---|---|---|
| Quadrant | DetID | PixID | Counts | Sigma | Mean | Median | Sigma |
| A | 0 | 13 | 108351 | 630.52 | 842 | 829 | 170.5 |
| A | 13 | 254 | 10649 | 57.59 | 842 | 829 | 170.5 |
| A | 3 | 137 | 7561 | 39.48 | 842 | 829 | 170.5 |
| B | 10 | 251 | 24025 | 144.81 | 843 | 823 | 160.2 |
| B | 12 | 111 | 19023 | 113.59 | 843 | 823 | 160.2 |
| B | 11 | 111 | 17053 | 101.29 | 843 | 823 | 160.2 |
| C | 3 | 233 | 323981 | 1701.21 | 805 | 815 | 190.0 |
| C | 14 | 238 | 129276 | 676.24 | 805 | 815 | 190.0 |
| C | 2 | 16 | 47408 | 245.27 | 805 | 815 | 190.0 |
| D | 1 | 52 | 984054 | 5021.43 | 805 | 783 | 195.8 |
| D | 2 | 250 | 241043 | 1226.97 | 805 | 783 | 195.8 |
| D | 13 | 104 | 36523 | 182.52 | 805 | 783 | 195.8 |
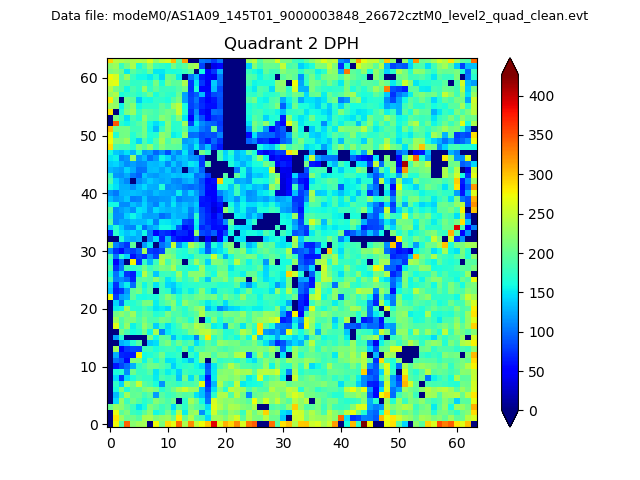
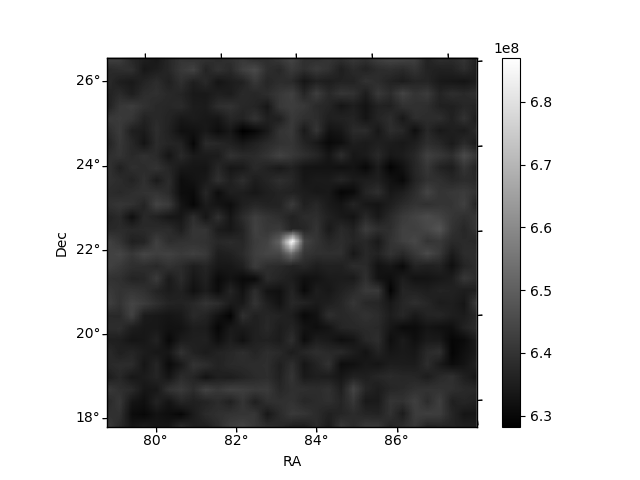
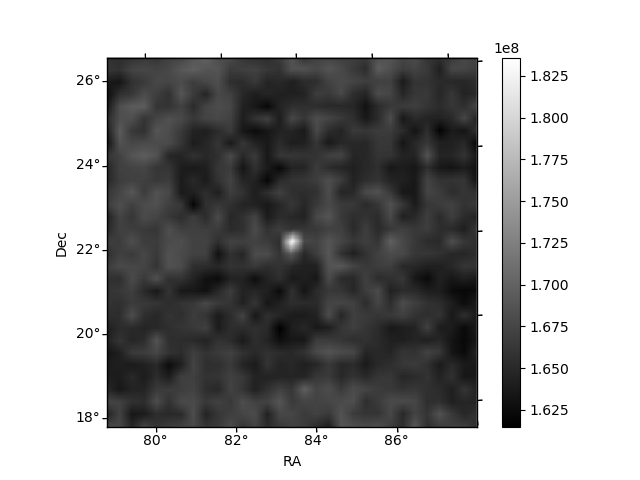
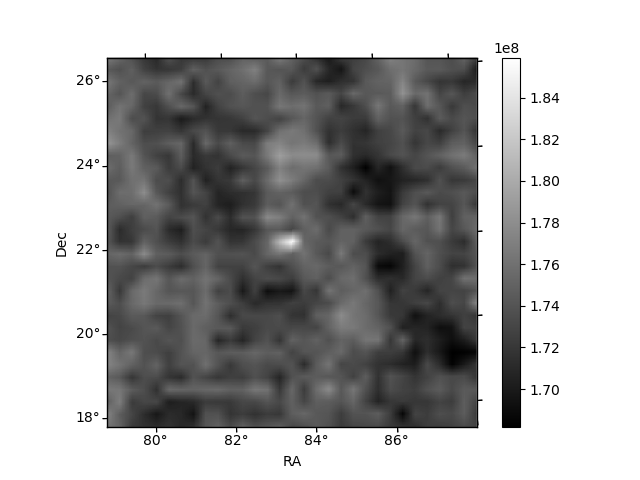
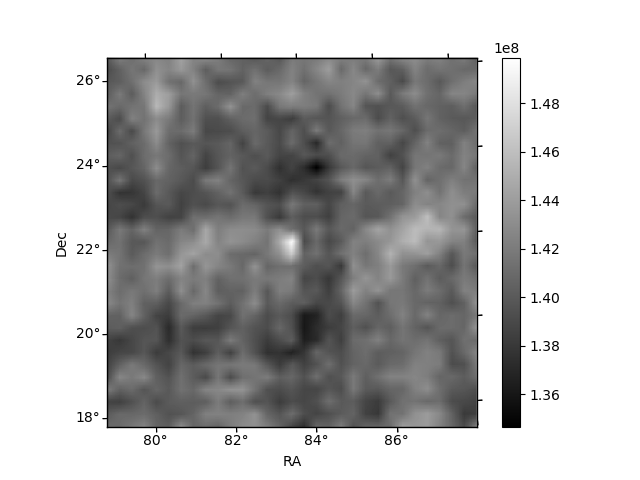
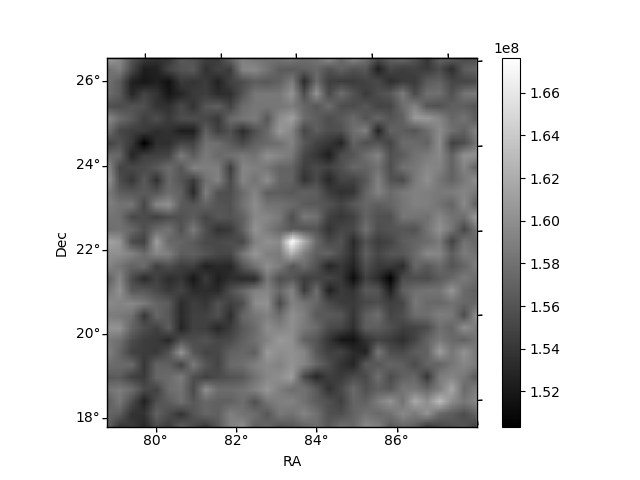
Histogram calculated using DETX and DETY for each event in the final _common_clean file
| Quadrant A | 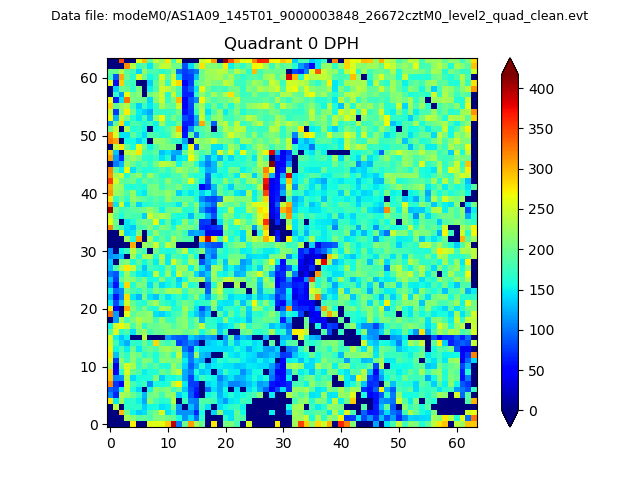 |
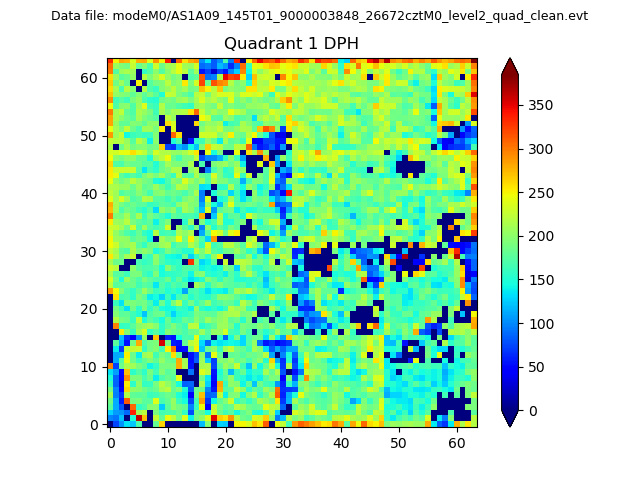 |
Quadrant B |
|---|---|---|---|
| Quadrant D | 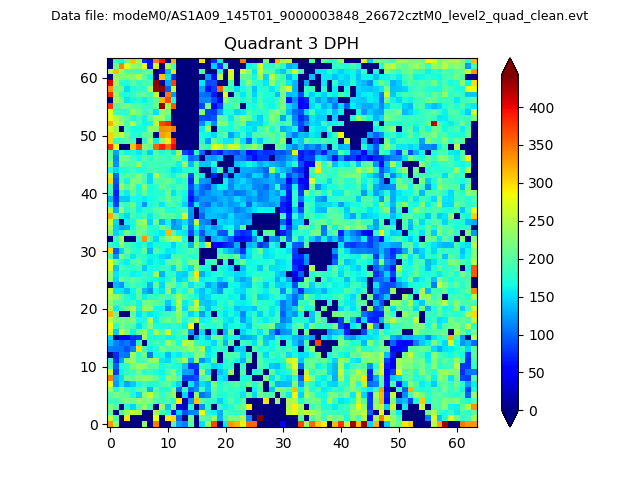 |
 |
Quadrant C |
| Plot type | Count rate plots | Images |
|---|---|---|
| Comparison with Poisson distribution Blue bars denote a histogram of data divided into 1 sec bins. Red curve is a Poisson curve with rate = median count rate of data. |
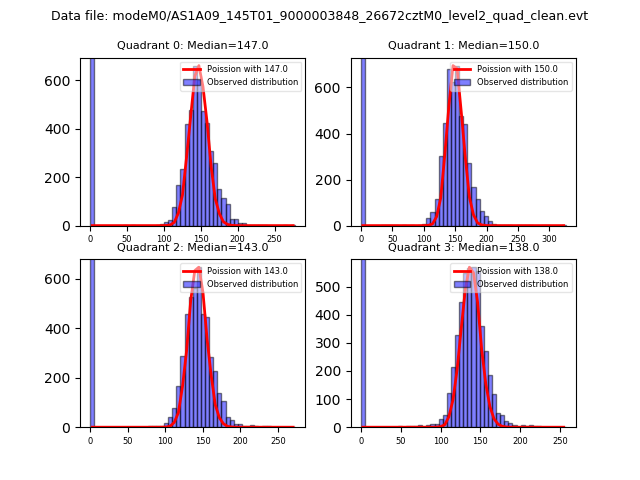 |
 |
| Quadrant-wise count rates Data is divided into 100 sec bins |
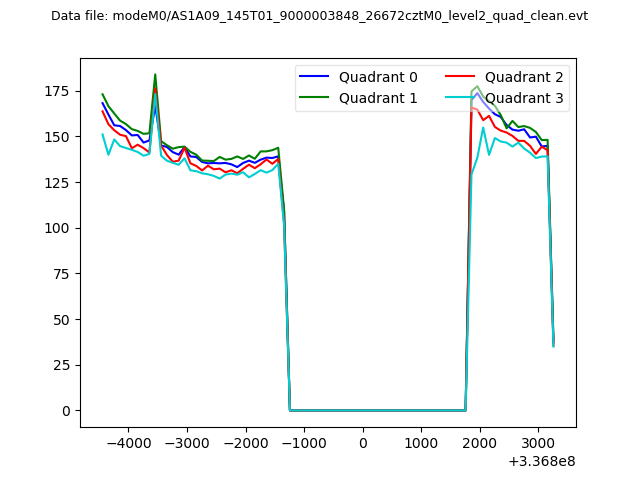 |
|
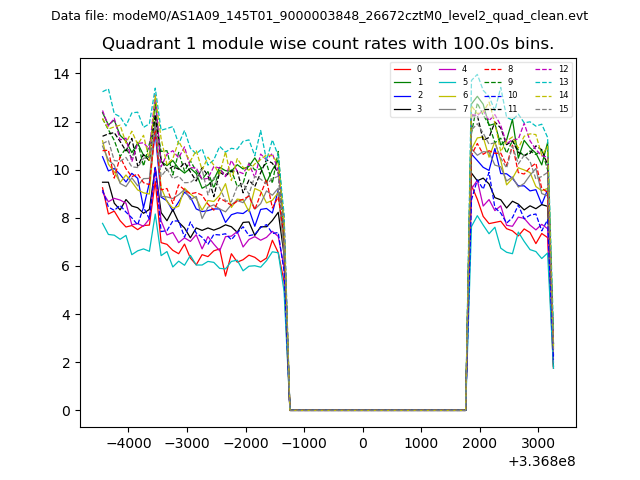
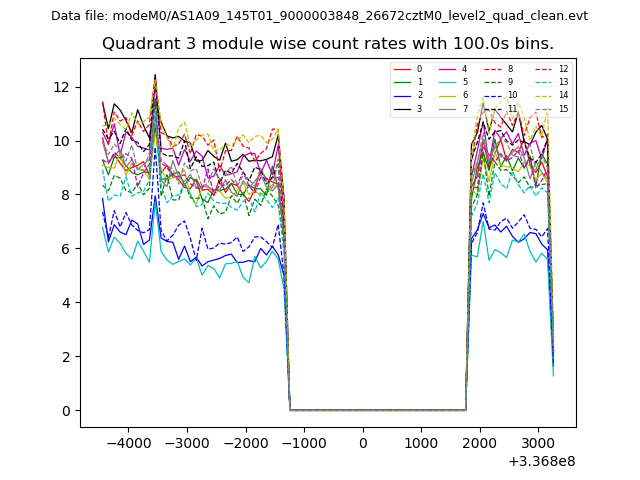
| Module-wise count rates for Quadrant A Data is divided into 100 sec bins |
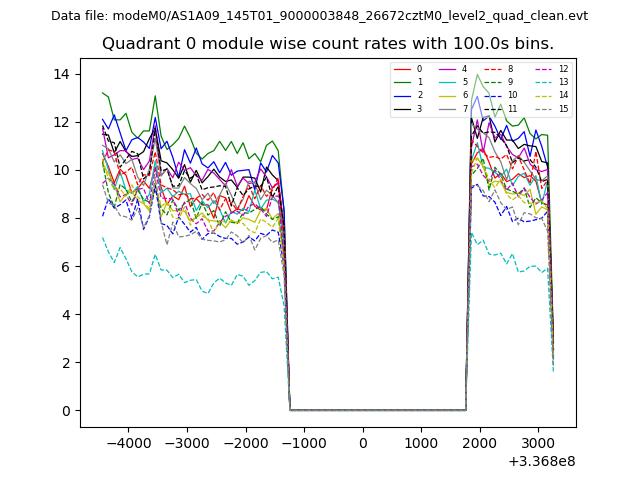 |
 |
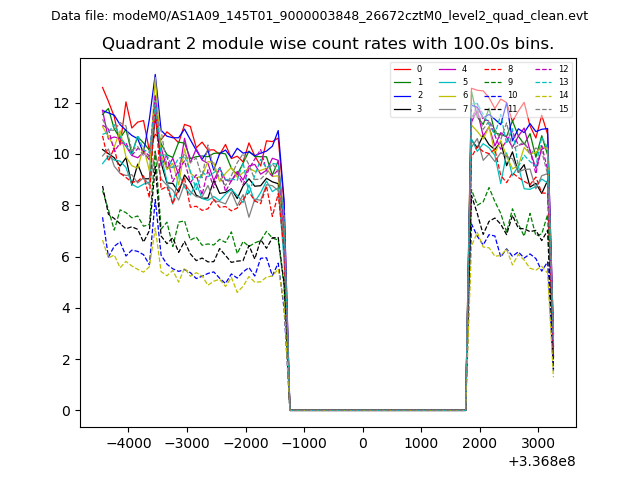
| Module-wise count rates for Quadrant B Data is divided into 100 sec bins |
 |
 |
| Module-wise count rates for Quadrant C Data is divided into 100 sec bins |
 |
 |
| Module-wise count rates for Quadrant D Data is divided into 100 sec bins |
 |
 |
| Parameter | Plot |
|---|---|
| CZT HV Monitor | 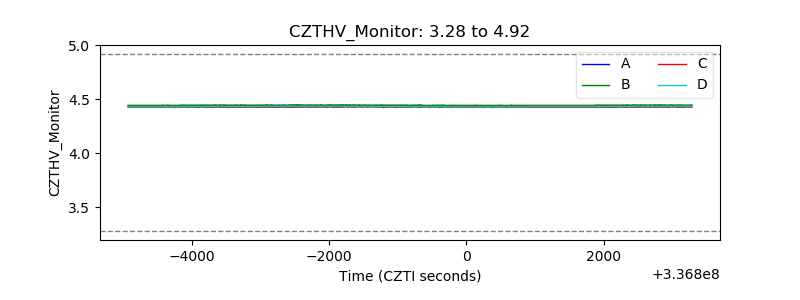 |
| D_VDD | 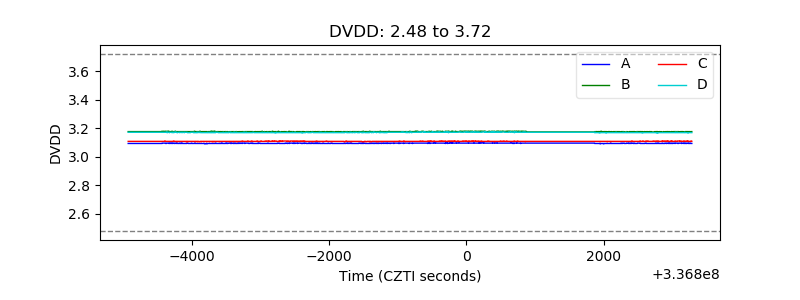 |
| Temperature 1 | 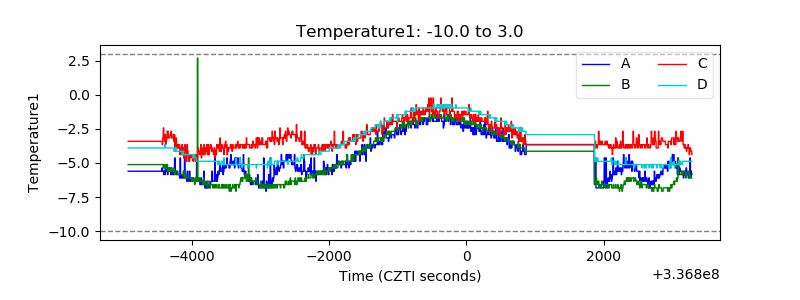 |
| Veto HV Monitor | 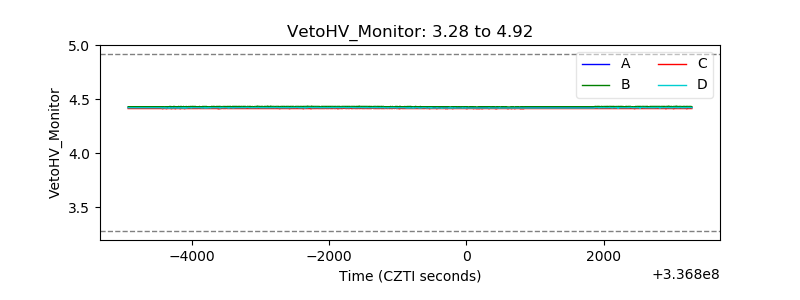 |
| Veto LLD | 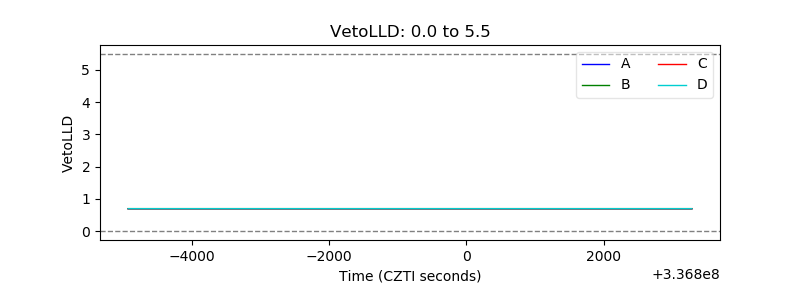 |
| Alpha Counter | 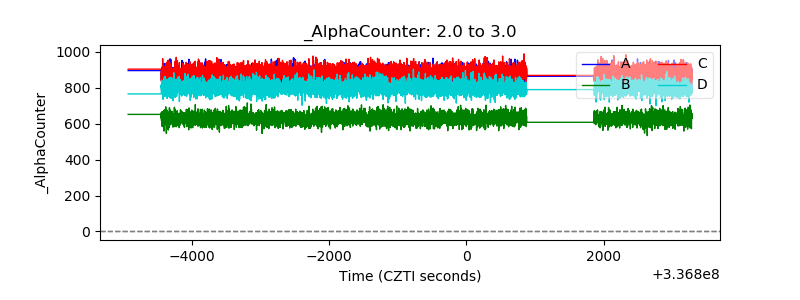 |
| _CPM_Rate | 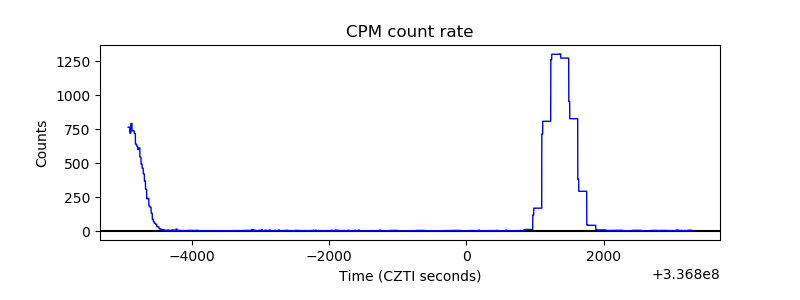 |
| CZT Counter | 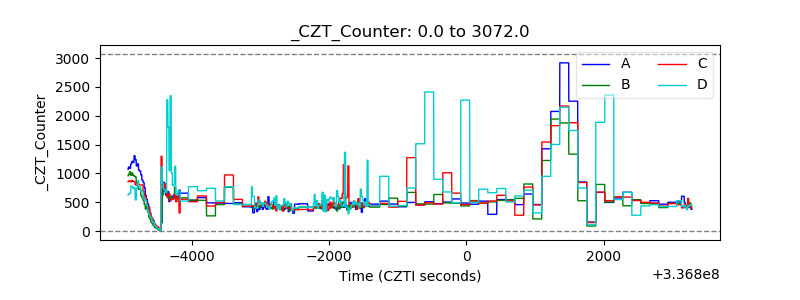 |
| +2.5 Volts monitor | 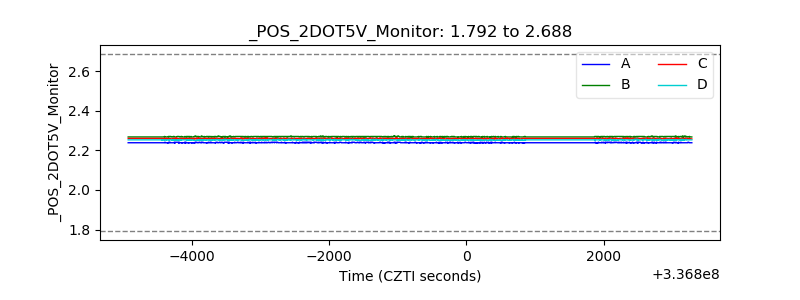 |
| +5 Volts monitor | 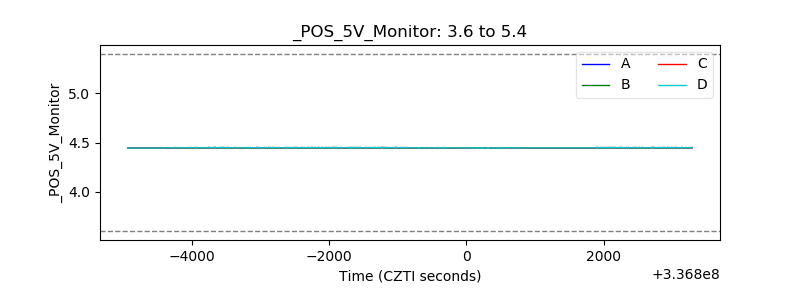 |
| _ROLL_ROT | 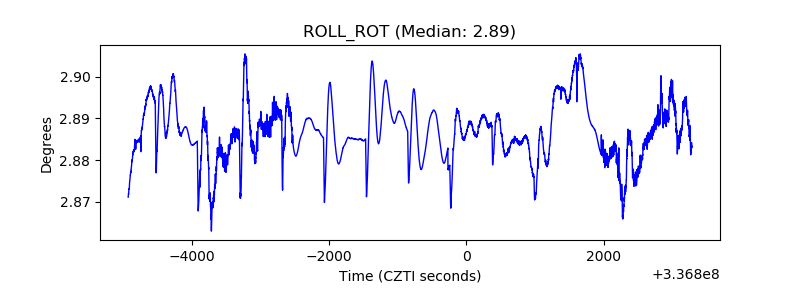 |
| _Roll_DEC | 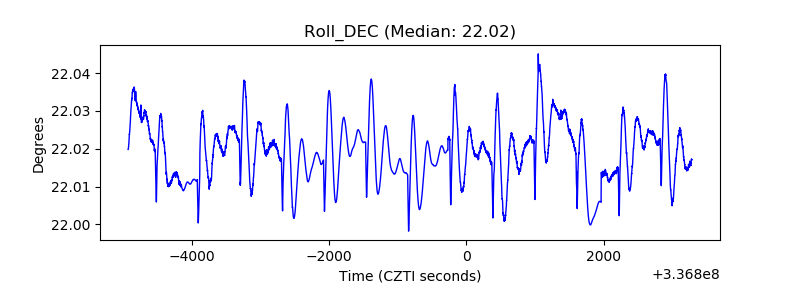 |
| _Roll_RA | 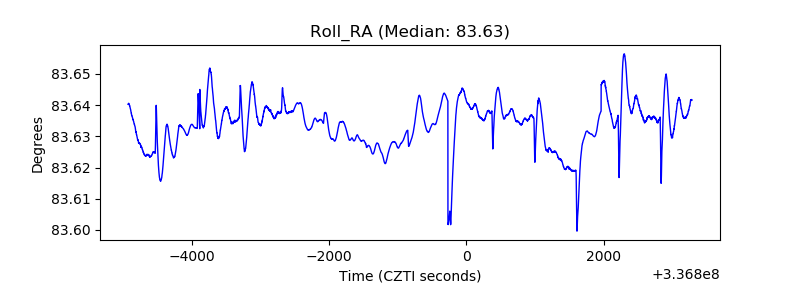 |
| Veto Counter | 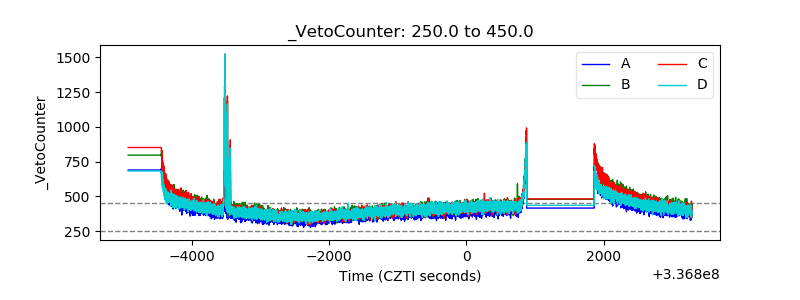 |