| Param | Original file | Final file |
|---|---|---|
| Filename | modeM0/AS1A09_145T01_9000003848_26675cztM0_level2.evt | modeM0/AS1A09_145T01_9000003848_26675cztM0_level2_quad_clean.evt |
| Size (bytes) | 445,118,400 | 84,864,960 |
| Size | 424.5 MB | 80.9 MB |
| Events in quadrant A | 3,608,305 | 558,946 |
| Events in quadrant B | 2,937,061 | 561,845 |
| Events in quadrant C | 2,863,740 | 537,637 |
| Events in quadrant D | 3,695,631 | 524,366 |
| Mode M0 | |||
|---|---|---|---|
| Quadrant | BADHDUFLAG | Total packets | Discarded packets |
| A | 0 | 14395 | 0 |
| B | 0 | 11910 | 0 |
| C | 0 | 11716 | 0 |
| D | 0 | 14450 | 0 |
| Mode M9 | |||
|---|---|---|---|
| Quadrant | BADHDUFLAG | Total packets | Discarded packets |
| A | 0 | 12 | 0 |
| B | 0 | 12 | 0 |
| C | 0 | 12 | 0 |
| D | 0 | 12 | 0 |
| Quadrant | Total seconds | Saturated seconds | Saturation percentage |
|---|---|---|---|
| A | 5536 | 67 | 1.210260% |
| B | 5537 | 80 | 1.444826% |
| C | 5537 | 66 | 1.191981% |
| D | 5537 | 198 | 3.575944% |
Noise dominated data is calculated using 1-second bins in cleaned event files. If a bin has >2000 counts, and if more than 50% of those come from <1% of pixels, then it is considered to be noise-dominated and hence unusable.
| Quadrant | # 1 sec bins | Bins with >0 counts | Bins with >2000 counts | High rate bins dominated by noise | Noise dominated (total time) | Noise dominated (detector-on time) | Marked lightcurve |
|---|---|---|---|---|---|---|---|
| A | 6736 | 5537 | 12 | 12 | 0.18% | 0.22% | 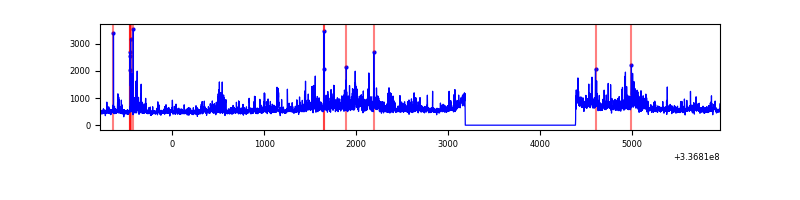 |
| B | 6737 | 5538 | 30 | 30 | 0.45% | 0.54% | 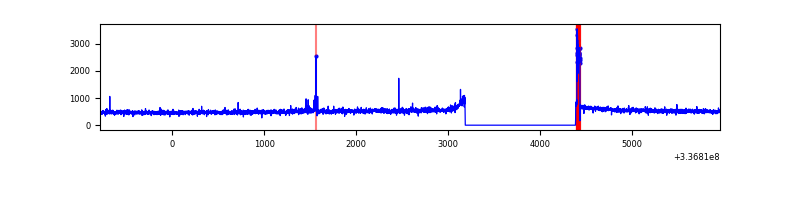 |
| C | 6737 | 5538 | 0 | 0 | 0.00% | 0.00% | 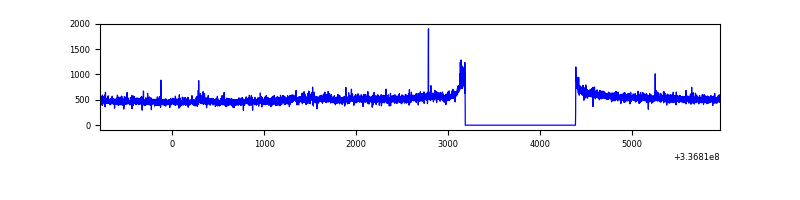 |
| D | 6737 | 5538 | 137 | 137 | 2.03% | 2.47% | 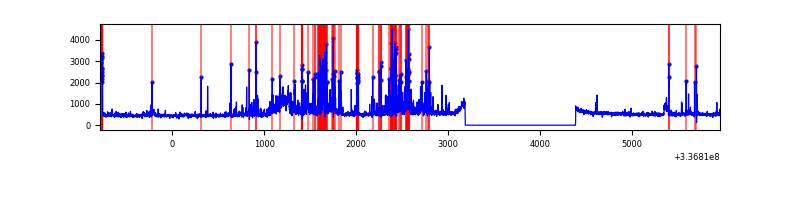 |
Top three noisy pixels from each quadrant. If the there are fewer than three noisy pixels in the level2.evt file, extra rows are filled as -1
| Pixel properties | Quadrant properties | ||||||
|---|---|---|---|---|---|---|---|
| Quadrant | DetID | PixID | Counts | Sigma | Mean | Median | Sigma |
| A | 0 | 13 | 765410 | 5201.75 | 735 | 725 | 147.0 |
| A | 0 | 31 | 8534 | 53.12 | 735 | 725 | 147.0 |
| A | 13 | 254 | 8453 | 52.57 | 735 | 725 | 147.0 |
| B | 10 | 245 | 96780 | 704.64 | 720 | 705 | 136.3 |
| B | 12 | 111 | 15551 | 108.88 | 720 | 705 | 136.3 |
| B | 11 | 111 | 14246 | 99.31 | 720 | 705 | 136.3 |
| C | 14 | 238 | 113104 | 692.29 | 694 | 699 | 162.4 |
| C | 3 | 233 | 31706 | 190.97 | 694 | 699 | 162.4 |
| C | 2 | 16 | 8578 | 48.52 | 694 | 699 | 162.4 |
| D | 7 | 80 | 357342 | 2064.1 | 701 | 682 | 172.8 |
| D | 2 | 250 | 247267 | 1427.06 | 701 | 682 | 172.8 |
| D | 12 | 233 | 208455 | 1202.44 | 701 | 682 | 172.8 |
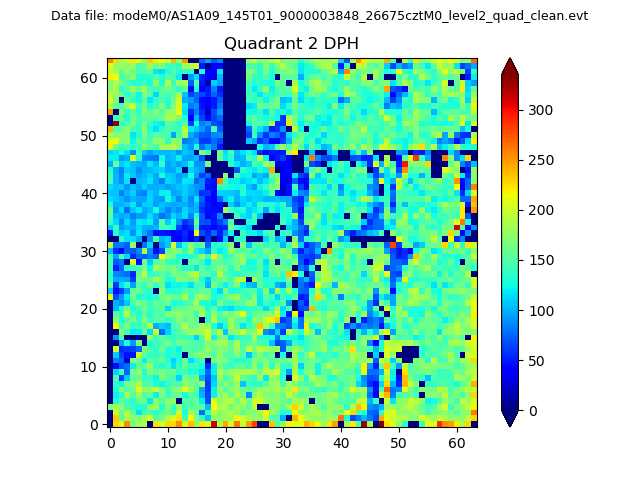
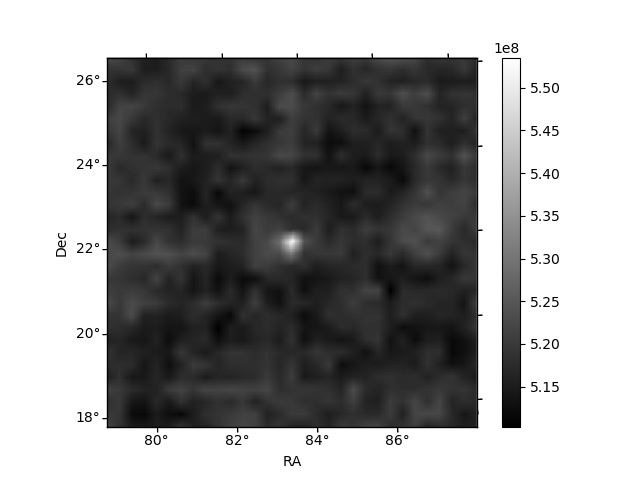
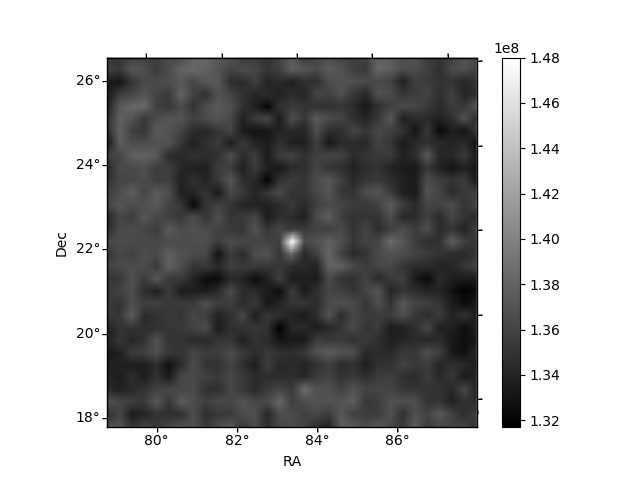
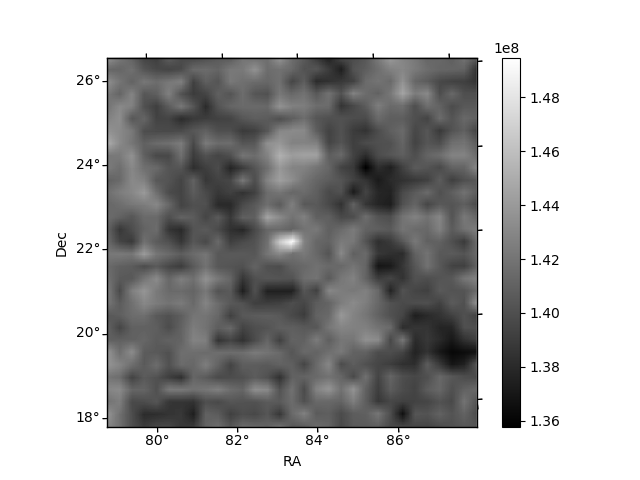
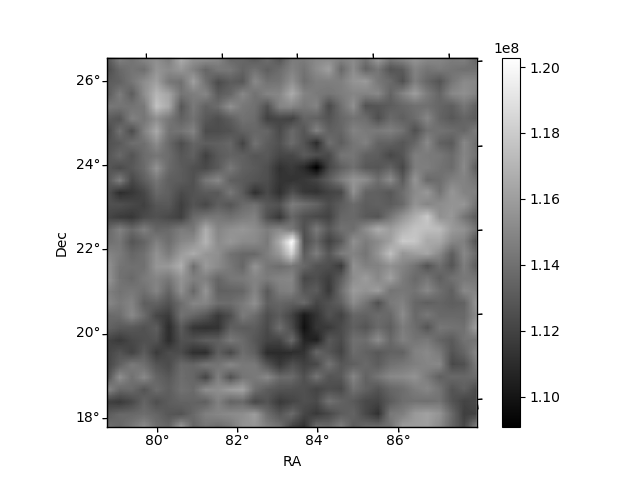
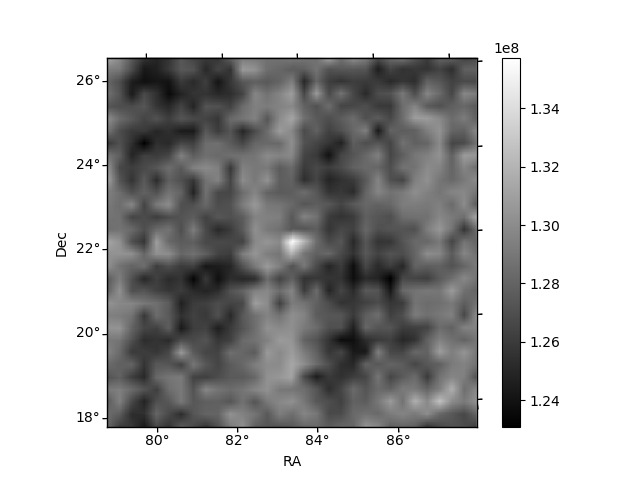
Histogram calculated using DETX and DETY for each event in the final _common_clean file
| Quadrant A | 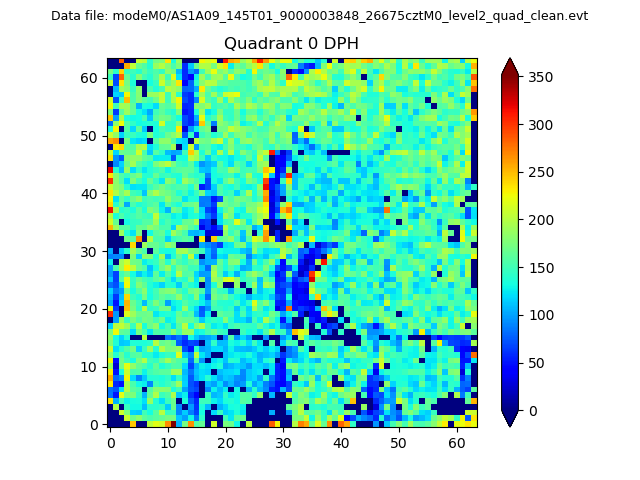 |
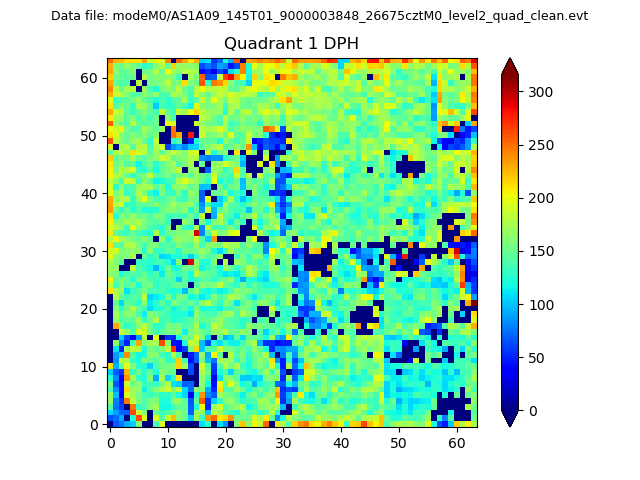 |
Quadrant B |
|---|---|---|---|
| Quadrant D | 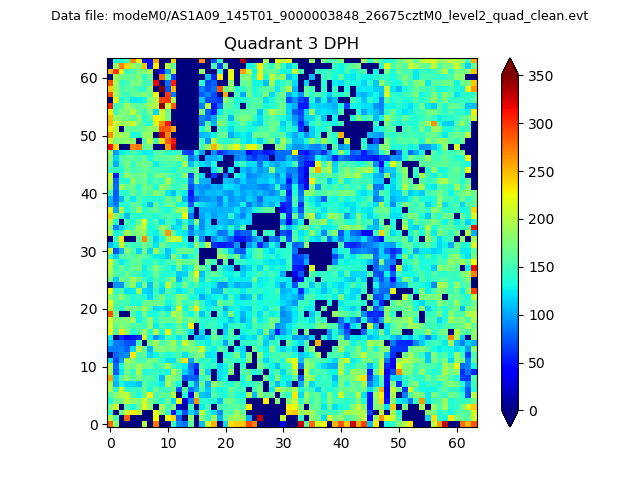 |
 |
Quadrant C |
| Plot type | Count rate plots | Images |
|---|---|---|
| Comparison with Poisson distribution Blue bars denote a histogram of data divided into 1 sec bins. Red curve is a Poisson curve with rate = median count rate of data. |
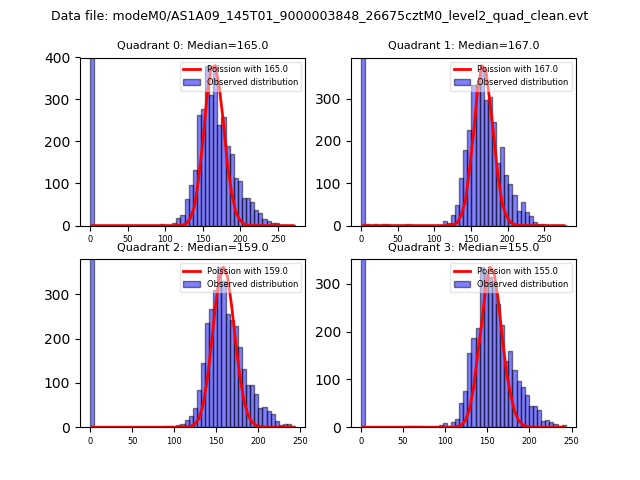 |
 |
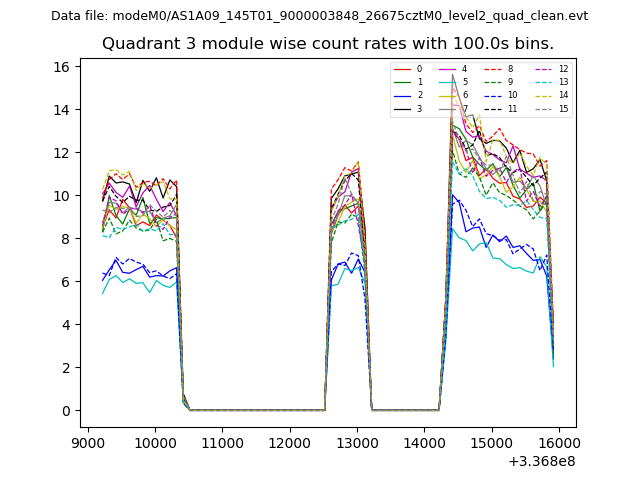
| Quadrant-wise count rates Data is divided into 100 sec bins |
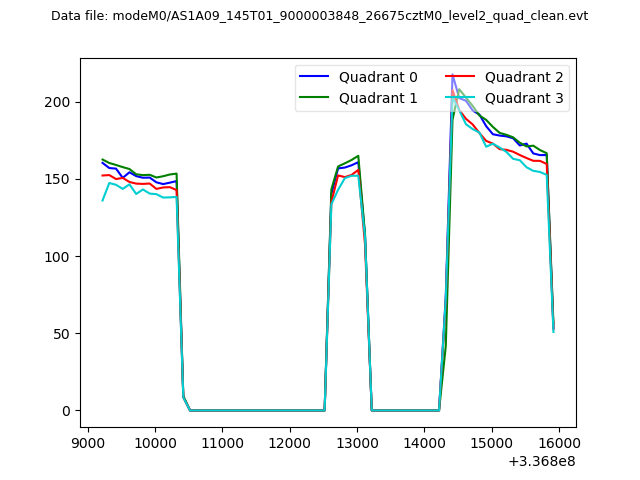 |
|
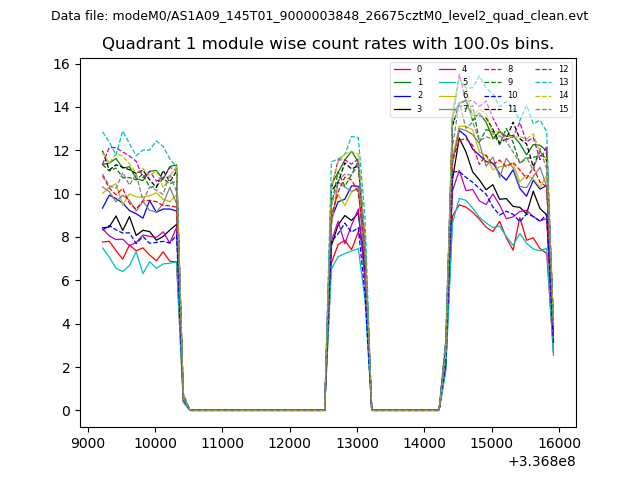
| Module-wise count rates for Quadrant A Data is divided into 100 sec bins |
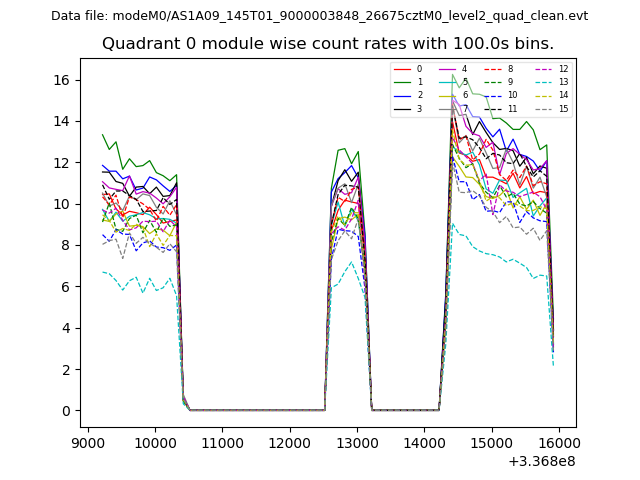 |
 |
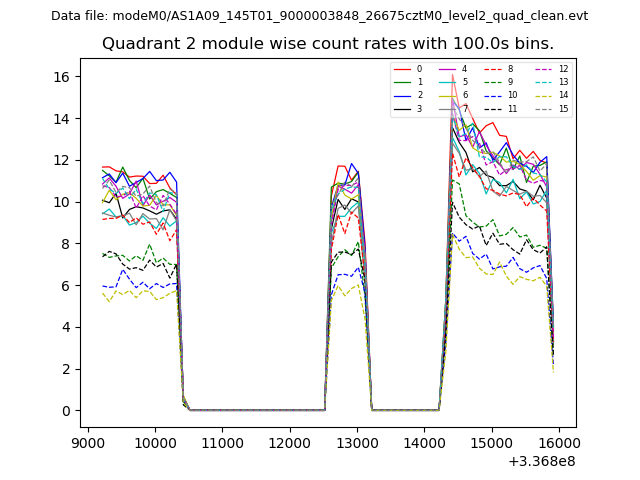
| Module-wise count rates for Quadrant B Data is divided into 100 sec bins |
 |
 |
| Module-wise count rates for Quadrant C Data is divided into 100 sec bins |
 |
 |
| Module-wise count rates for Quadrant D Data is divided into 100 sec bins |
 |
 |
| Parameter | Plot |
|---|---|
| CZT HV Monitor | 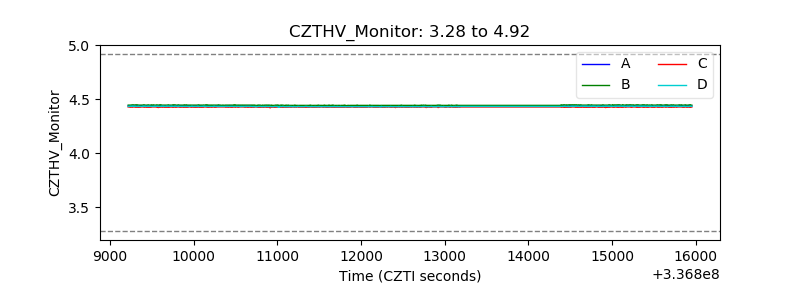 |
| D_VDD | 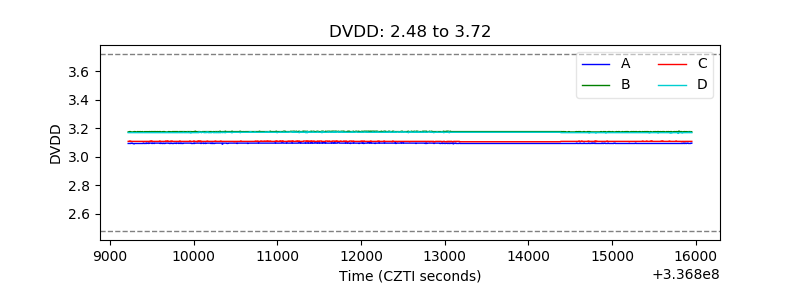 |
| Temperature 1 | 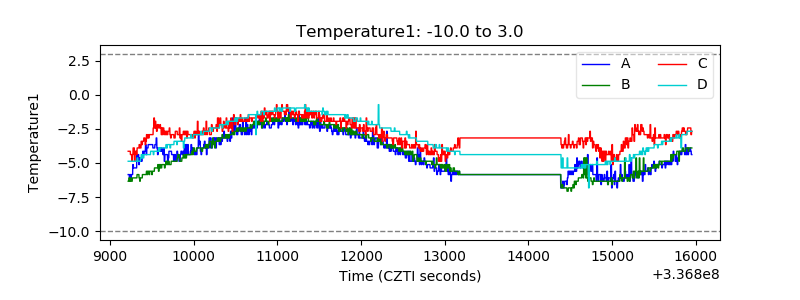 |
| Veto HV Monitor | 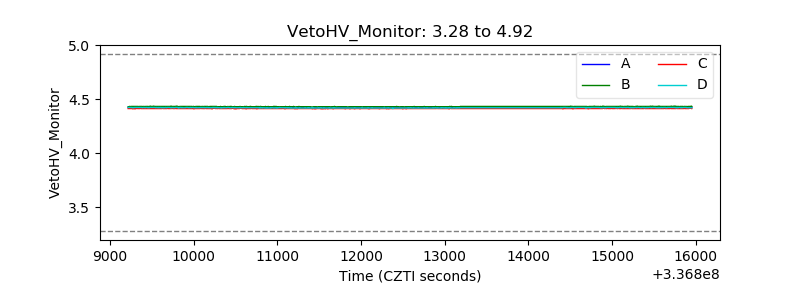 |
| Veto LLD | 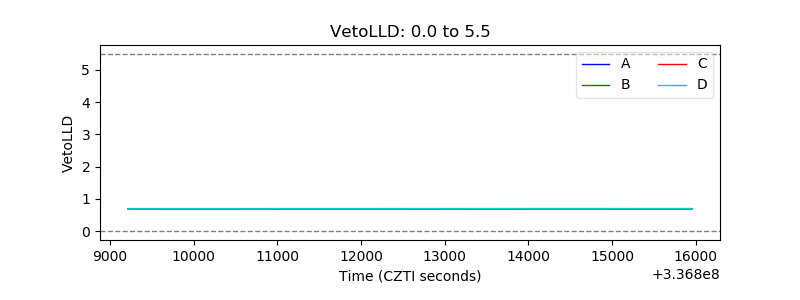 |
| Alpha Counter | 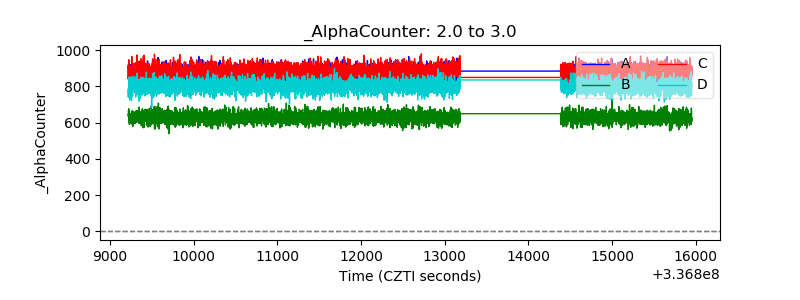 |
| _CPM_Rate | 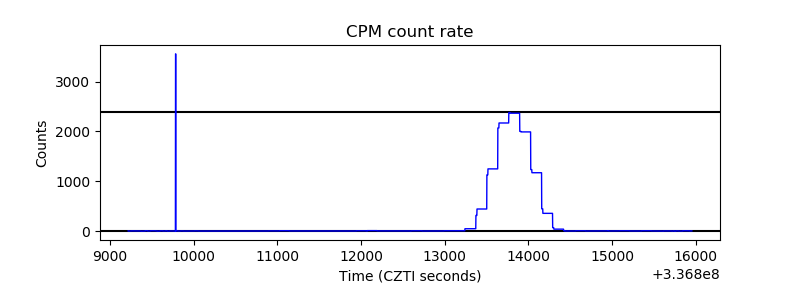 |
| CZT Counter | 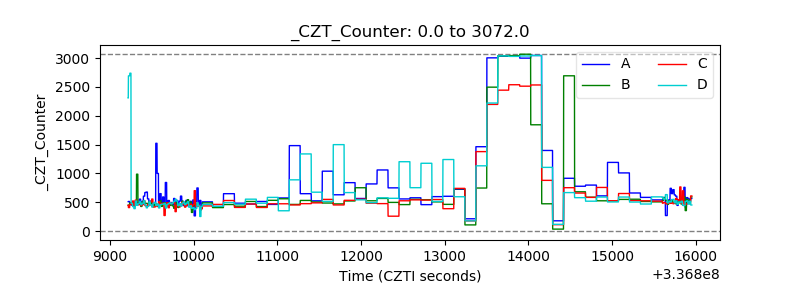 |
| +2.5 Volts monitor |  |
| +5 Volts monitor | 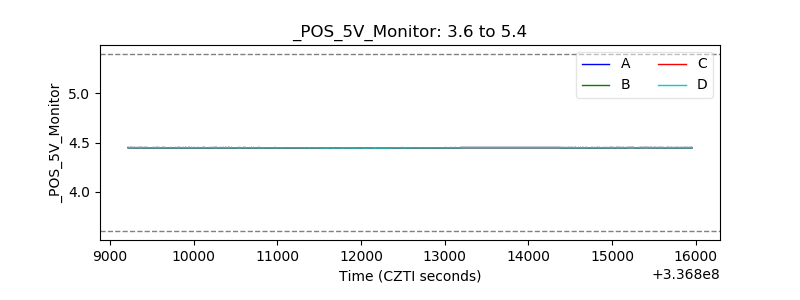 |
| _ROLL_ROT | 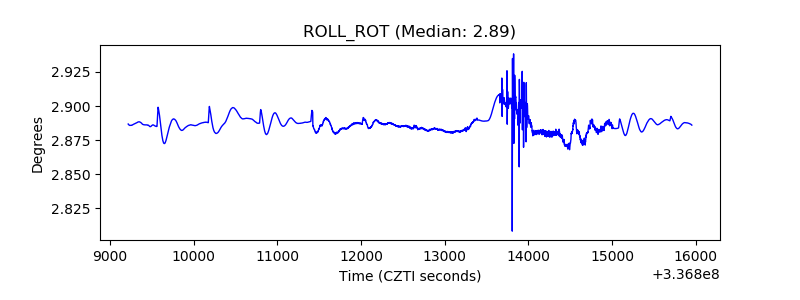 |
| _Roll_DEC | 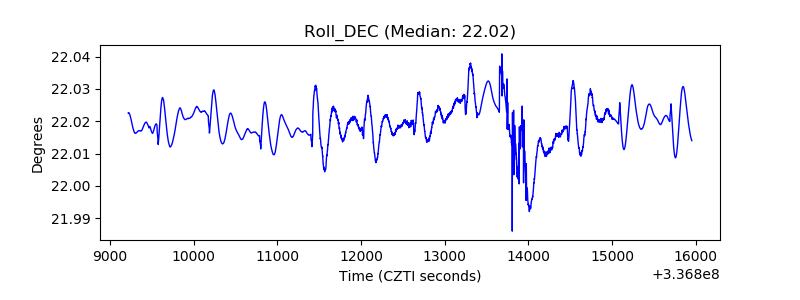 |
| _Roll_RA | 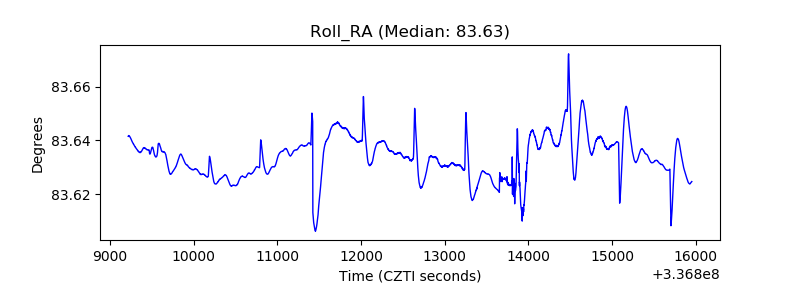 |
| Veto Counter | 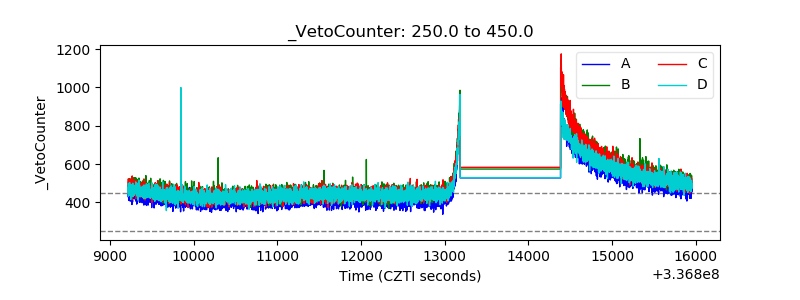 |