| Param | Original file | Final file |
|---|---|---|
| Filename | modeM0/AS1A09_145T01_9000003848_26676cztM0_level2.evt | modeM0/AS1A09_145T01_9000003848_26676cztM0_level2_quad_clean.evt |
| Size (bytes) | 504,074,880 | 89,614,080 |
| Size | 480.7 MB | 85.5 MB |
| Events in quadrant A | 3,678,203 | 598,036 |
| Events in quadrant B | 3,047,849 | 602,187 |
| Events in quadrant C | 3,024,210 | 571,939 |
| Events in quadrant D | 5,137,532 | 551,633 |
| Mode M0 | |||
|---|---|---|---|
| Quadrant | BADHDUFLAG | Total packets | Discarded packets |
| A | 0 | 14788 | 0 |
| B | 0 | 12215 | 0 |
| C | 0 | 12178 | 0 |
| D | 0 | 19060 | 0 |
| Mode M9 | |||
|---|---|---|---|
| Quadrant | BADHDUFLAG | Total packets | Discarded packets |
| A | 0 | 13 | 0 |
| B | 0 | 13 | 0 |
| C | 0 | 13 | 0 |
| D | 0 | 13 | 0 |
| Quadrant | Total seconds | Saturated seconds | Saturation percentage |
|---|---|---|---|
| A | 5580 | 78 | 1.397849% |
| B | 5581 | 83 | 1.487189% |
| C | 5581 | 78 | 1.397599% |
| D | 5581 | 792 | 14.191005% |
Noise dominated data is calculated using 1-second bins in cleaned event files. If a bin has >2000 counts, and if more than 50% of those come from <1% of pixels, then it is considered to be noise-dominated and hence unusable.
| Quadrant | # 1 sec bins | Bins with >0 counts | Bins with >2000 counts | High rate bins dominated by noise | Noise dominated (total time) | Noise dominated (detector-on time) | Marked lightcurve |
|---|---|---|---|---|---|---|---|
| A | 6845 | 5581 | 6 | 6 | 0.09% | 0.11% | 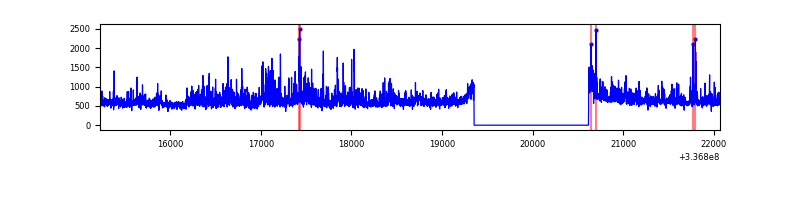 |
| B | 6846 | 5582 | 10 | 10 | 0.15% | 0.18% | 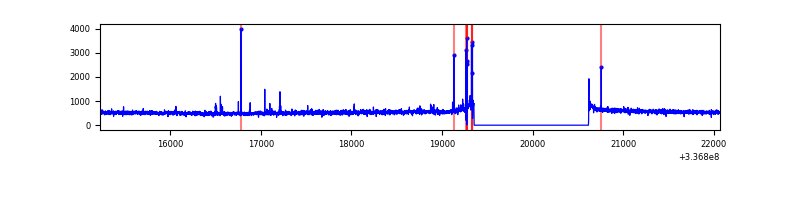 |
| C | 6846 | 5582 | 0 | 0 | 0.00% | 0.00% | 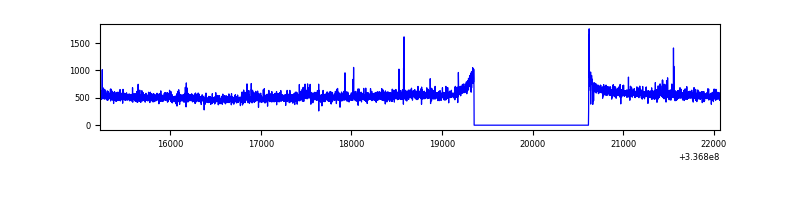 |
| D | 6846 | 5582 | 508 | 508 | 7.42% | 9.10% | 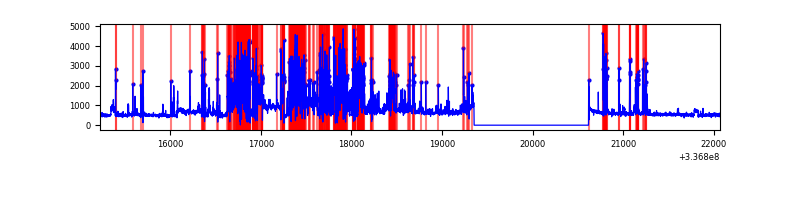 |
Top three noisy pixels from each quadrant. If the there are fewer than three noisy pixels in the level2.evt file, extra rows are filled as -1
| Pixel properties | Quadrant properties | ||||||
|---|---|---|---|---|---|---|---|
| Quadrant | DetID | PixID | Counts | Sigma | Mean | Median | Sigma |
| A | 0 | 13 | 691150 | 4466.71 | 774 | 763 | 154.6 |
| A | 13 | 254 | 8450 | 49.73 | 774 | 763 | 154.6 |
| A | 5 | 203 | 6893 | 39.66 | 774 | 763 | 154.6 |
| B | 10 | 245 | 47069 | 324.49 | 757 | 742 | 142.8 |
| B | 0 | 189 | 17232 | 115.5 | 757 | 742 | 142.8 |
| B | 12 | 111 | 16077 | 107.41 | 757 | 742 | 142.8 |
| C | 14 | 238 | 121692 | 718.23 | 728 | 735 | 168.4 |
| C | 3 | 233 | 47263 | 276.28 | 728 | 735 | 168.4 |
| C | 15 | 208 | 10707 | 59.21 | 728 | 735 | 168.4 |
| D | 7 | 80 | 2092777 | 12320.19 | 693 | 674 | 169.8 |
| D | 2 | 250 | 214329 | 1258.19 | 693 | 674 | 169.8 |
| D | 12 | 233 | 116183 | 680.22 | 693 | 674 | 169.8 |
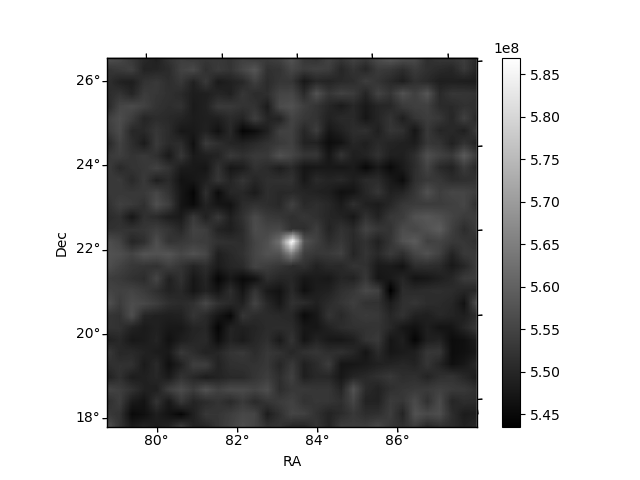
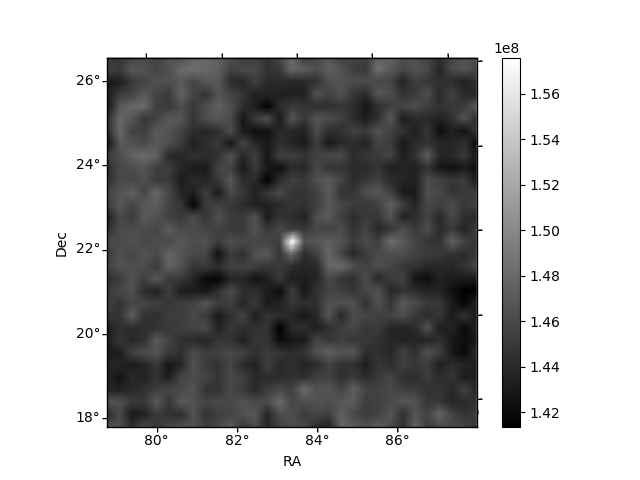
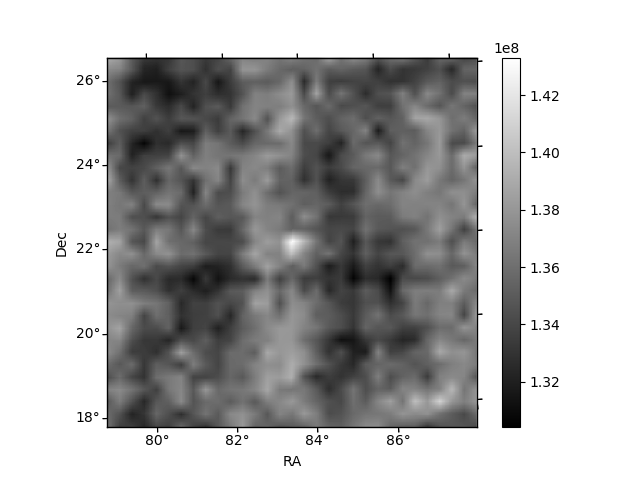
Histogram calculated using DETX and DETY for each event in the final _common_clean file
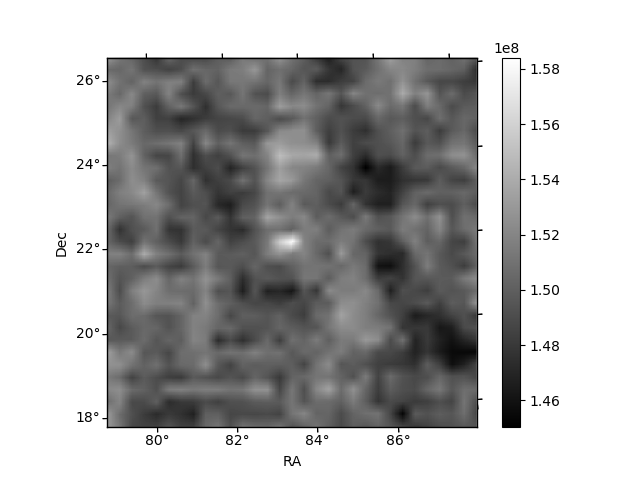
| Quadrant A | 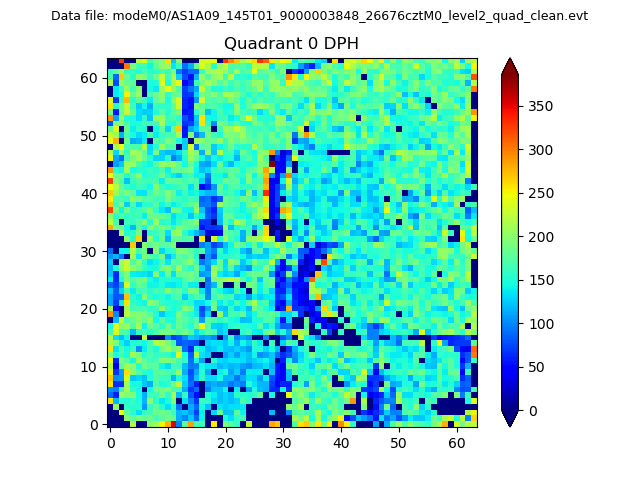 |
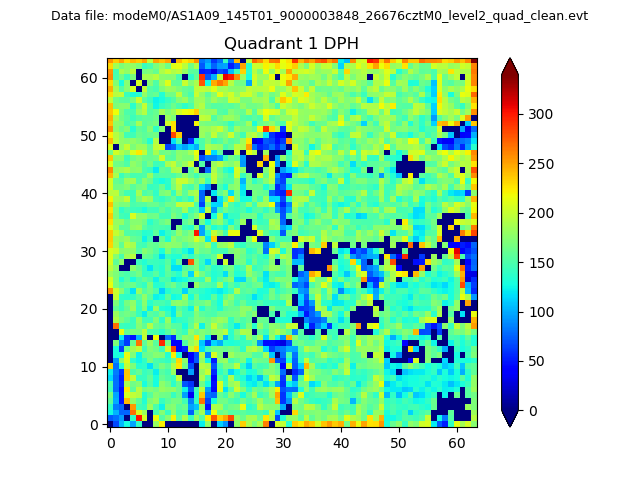 |
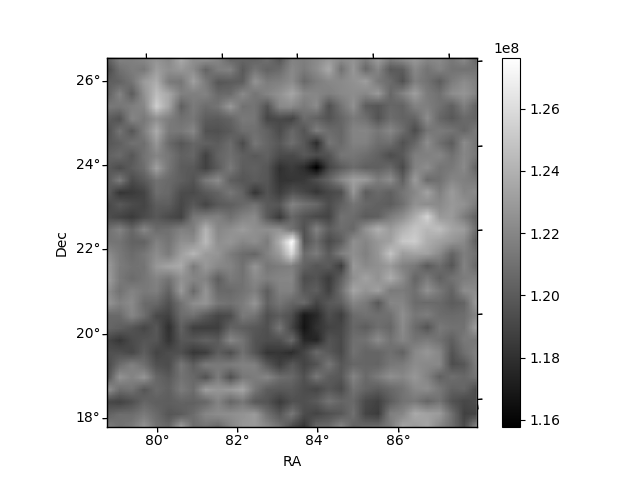
Quadrant B |
|---|---|---|---|
| Quadrant D | 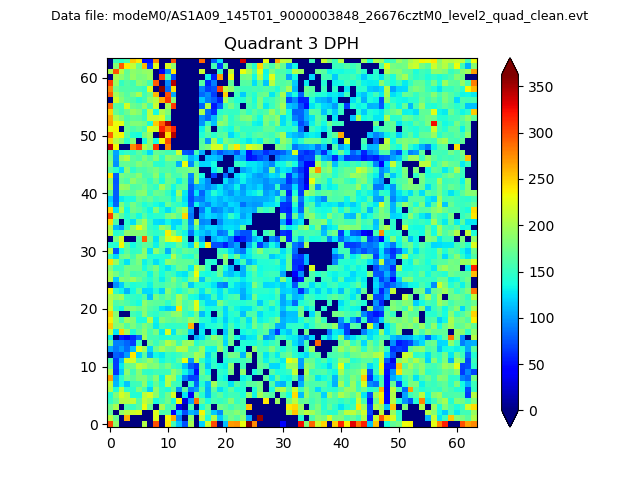 |
 |
Quadrant C |
| Plot type | Count rate plots | Images |
|---|---|---|
| Comparison with Poisson distribution Blue bars denote a histogram of data divided into 1 sec bins. Red curve is a Poisson curve with rate = median count rate of data. |
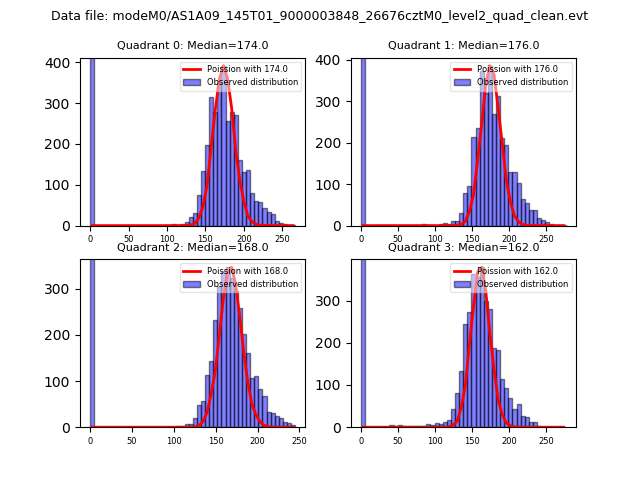 |
 |
| Quadrant-wise count rates Data is divided into 100 sec bins |
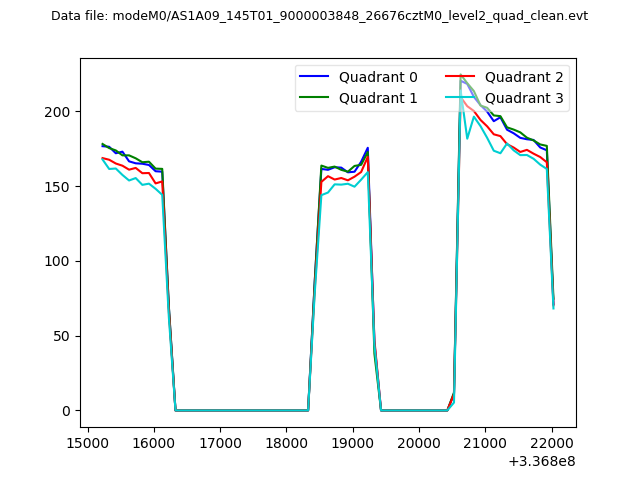 |
|
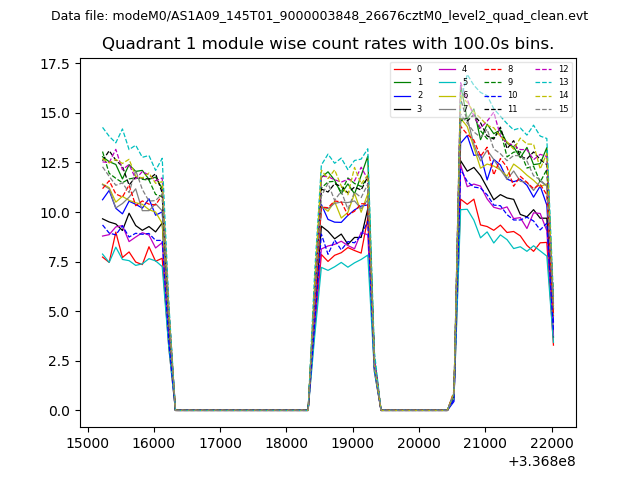
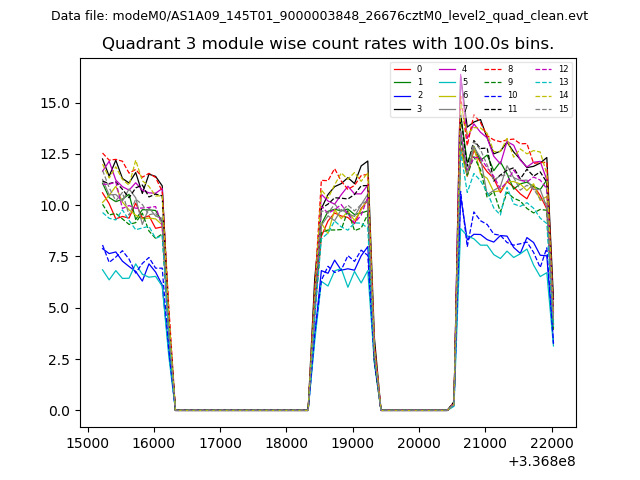
| Module-wise count rates for Quadrant A Data is divided into 100 sec bins |
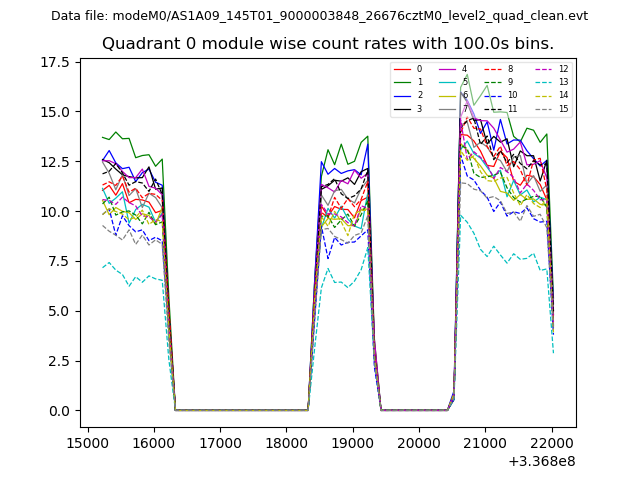 |
 |
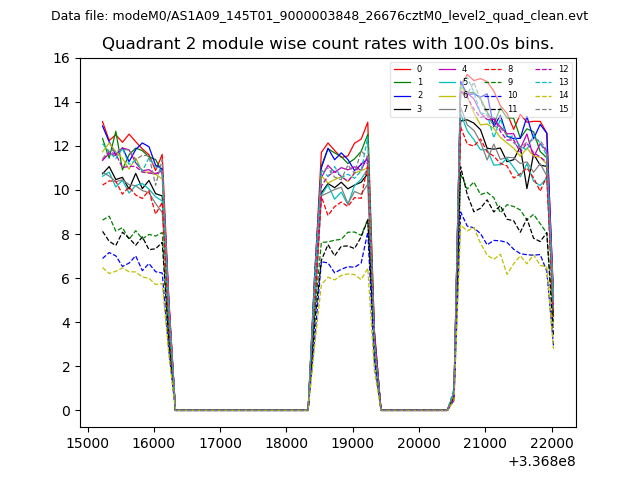
| Module-wise count rates for Quadrant B Data is divided into 100 sec bins |
 |
 |
| Module-wise count rates for Quadrant C Data is divided into 100 sec bins |
 |
 |
| Module-wise count rates for Quadrant D Data is divided into 100 sec bins |
 |
 |
| Parameter | Plot |
|---|---|
| CZT HV Monitor | 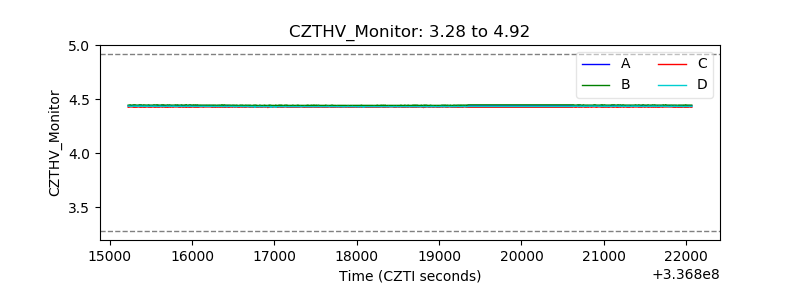 |
| D_VDD | 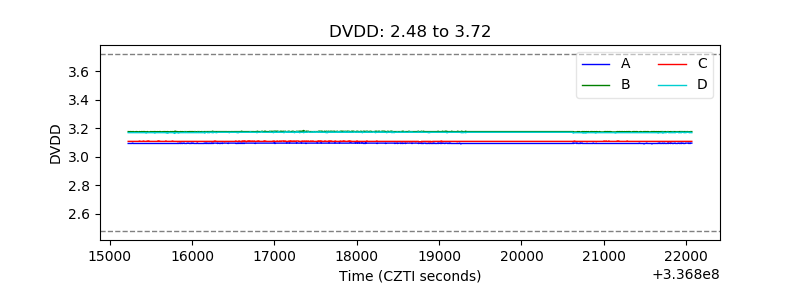 |
| Temperature 1 | 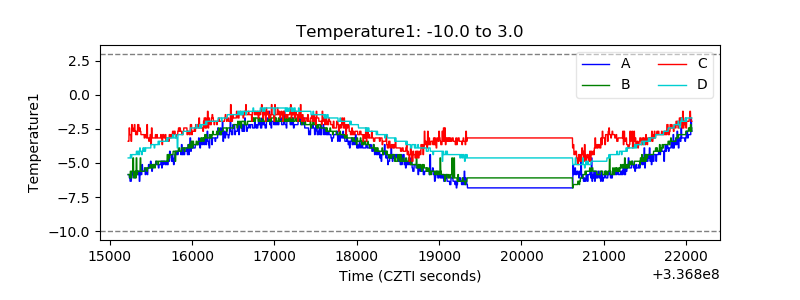 |
| Veto HV Monitor | 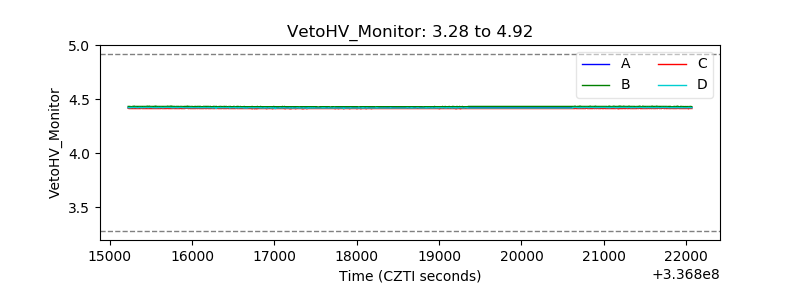 |
| Veto LLD | 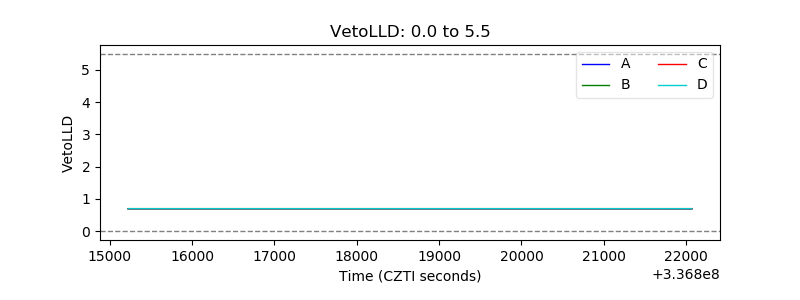 |
| Alpha Counter | 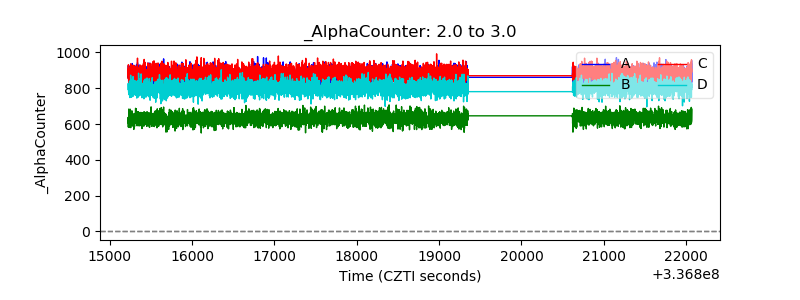 |
| _CPM_Rate | 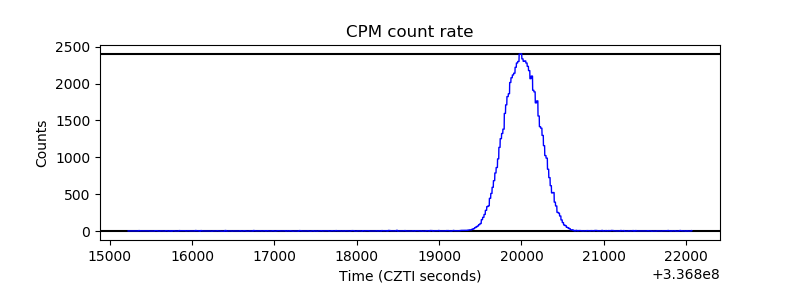 |
| CZT Counter | 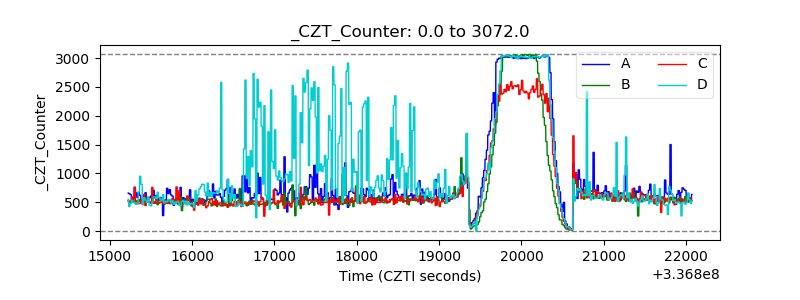 |
| +2.5 Volts monitor |  |
| +5 Volts monitor |  |
| _ROLL_ROT | 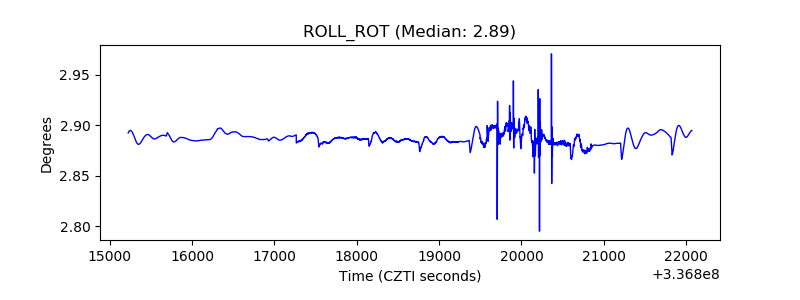 |
| _Roll_DEC | 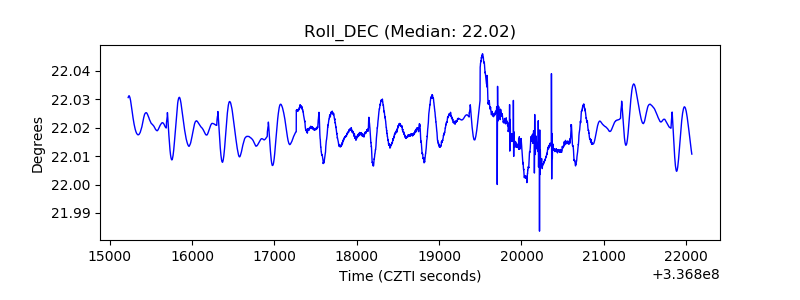 |
| _Roll_RA | 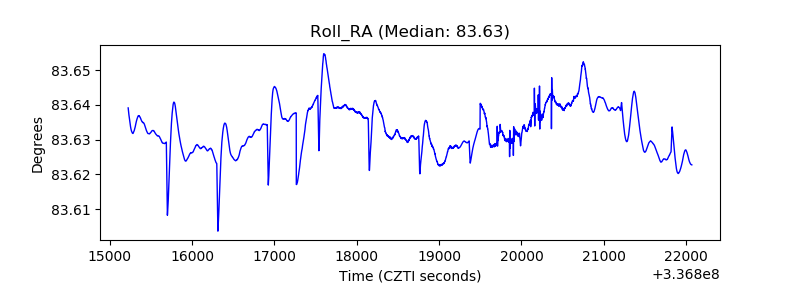 |
| Veto Counter | 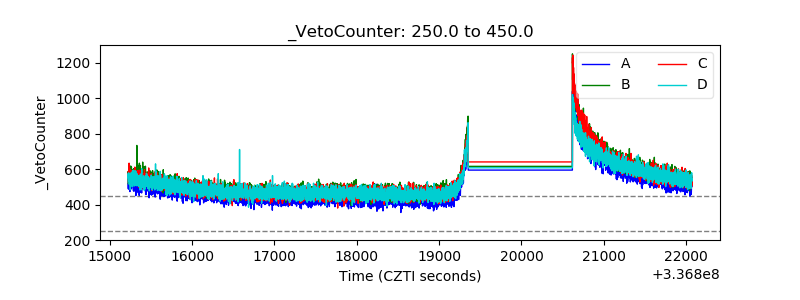 |