| Param | Original file | Final file |
|---|---|---|
| Filename | modeM0/AS1A09_145T01_9000003848_26677cztM0_level2.evt | modeM0/AS1A09_145T01_9000003848_26677cztM0_level2_quad_clean.evt |
| Size (bytes) | 453,692,160 | 85,072,320 |
| Size | 432.7 MB | 81.1 MB |
| Events in quadrant A | 3,558,739 | 561,522 |
| Events in quadrant B | 3,051,488 | 566,820 |
| Events in quadrant C | 3,191,700 | 538,397 |
| Events in quadrant D | 3,564,490 | 524,082 |
| Mode M0 | |||
|---|---|---|---|
| Quadrant | BADHDUFLAG | Total packets | Discarded packets |
| A | 0 | 14334 | 0 |
| B | 0 | 12169 | 0 |
| C | 0 | 12774 | 0 |
| D | 0 | 13832 | 0 |
| Mode M9 | |||
|---|---|---|---|
| Quadrant | BADHDUFLAG | Total packets | Discarded packets |
| A | 0 | 14 | 0 |
| B | 0 | 14 | 0 |
| C | 0 | 14 | 0 |
| D | 0 | 14 | 0 |
| Quadrant | Total seconds | Saturated seconds | Saturation percentage |
|---|---|---|---|
| A | 5514 | 75 | 1.360174% |
| B | 5515 | 54 | 0.979148% |
| C | 5515 | 95 | 1.722575% |
| D | 5514 | 156 | 2.829162% |
Noise dominated data is calculated using 1-second bins in cleaned event files. If a bin has >2000 counts, and if more than 50% of those come from <1% of pixels, then it is considered to be noise-dominated and hence unusable.
| Quadrant | # 1 sec bins | Bins with >0 counts | Bins with >2000 counts | High rate bins dominated by noise | Noise dominated (total time) | Noise dominated (detector-on time) | Marked lightcurve |
|---|---|---|---|---|---|---|---|
| A | 6839 | 5515 | 4 | 4 | 0.06% | 0.07% | 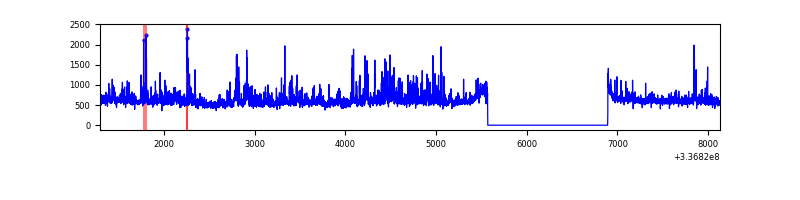 |
| B | 6840 | 5516 | 1 | 1 | 0.01% | 0.02% | 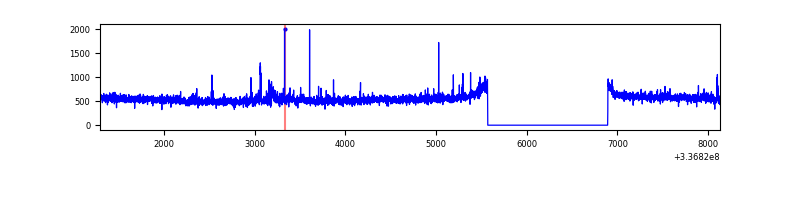 |
| C | 6840 | 5516 | 4 | 4 | 0.06% | 0.07% | 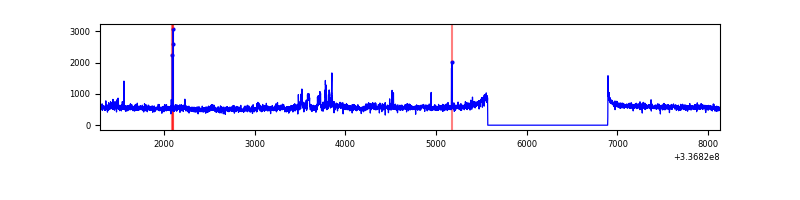 |
| D | 6839 | 5515 | 103 | 103 | 1.51% | 1.87% | 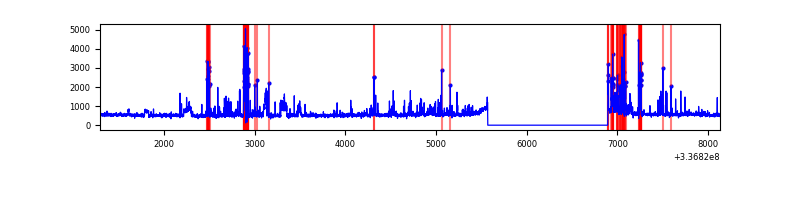 |
Top three noisy pixels from each quadrant. If the there are fewer than three noisy pixels in the level2.evt file, extra rows are filled as -1
| Pixel properties | Quadrant properties | ||||||
|---|---|---|---|---|---|---|---|
| Quadrant | DetID | PixID | Counts | Sigma | Mean | Median | Sigma |
| A | 0 | 13 | 537484 | 3449.65 | 780 | 769 | 155.6 |
| A | 4 | 2 | 17514 | 107.63 | 780 | 769 | 155.6 |
| A | 13 | 254 | 8683 | 50.87 | 780 | 769 | 155.6 |
| B | 0 | 189 | 32316 | 220.56 | 761 | 747 | 143.1 |
| B | 12 | 111 | 16096 | 107.24 | 761 | 747 | 143.1 |
| B | 0 | 245 | 15911 | 105.94 | 761 | 747 | 143.1 |
| C | 3 | 233 | 142201 | 836.99 | 733 | 742 | 169.0 |
| C | 14 | 238 | 119823 | 704.59 | 733 | 742 | 169.0 |
| C | 5 | 37 | 44373 | 258.16 | 733 | 742 | 169.0 |
| D | 7 | 80 | 487773 | 2684.42 | 747 | 728 | 181.4 |
| D | 2 | 250 | 118032 | 646.54 | 747 | 728 | 181.4 |
| D | 1 | 52 | 54879 | 298.46 | 747 | 728 | 181.4 |
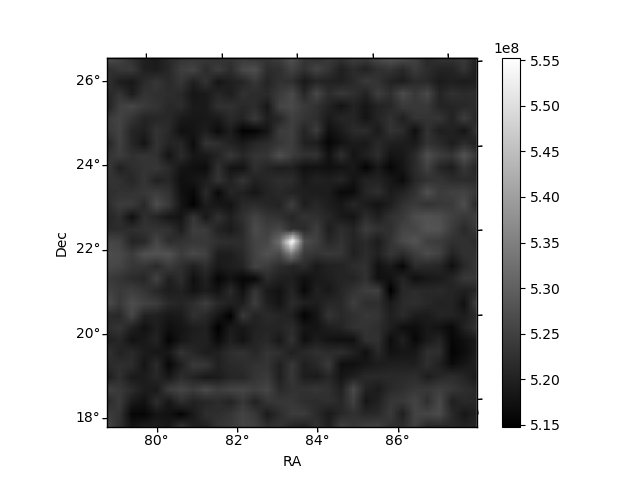
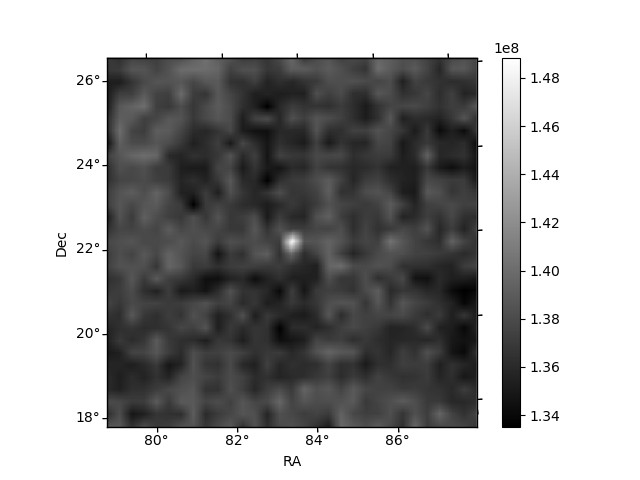
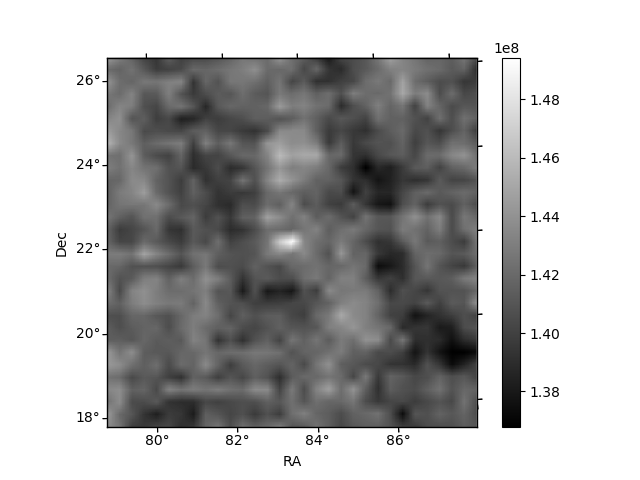
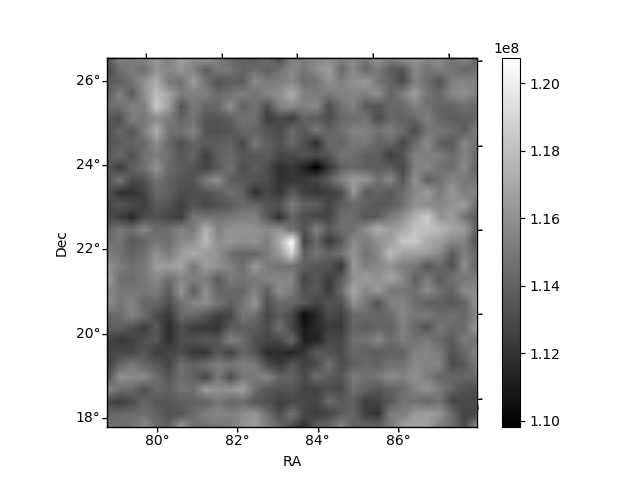
Histogram calculated using DETX and DETY for each event in the final _common_clean file
| Quadrant A | 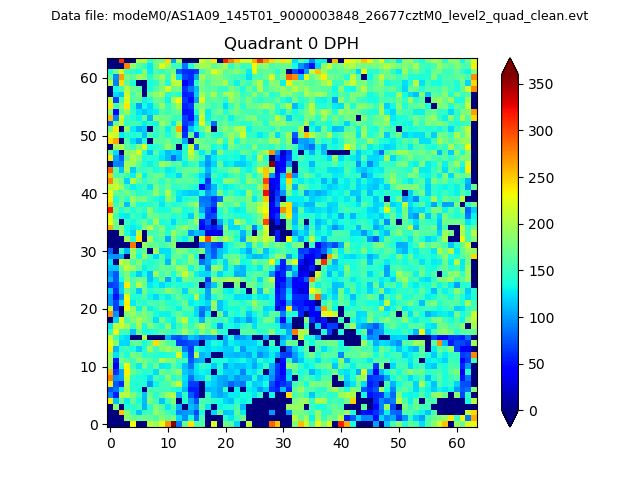 |
 |
Quadrant B |
|---|---|---|---|
| Quadrant D | 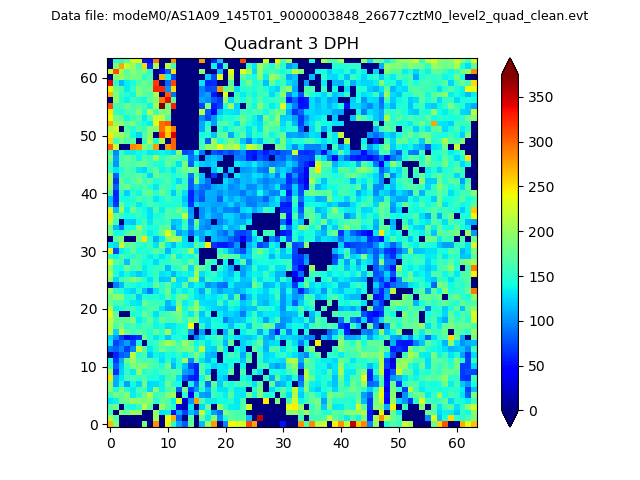 |
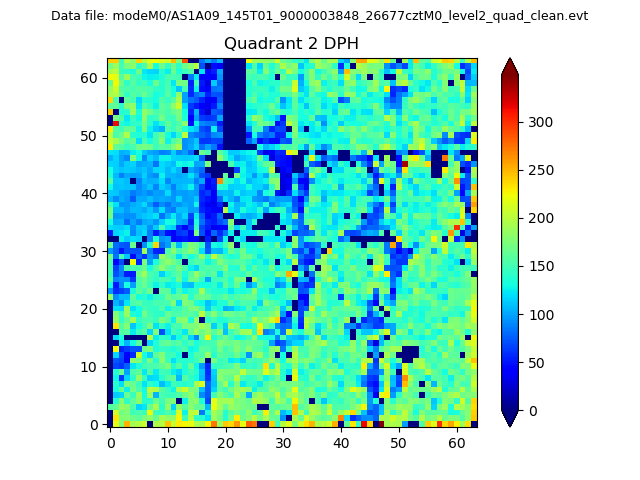 |
Quadrant C |
| Plot type | Count rate plots | Images |
|---|---|---|
| Comparison with Poisson distribution Blue bars denote a histogram of data divided into 1 sec bins. Red curve is a Poisson curve with rate = median count rate of data. |
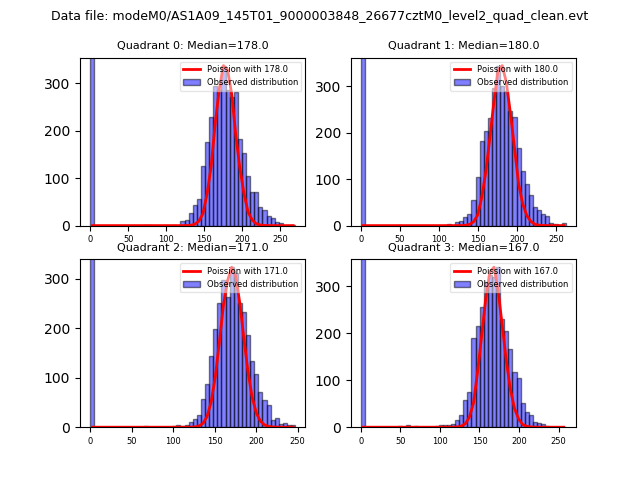 |
 |
| Quadrant-wise count rates Data is divided into 100 sec bins |
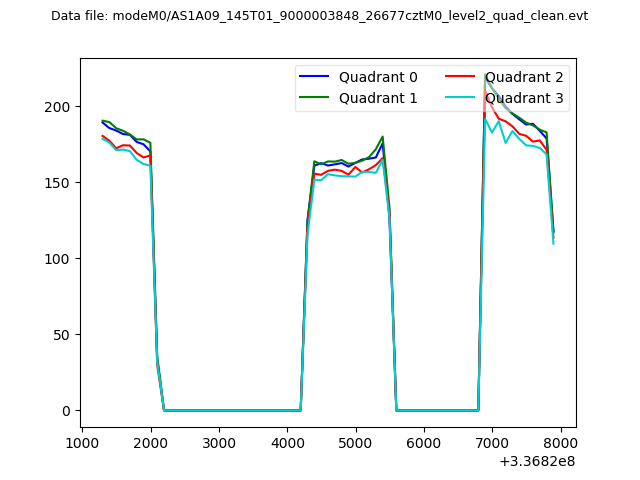 |
|
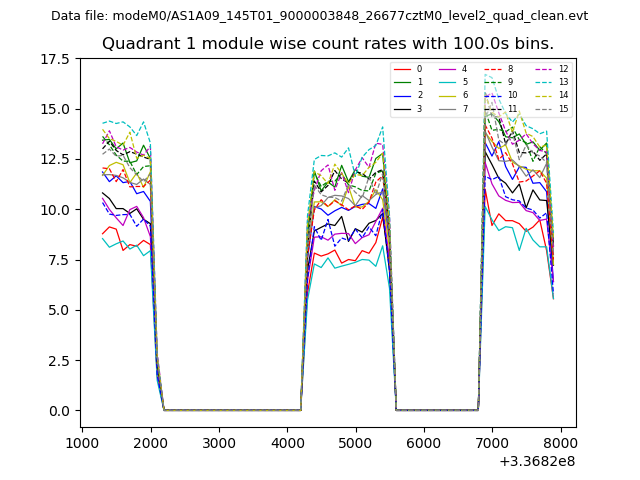
| Module-wise count rates for Quadrant A Data is divided into 100 sec bins |
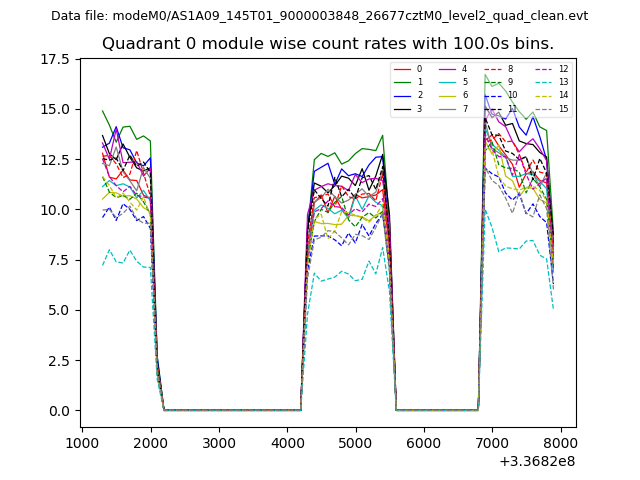 |
 |
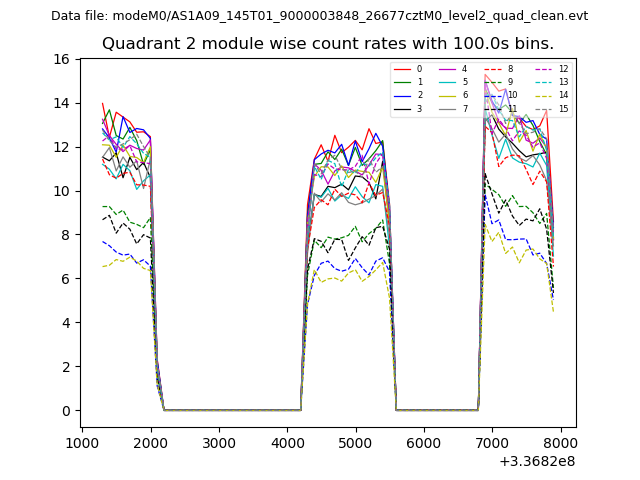
| Module-wise count rates for Quadrant B Data is divided into 100 sec bins |
 |
 |
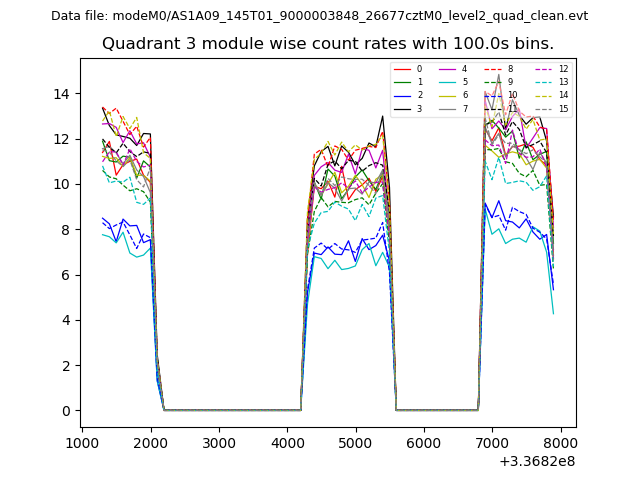
| Module-wise count rates for Quadrant C Data is divided into 100 sec bins |
 |
 |
| Module-wise count rates for Quadrant D Data is divided into 100 sec bins |
 |
 |
| Parameter | Plot |
|---|---|
| CZT HV Monitor | 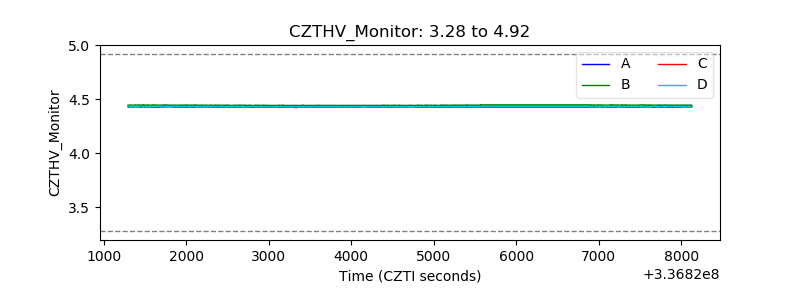 |
| D_VDD | 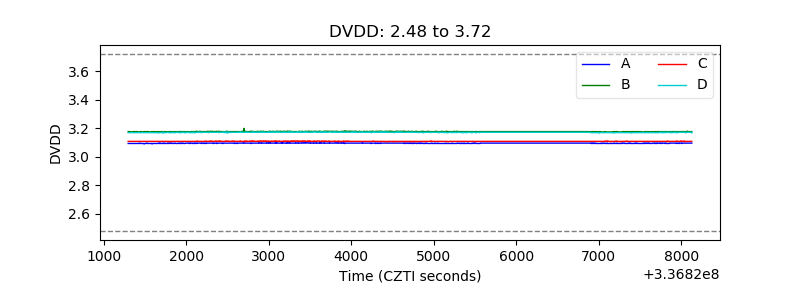 |
| Temperature 1 | 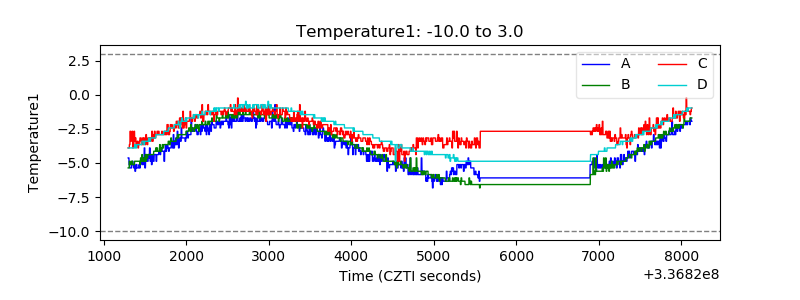 |
| Veto HV Monitor |  |
| Veto LLD | 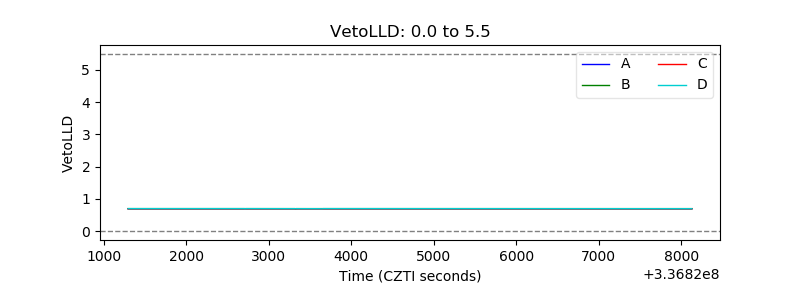 |
| Alpha Counter | 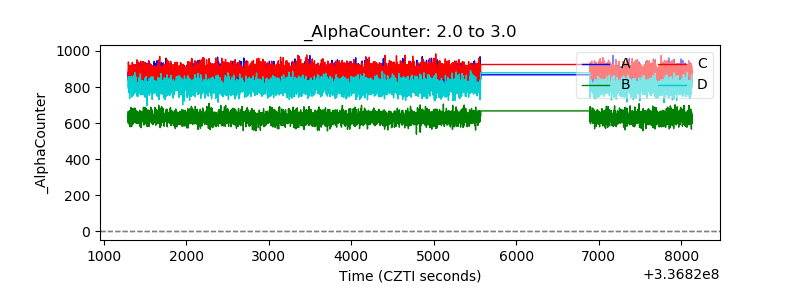 |
| _CPM_Rate | 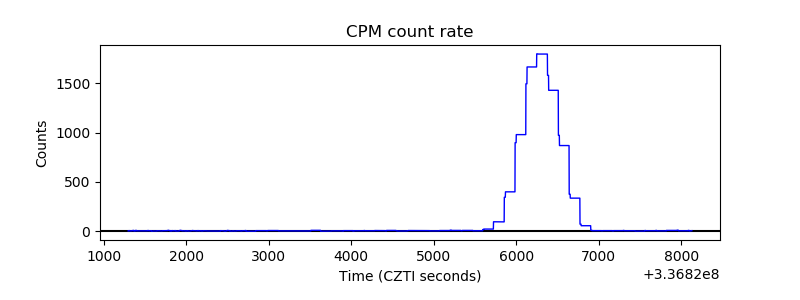 |
| CZT Counter | 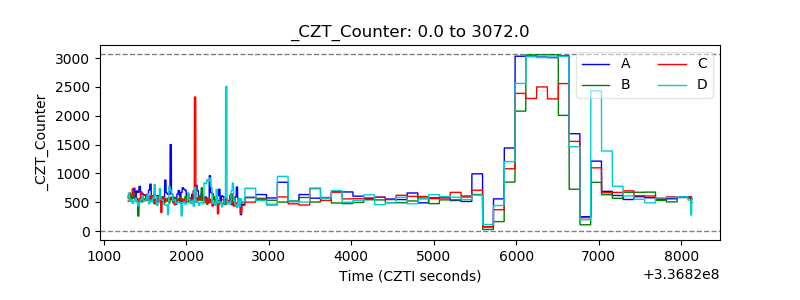 |
| +2.5 Volts monitor |  |
| +5 Volts monitor | 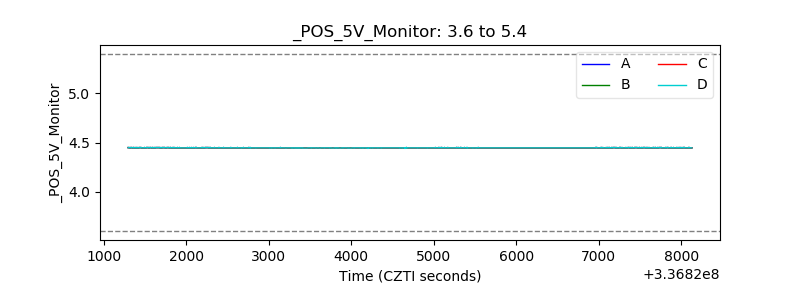 |
| _ROLL_ROT | 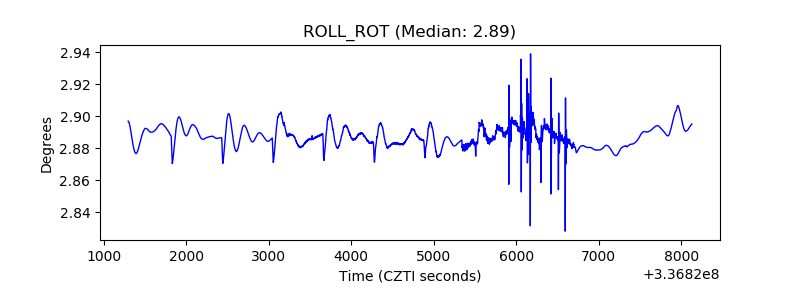 |
| _Roll_DEC | 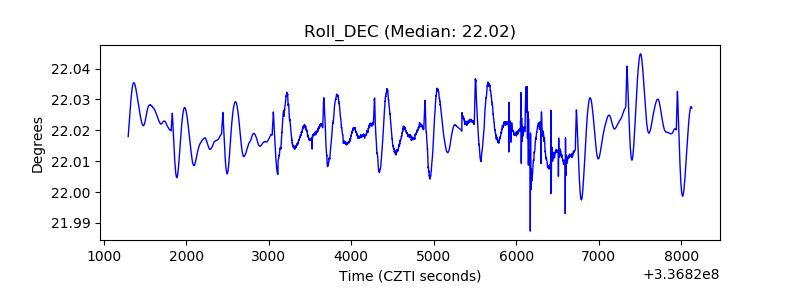 |
| _Roll_RA |  |
| Veto Counter | 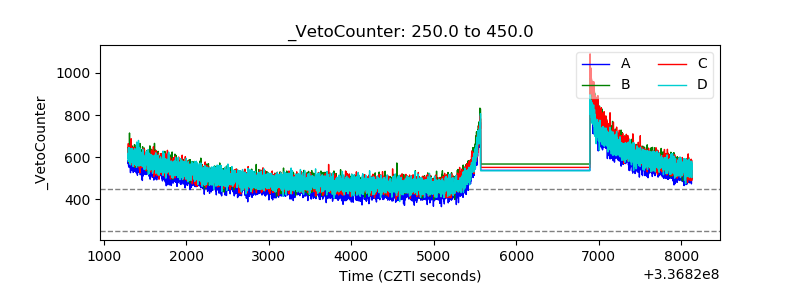 |