| Param | Original file | Final file |
|---|---|---|
| Filename | modeM0/AS1A09_145T01_9000003848_26678cztM0_level2.evt | modeM0/AS1A09_145T01_9000003848_26678cztM0_level2_quad_clean.evt |
| Size (bytes) | 535,337,280 | 93,104,640 |
| Size | 510.5 MB | 88.8 MB |
| Events in quadrant A | 3,593,161 | 612,099 |
| Events in quadrant B | 3,808,141 | 612,912 |
| Events in quadrant C | 3,630,997 | 583,914 |
| Events in quadrant D | 4,755,435 | 573,460 |
| Mode M0 | |||
|---|---|---|---|
| Quadrant | BADHDUFLAG | Total packets | Discarded packets |
| A | 0 | 14469 | 0 |
| B | 0 | 15087 | 0 |
| C | 0 | 14599 | 0 |
| D | 0 | 18002 | 0 |
| Mode M9 | |||
|---|---|---|---|
| Quadrant | BADHDUFLAG | Total packets | Discarded packets |
| A | 0 | 12 | 0 |
| B | 0 | 12 | 0 |
| C | 0 | 12 | 0 |
| D | 0 | 12 | 0 |
| Quadrant | Total seconds | Saturated seconds | Saturation percentage |
|---|---|---|---|
| A | 6259 | 129 | 2.061032% |
| B | 6259 | 198 | 3.163445% |
| C | 6259 | 162 | 2.588273% |
| D | 6259 | 960 | 15.337913% |
Noise dominated data is calculated using 1-second bins in cleaned event files. If a bin has >2000 counts, and if more than 50% of those come from <1% of pixels, then it is considered to be noise-dominated and hence unusable.
| Quadrant | # 1 sec bins | Bins with >0 counts | Bins with >2000 counts | High rate bins dominated by noise | Noise dominated (total time) | Noise dominated (detector-on time) | Marked lightcurve |
|---|---|---|---|---|---|---|---|
| A | 7489 | 6260 | 0 | 0 | 0.00% | 0.00% | 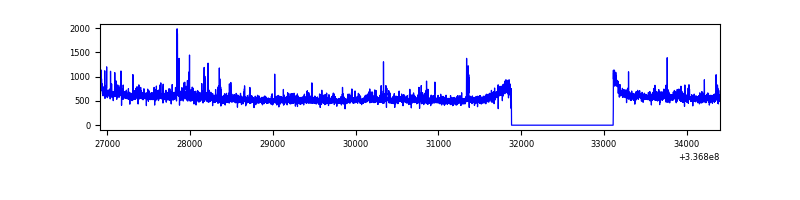 |
| B | 7489 | 6260 | 41 | 41 | 0.55% | 0.65% | 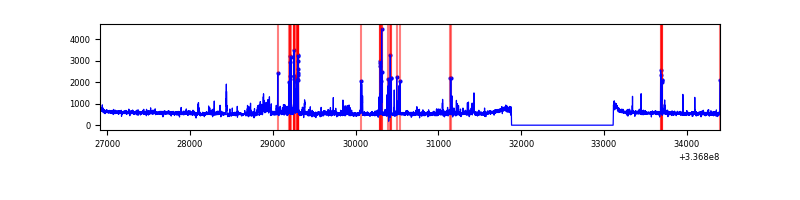 |
| C | 7489 | 6260 | 1 | 1 | 0.01% | 0.02% | 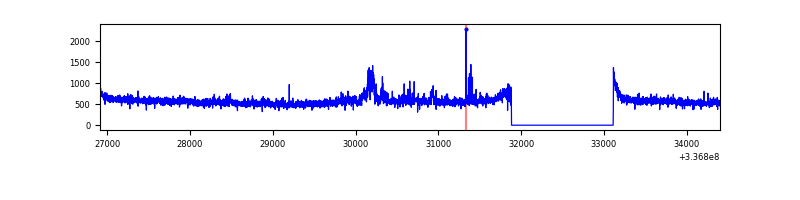 |
| D | 7489 | 6259 | 187 | 187 | 2.50% | 2.99% | 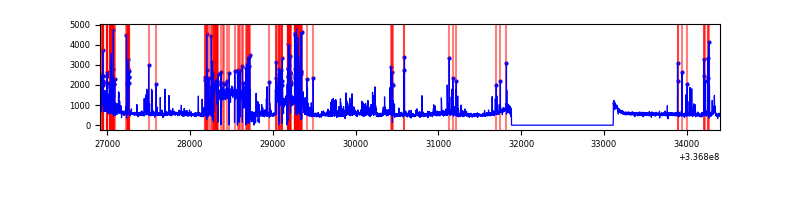 |
Top three noisy pixels from each quadrant. If the there are fewer than three noisy pixels in the level2.evt file, extra rows are filled as -1
| Pixel properties | Quadrant properties | ||||||
|---|---|---|---|---|---|---|---|
| Quadrant | DetID | PixID | Counts | Sigma | Mean | Median | Sigma |
| A | 0 | 13 | 153968 | 865.96 | 889 | 875 | 176.8 |
| A | 4 | 2 | 11972 | 62.77 | 889 | 875 | 176.8 |
| A | 13 | 254 | 11048 | 57.54 | 889 | 875 | 176.8 |
| B | 10 | 246 | 272926 | 1681.24 | 863 | 847 | 161.8 |
| B | 0 | 189 | 125705 | 771.53 | 863 | 847 | 161.8 |
| B | 12 | 111 | 18476 | 108.93 | 863 | 847 | 161.8 |
| C | 3 | 233 | 194986 | 1010.45 | 835 | 842 | 192.1 |
| C | 14 | 238 | 136527 | 706.19 | 835 | 842 | 192.1 |
| C | 5 | 37 | 21821 | 109.19 | 835 | 842 | 192.1 |
| D | 7 | 80 | 1526293 | 8177.58 | 766 | 748 | 186.6 |
| D | 1 | 52 | 119960 | 639.03 | 766 | 748 | 186.6 |
| D | 2 | 250 | 93919 | 499.44 | 766 | 748 | 186.6 |
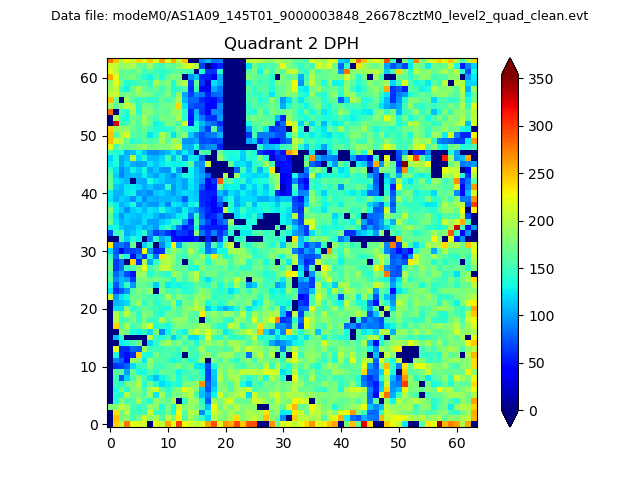
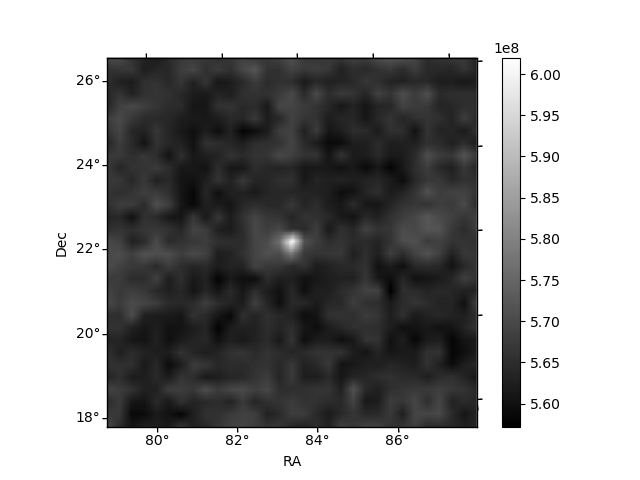
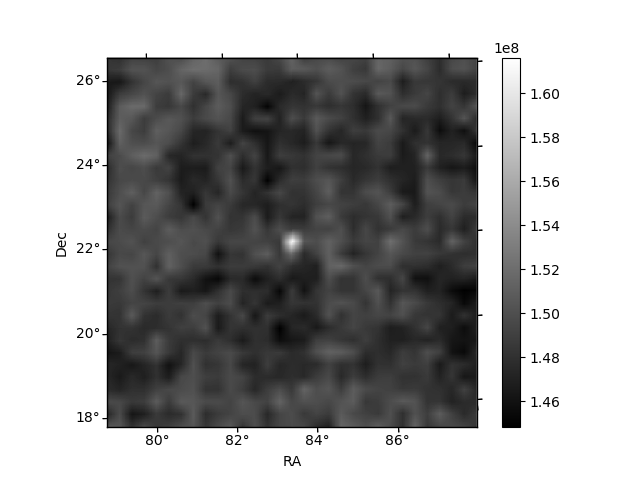
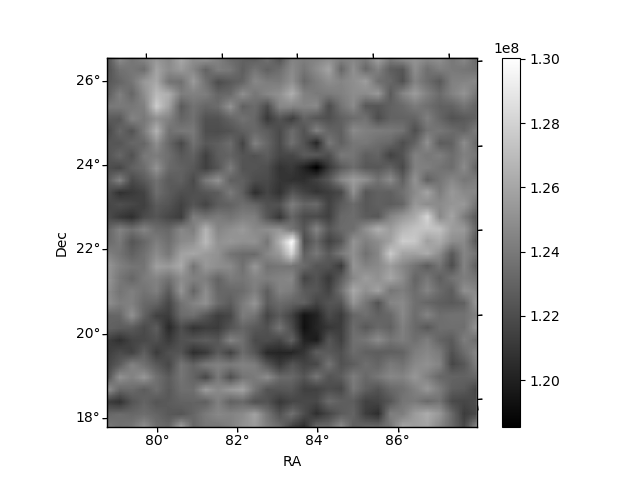
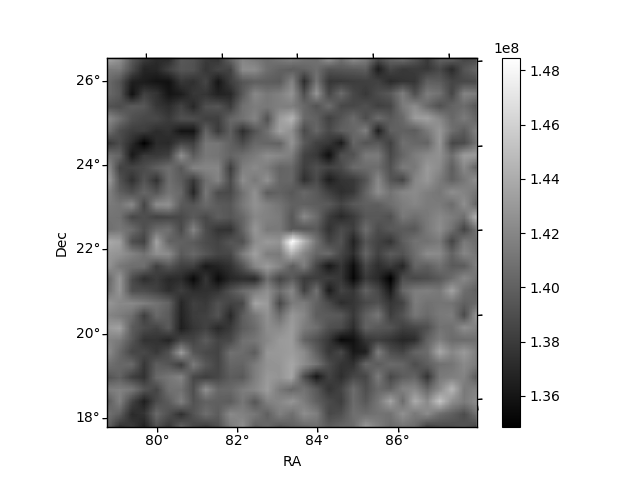
Histogram calculated using DETX and DETY for each event in the final _common_clean file
| Quadrant A | 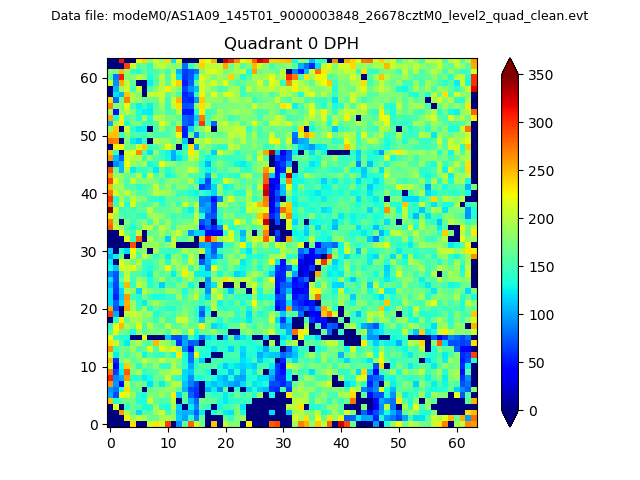 |
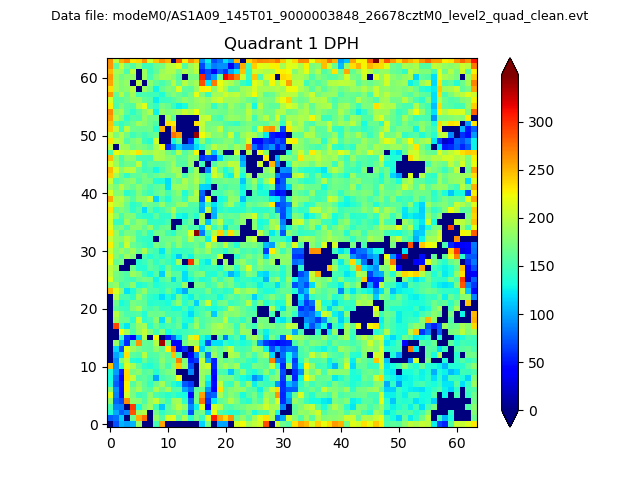 |
Quadrant B |
|---|---|---|---|
| Quadrant D | 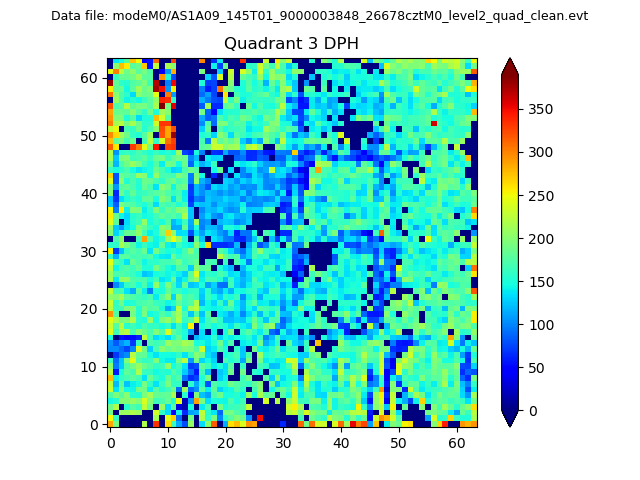 |
 |
Quadrant C |
| Plot type | Count rate plots | Images |
|---|---|---|
| Comparison with Poisson distribution Blue bars denote a histogram of data divided into 1 sec bins. Red curve is a Poisson curve with rate = median count rate of data. |
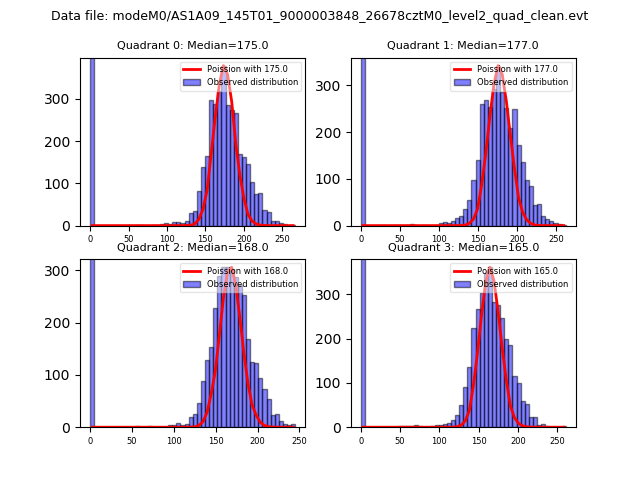 |
 |
| Quadrant-wise count rates Data is divided into 100 sec bins |
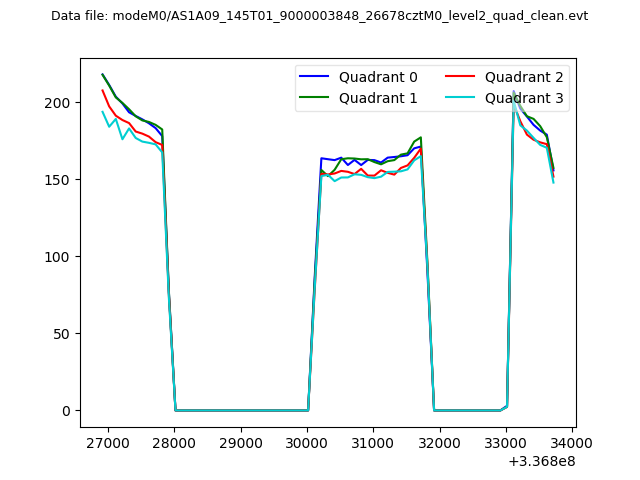 |
|
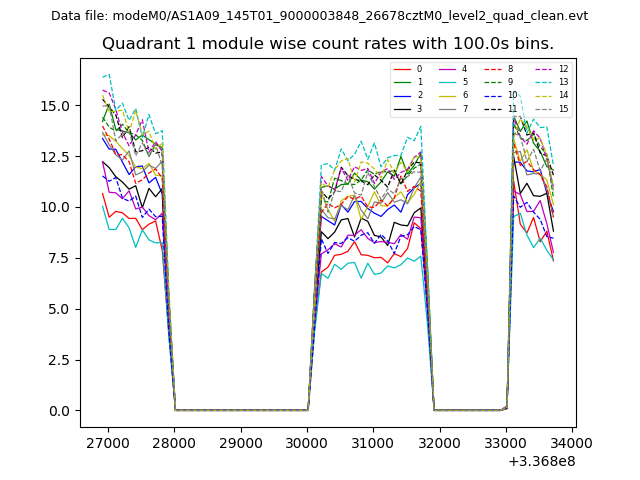
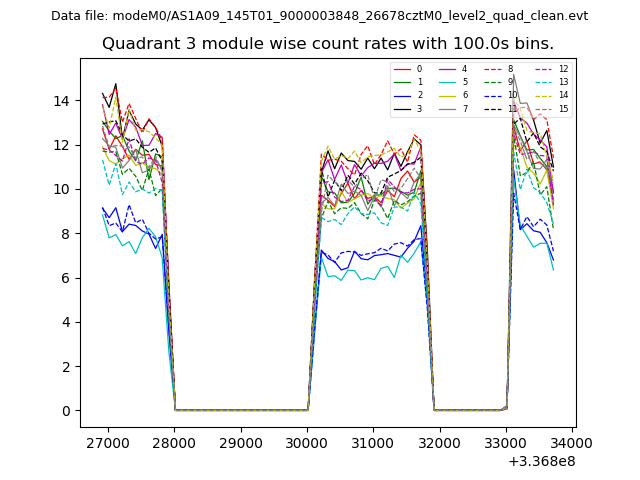
| Module-wise count rates for Quadrant A Data is divided into 100 sec bins |
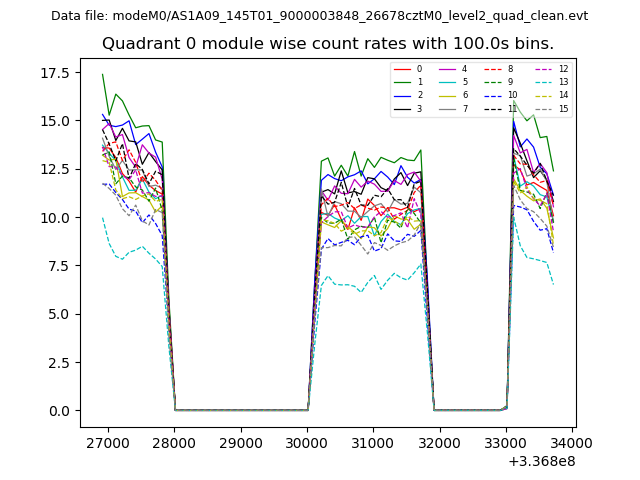 |
 |
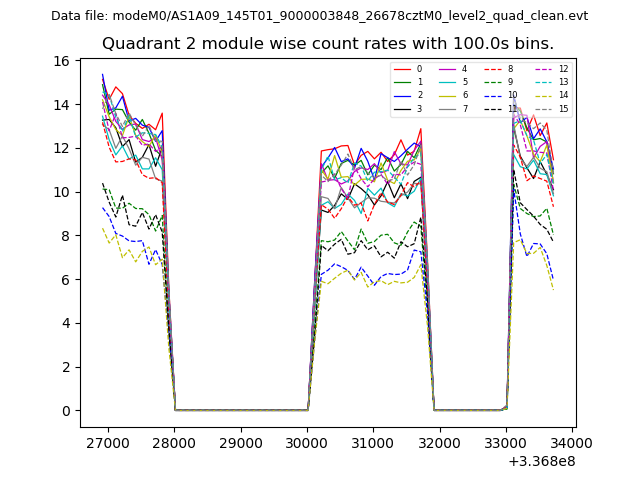
| Module-wise count rates for Quadrant B Data is divided into 100 sec bins |
 |
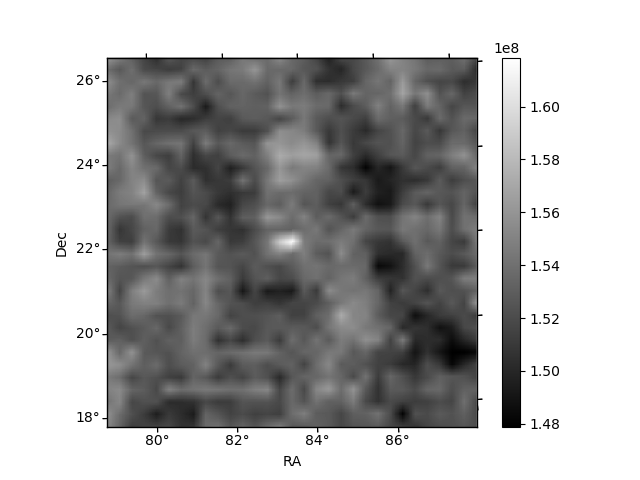 |
| Module-wise count rates for Quadrant C Data is divided into 100 sec bins |
 |
 |
| Module-wise count rates for Quadrant D Data is divided into 100 sec bins |
 |
 |
| Parameter | Plot |
|---|---|
| CZT HV Monitor | 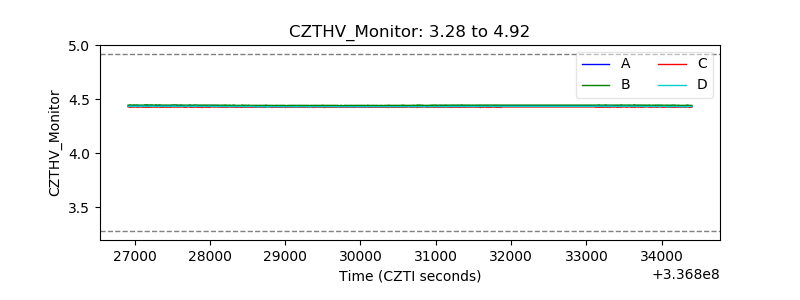 |
| D_VDD | 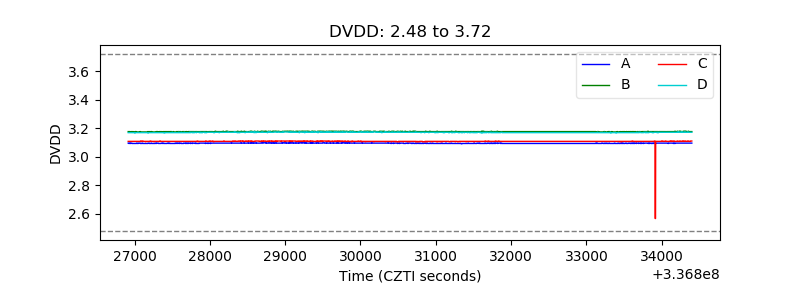 |
| Temperature 1 | 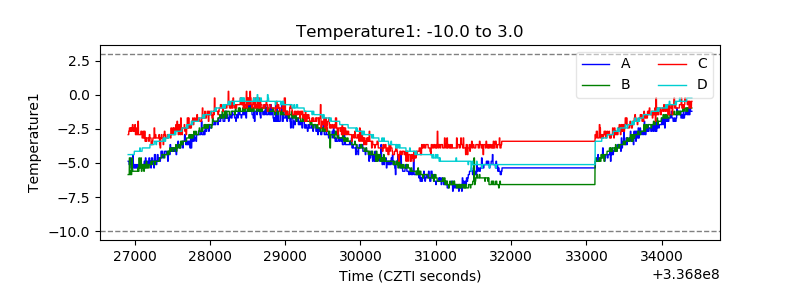 |
| Veto HV Monitor | 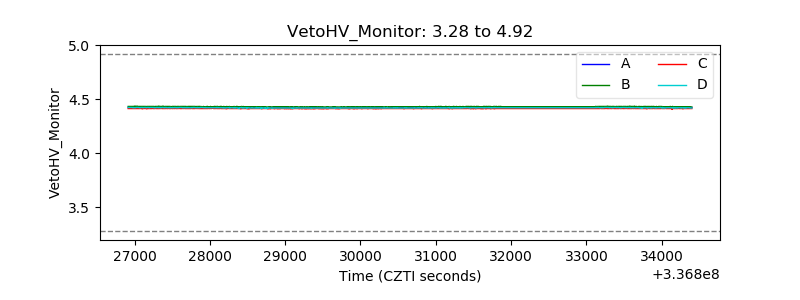 |
| Veto LLD | 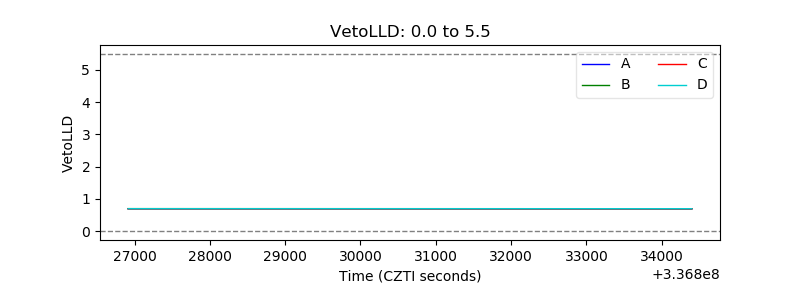 |
| Alpha Counter | 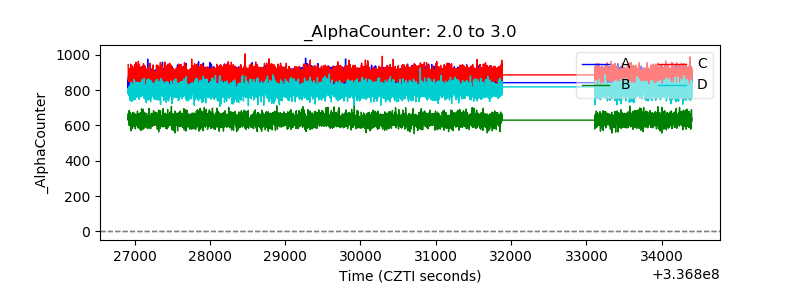 |
| _CPM_Rate | 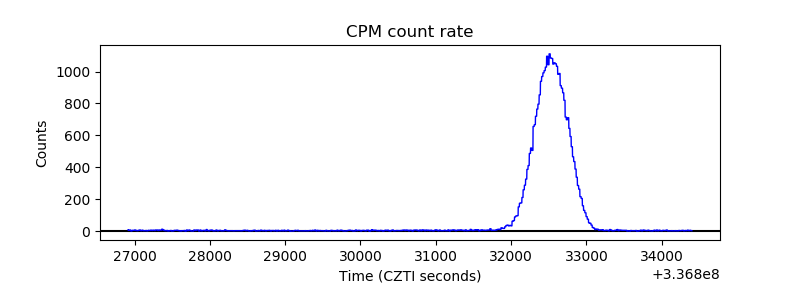 |
| CZT Counter | 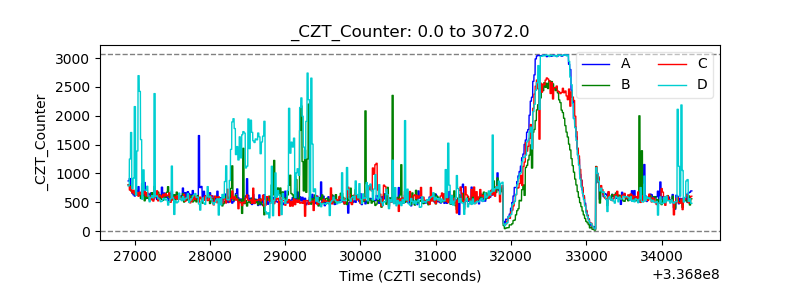 |
| +2.5 Volts monitor | 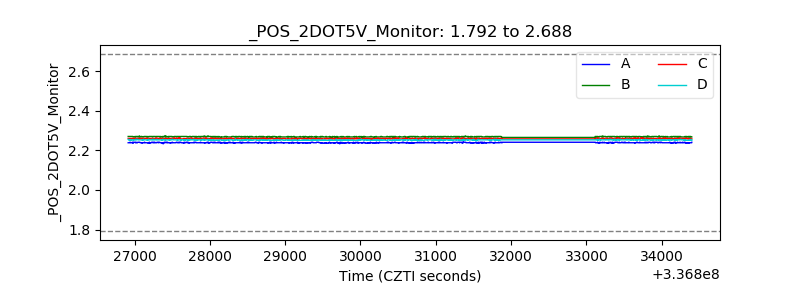 |
| +5 Volts monitor | 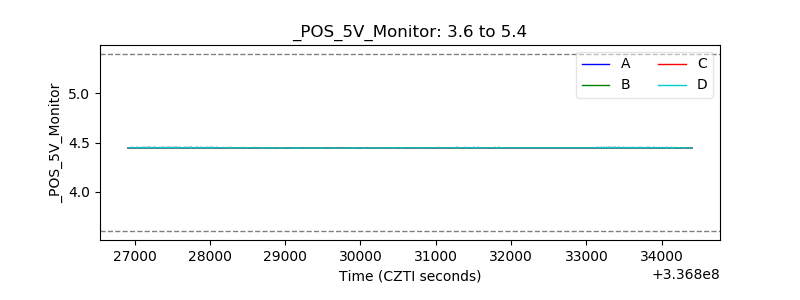 |
| _ROLL_ROT | 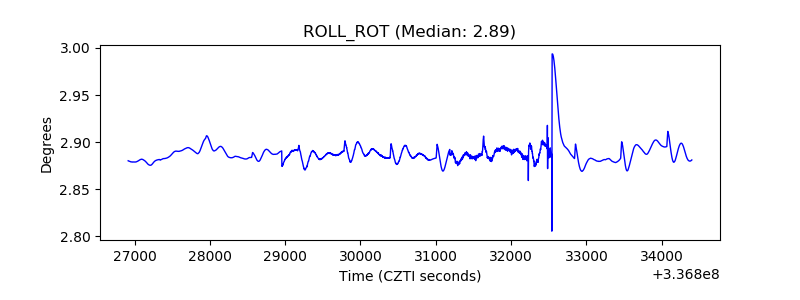 |
| _Roll_DEC | 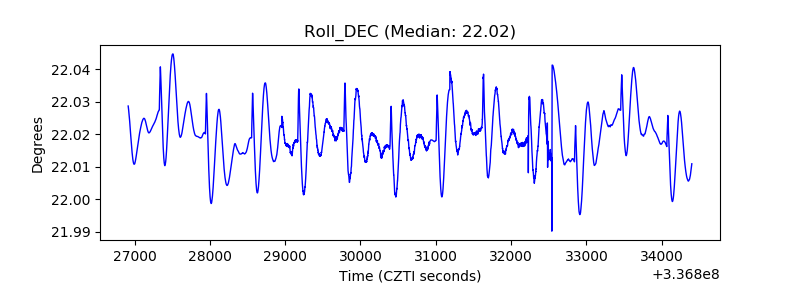 |
| _Roll_RA | 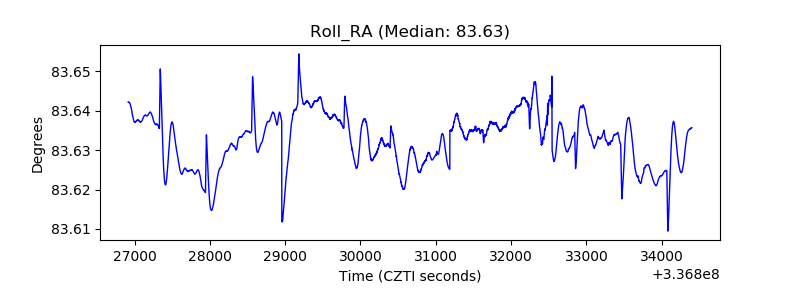 |
| Veto Counter | 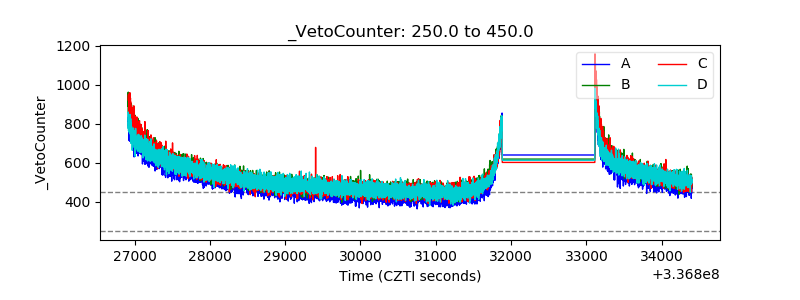 |