| Param | Original file | Final file |
|---|---|---|
| Filename | modeM0/AS1A09_145T01_9000003848_26679cztM0_level2.evt | modeM0/AS1A09_145T01_9000003848_26679cztM0_level2_quad_clean.evt |
| Size (bytes) | 548,360,640 | 78,955,200 |
| Size | 523.0 MB | 75.3 MB |
| Events in quadrant A | 3,514,639 | 498,474 |
| Events in quadrant B | 3,733,226 | 498,532 |
| Events in quadrant C | 3,502,443 | 475,610 |
| Events in quadrant D | 5,413,573 | 462,025 |
| Mode M0 | |||
|---|---|---|---|
| Quadrant | BADHDUFLAG | Total packets | Discarded packets |
| A | 0 | 14136 | 0 |
| B | 0 | 14790 | 0 |
| C | 0 | 13989 | 0 |
| D | 0 | 20038 | 0 |
| Mode M9 | |||
|---|---|---|---|
| Quadrant | BADHDUFLAG | Total packets | Discarded packets |
| A | 0 | 12 | 0 |
| B | 0 | 12 | 0 |
| C | 0 | 12 | 0 |
| D | 0 | 12 | 0 |
| Quadrant | Total seconds | Saturated seconds | Saturation percentage |
|---|---|---|---|
| A | 6549 | 65 | 0.992518% |
| B | 6550 | 94 | 1.435115% |
| C | 6550 | 108 | 1.648855% |
| D | 6550 | 603 | 9.206107% |
Noise dominated data is calculated using 1-second bins in cleaned event files. If a bin has >2000 counts, and if more than 50% of those come from <1% of pixels, then it is considered to be noise-dominated and hence unusable.
| Quadrant | # 1 sec bins | Bins with >0 counts | Bins with >2000 counts | High rate bins dominated by noise | Noise dominated (total time) | Noise dominated (detector-on time) | Marked lightcurve |
|---|---|---|---|---|---|---|---|
| A | 7664 | 6550 | 3 | 3 | 0.04% | 0.05% | 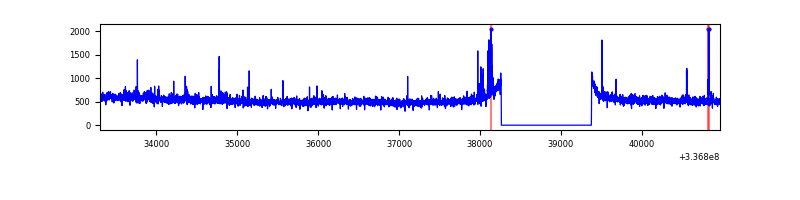 |
| B | 7665 | 6551 | 27 | 27 | 0.35% | 0.41% | 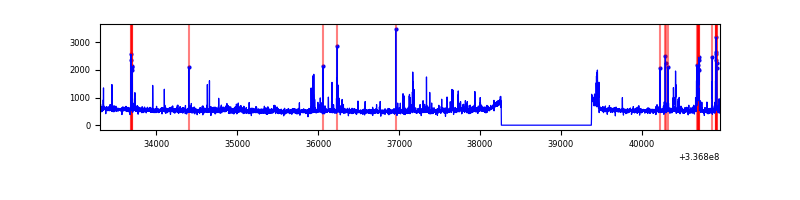 |
| C | 7665 | 6551 | 5 | 5 | 0.07% | 0.08% | 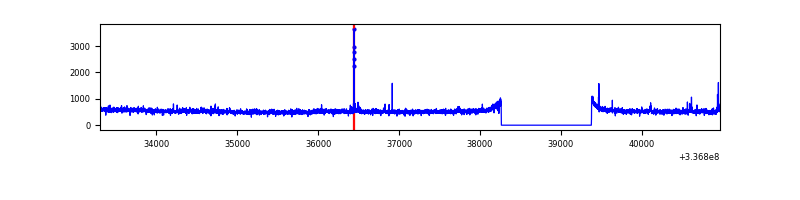 |
| D | 7665 | 6551 | 534 | 534 | 6.97% | 8.15% | 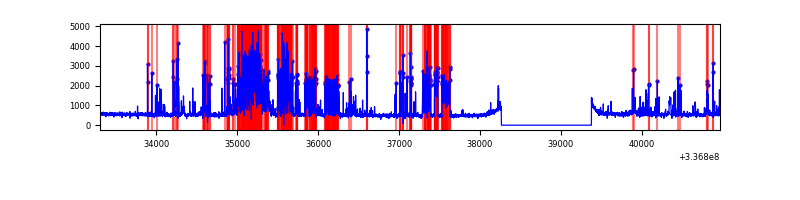 |
Top three noisy pixels from each quadrant. If the there are fewer than three noisy pixels in the level2.evt file, extra rows are filled as -1
| Pixel properties | Quadrant properties | ||||||
|---|---|---|---|---|---|---|---|
| Quadrant | DetID | PixID | Counts | Sigma | Mean | Median | Sigma |
| A | 0 | 13 | 99283 | 562.15 | 885 | 870 | 175.1 |
| A | 13 | 254 | 11172 | 58.84 | 885 | 870 | 175.1 |
| A | 0 | 226 | 7719 | 39.12 | 885 | 870 | 175.1 |
| B | 10 | 246 | 149448 | 919.25 | 865 | 847 | 161.7 |
| B | 15 | 36 | 75581 | 462.31 | 865 | 847 | 161.7 |
| B | 0 | 189 | 30385 | 182.72 | 865 | 847 | 161.7 |
| C | 14 | 238 | 135434 | 684.66 | 838 | 844 | 196.6 |
| C | 3 | 233 | 46704 | 233.29 | 838 | 844 | 196.6 |
| C | 15 | 208 | 26909 | 132.59 | 838 | 844 | 196.6 |
| D | 12 | 233 | 992996 | 5015.19 | 823 | 804 | 197.8 |
| D | 7 | 80 | 889578 | 4492.45 | 823 | 804 | 197.8 |
| D | 1 | 52 | 117852 | 591.64 | 823 | 804 | 197.8 |
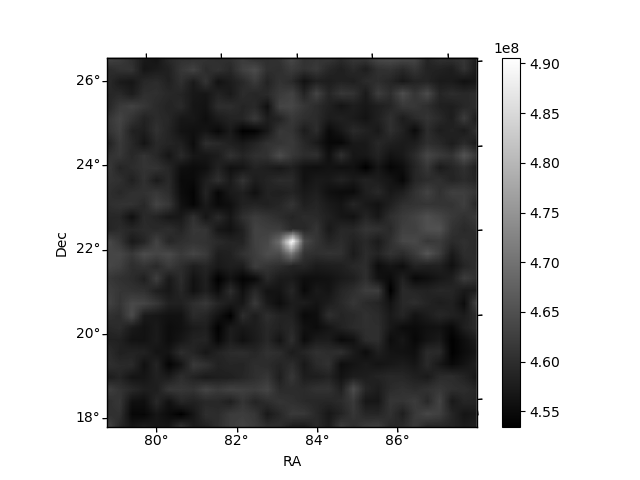
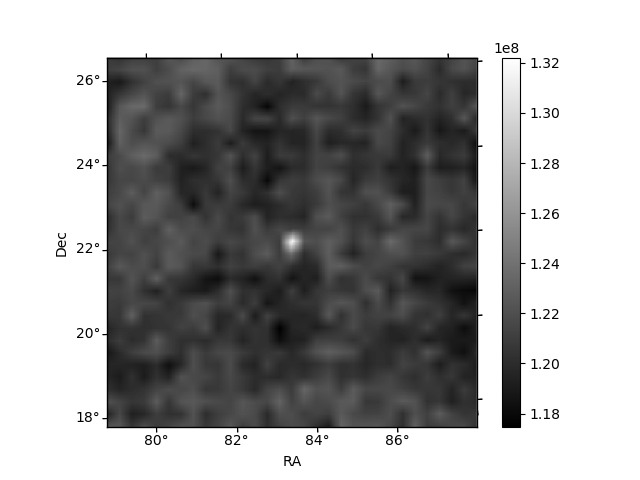
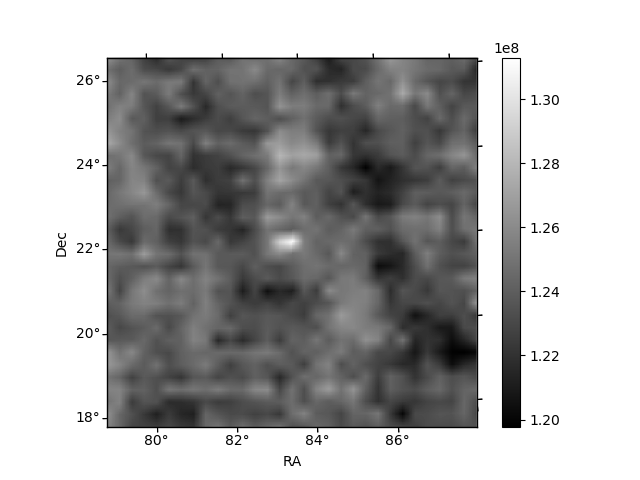
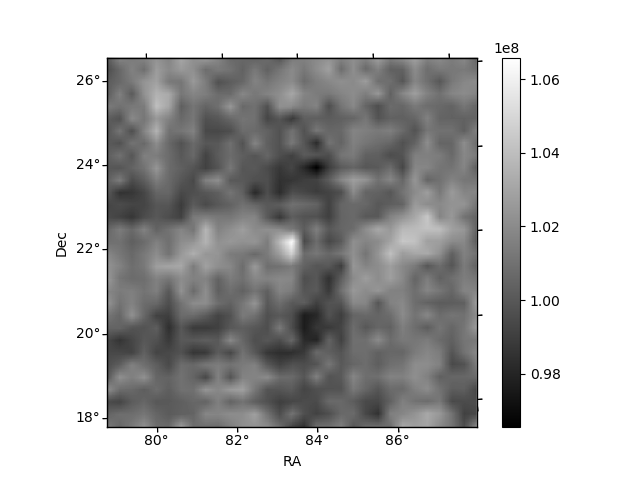
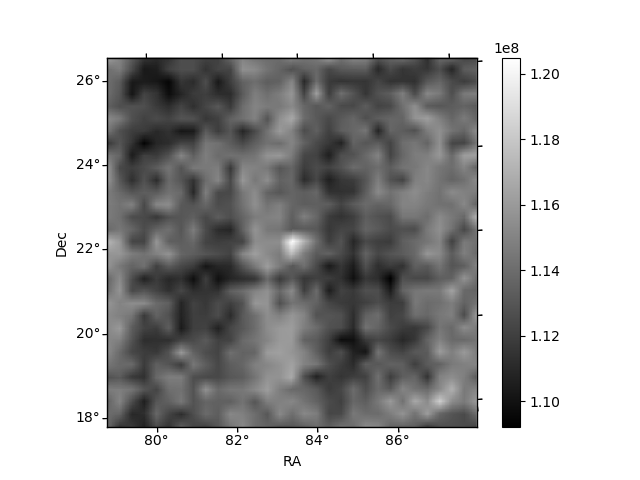
Histogram calculated using DETX and DETY for each event in the final _common_clean file
| Quadrant A | 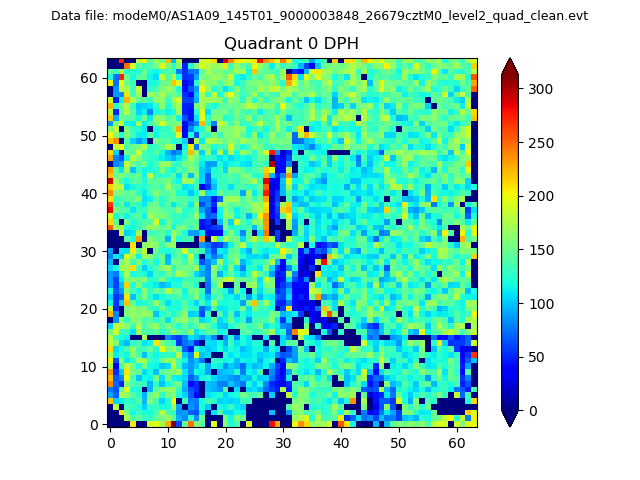 |
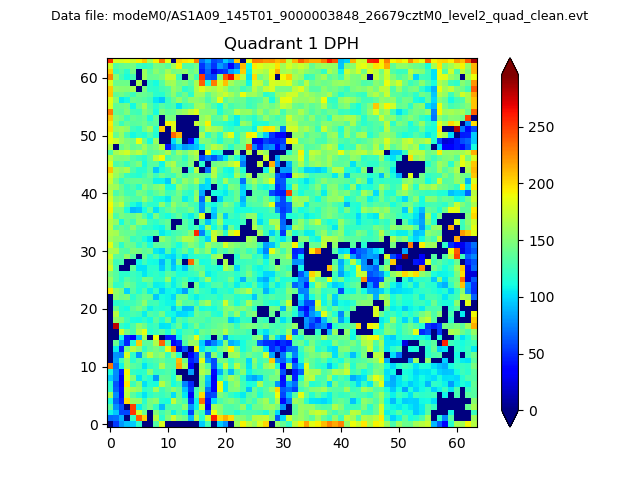 |
Quadrant B |
|---|---|---|---|
| Quadrant D | 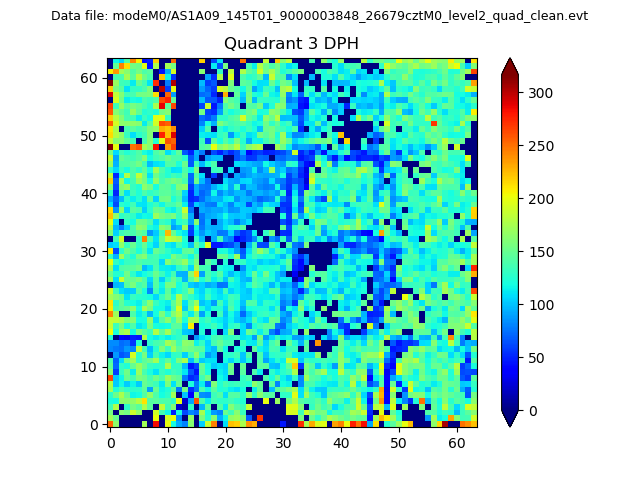 |
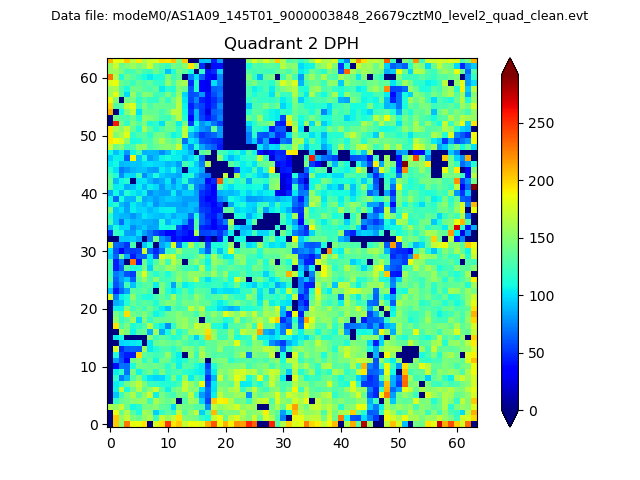 |
Quadrant C |
| Plot type | Count rate plots | Images |
|---|---|---|
| Comparison with Poisson distribution Blue bars denote a histogram of data divided into 1 sec bins. Red curve is a Poisson curve with rate = median count rate of data. |
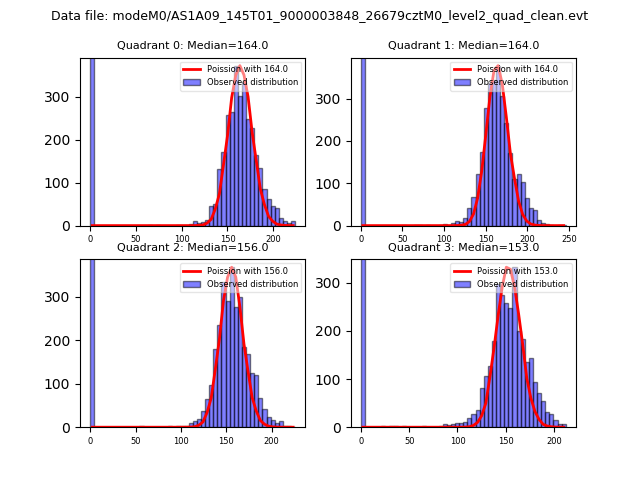 |
 |
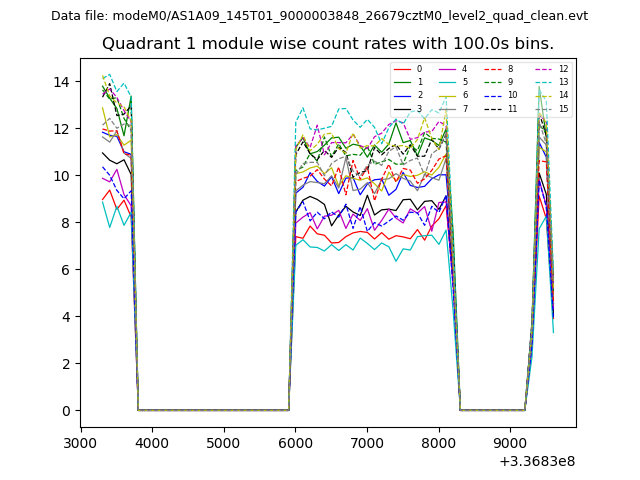
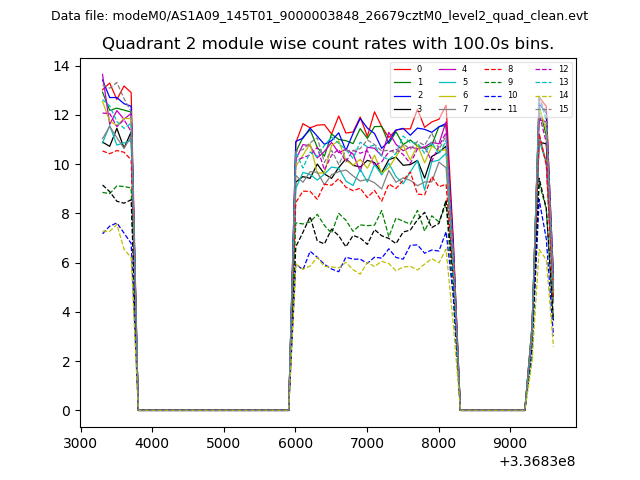
| Quadrant-wise count rates Data is divided into 100 sec bins |
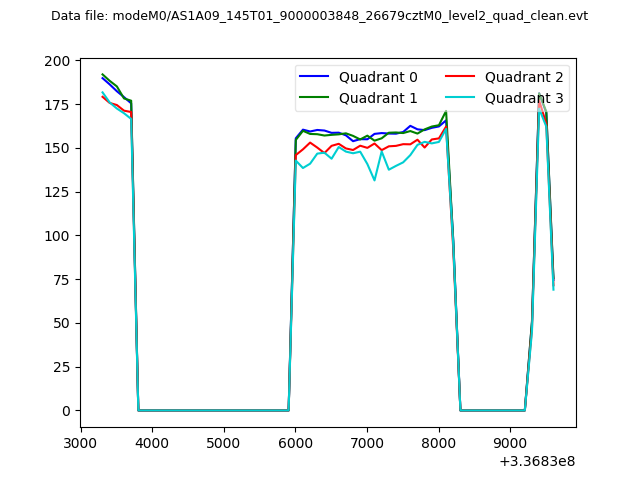 |
|
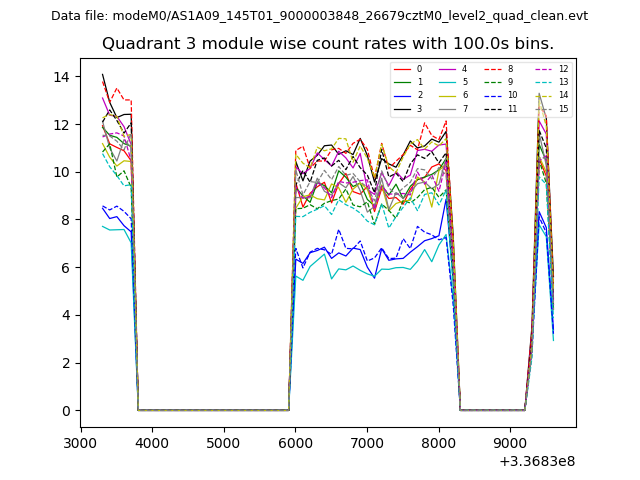
| Module-wise count rates for Quadrant A Data is divided into 100 sec bins |
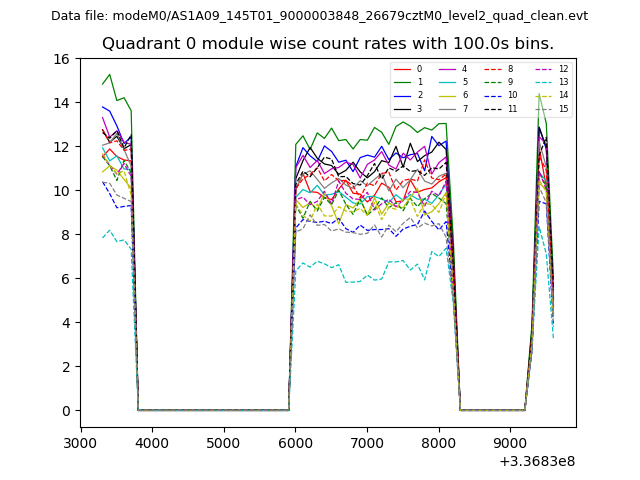 |
 |
| Module-wise count rates for Quadrant B Data is divided into 100 sec bins |
 |
 |
| Module-wise count rates for Quadrant C Data is divided into 100 sec bins |
 |
 |
| Module-wise count rates for Quadrant D Data is divided into 100 sec bins |
 |
 |
| Parameter | Plot |
|---|---|
| CZT HV Monitor | 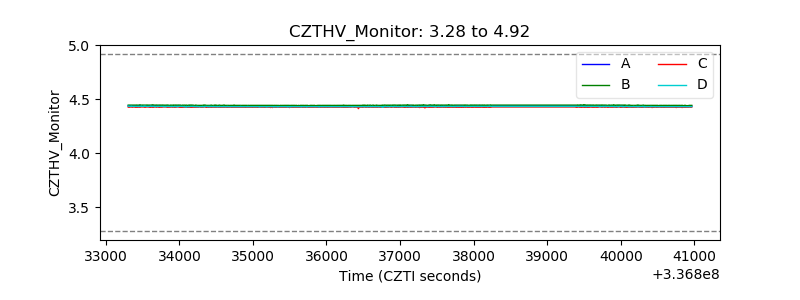 |
| D_VDD | 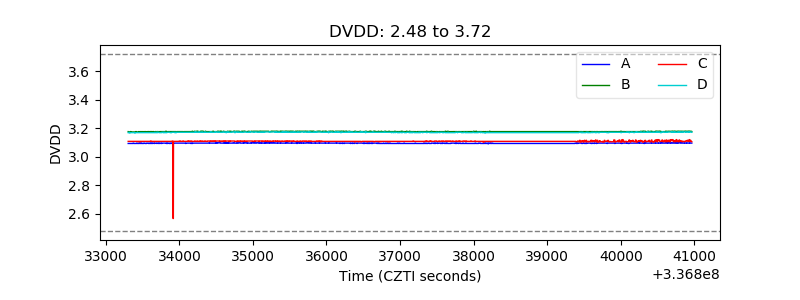 |
| Temperature 1 | 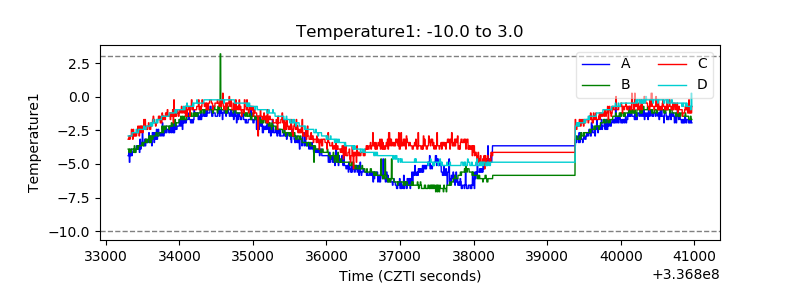 |
| Veto HV Monitor | 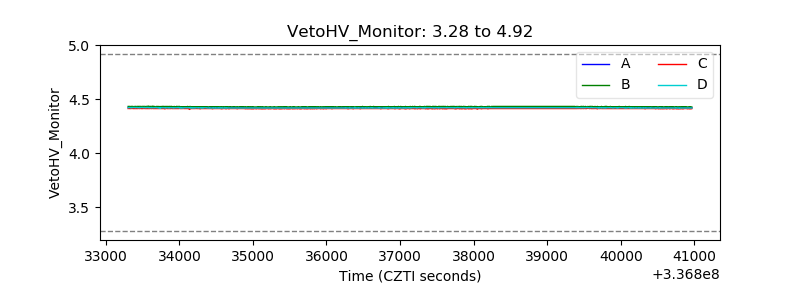 |
| Veto LLD |  |
| Alpha Counter | 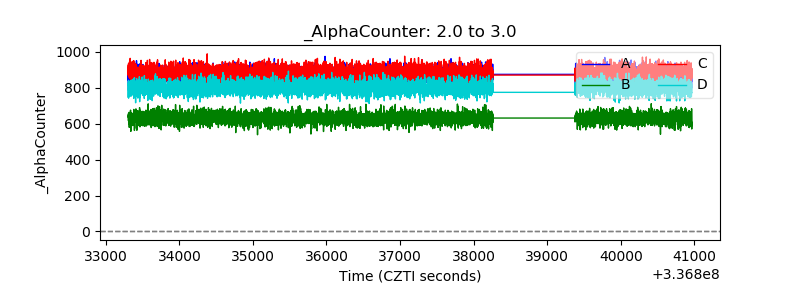 |
| _CPM_Rate | 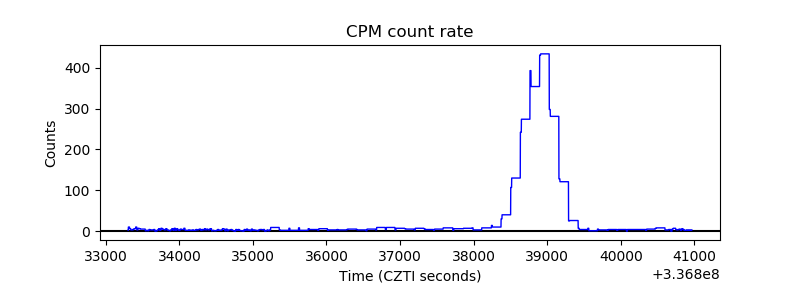 |
| CZT Counter | 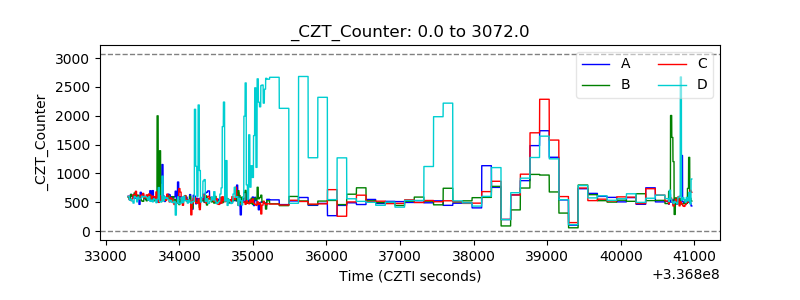 |
| +2.5 Volts monitor | 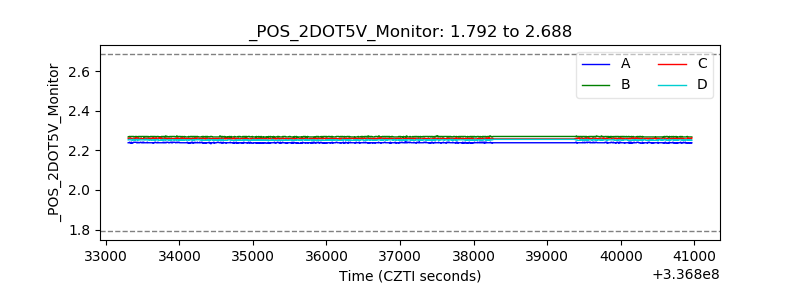 |
| +5 Volts monitor |  |
| _ROLL_ROT | 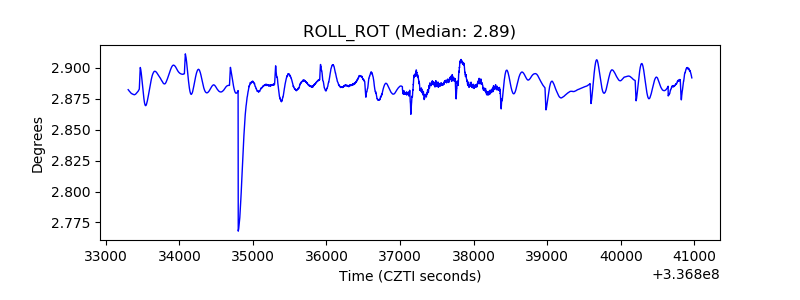 |
| _Roll_DEC | 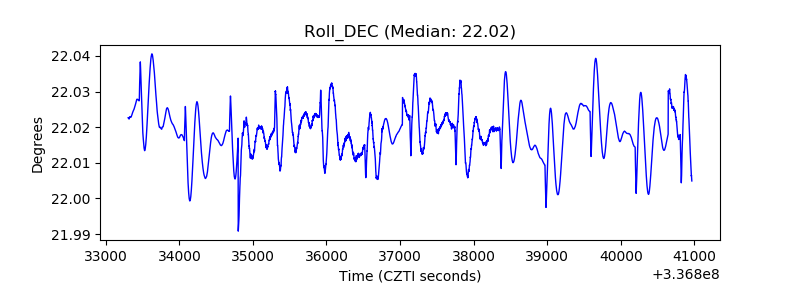 |
| _Roll_RA | 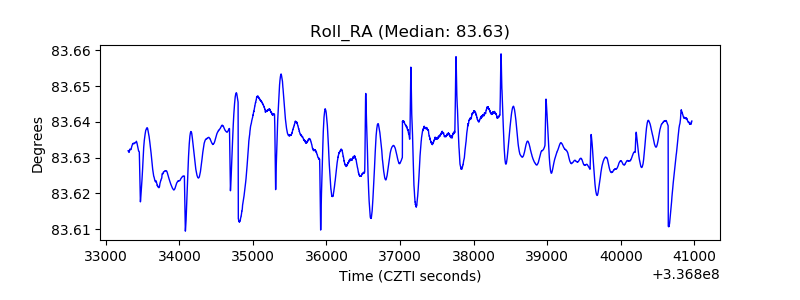 |
| Veto Counter | 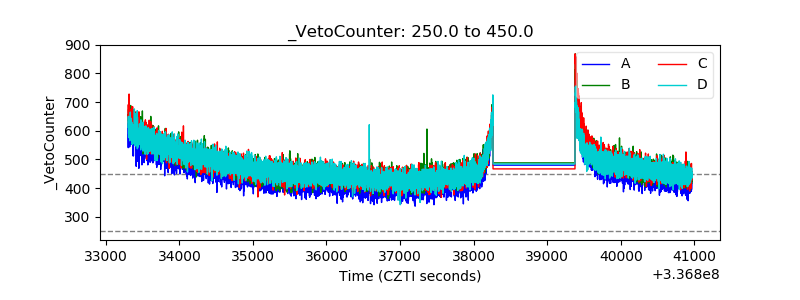 |