| Param | Original file | Final file |
|---|---|---|
| Filename | modeM0/AS1A09_145T01_9000003848_26680cztM0_level2.evt | modeM0/AS1A09_145T01_9000003848_26680cztM0_level2_quad_clean.evt |
| Size (bytes) | 545,572,800 | 74,093,760 |
| Size | 520.3 MB | 70.7 MB |
| Events in quadrant A | 3,501,117 | 460,710 |
| Events in quadrant B | 3,642,237 | 461,202 |
| Events in quadrant C | 3,529,313 | 439,743 |
| Events in quadrant D | 5,405,346 | 424,398 |
| Mode M0 | |||
|---|---|---|---|
| Quadrant | BADHDUFLAG | Total packets | Discarded packets |
| A | 0 | 14174 | 0 |
| B | 0 | 14658 | 0 |
| C | 0 | 14245 | 0 |
| D | 0 | 20783 | 0 |
| Mode M9 | |||
|---|---|---|---|
| Quadrant | BADHDUFLAG | Total packets | Discarded packets |
| A | 0 | 8 | 0 |
| B | 0 | 8 | 0 |
| C | 0 | 8 | 0 |
| D | 0 | 8 | 0 |
| Quadrant | Total seconds | Saturated seconds | Saturation percentage |
|---|---|---|---|
| A | 6563 | 135 | 2.056986% |
| B | 6564 | 151 | 2.300427% |
| C | 6564 | 168 | 2.559415% |
| D | 6564 | 368 | 5.606338% |
Noise dominated data is calculated using 1-second bins in cleaned event files. If a bin has >2000 counts, and if more than 50% of those come from <1% of pixels, then it is considered to be noise-dominated and hence unusable.
| Quadrant | # 1 sec bins | Bins with >0 counts | Bins with >2000 counts | High rate bins dominated by noise | Noise dominated (total time) | Noise dominated (detector-on time) | Marked lightcurve |
|---|---|---|---|---|---|---|---|
| A | 7278 | 6564 | 12 | 12 | 0.16% | 0.18% | 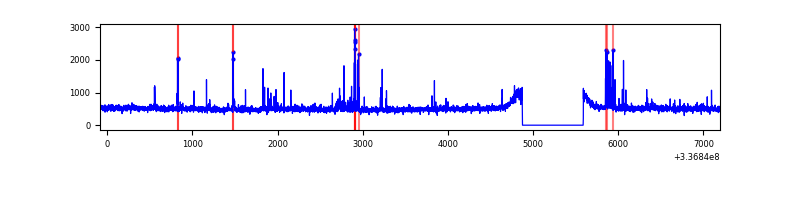 |
| B | 7279 | 6565 | 25 | 25 | 0.34% | 0.38% | 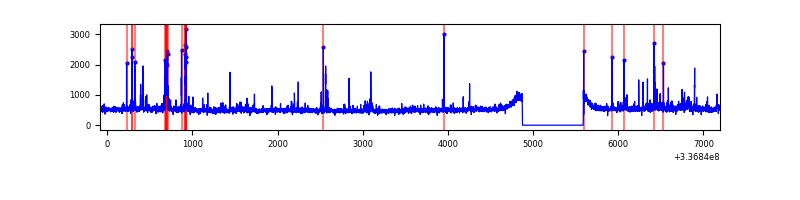 |
| C | 7279 | 6565 | 7 | 7 | 0.10% | 0.11% | 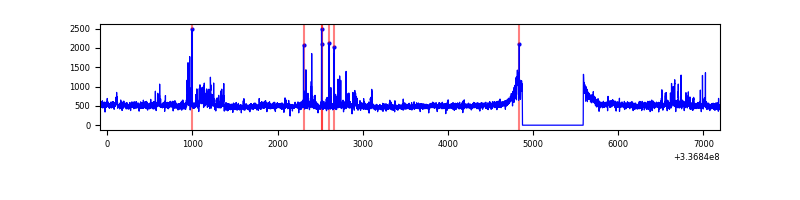 |
| D | 7279 | 6564 | 205 | 205 | 2.82% | 3.12% | 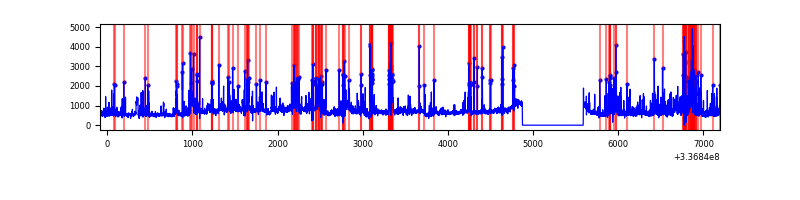 |
Top three noisy pixels from each quadrant. If the there are fewer than three noisy pixels in the level2.evt file, extra rows are filled as -1
| Pixel properties | Quadrant properties | ||||||
|---|---|---|---|---|---|---|---|
| Quadrant | DetID | PixID | Counts | Sigma | Mean | Median | Sigma |
| A | 0 | 13 | 166022 | 957.45 | 856 | 841 | 172.5 |
| A | 4 | 2 | 25753 | 144.4 | 856 | 841 | 172.5 |
| A | 13 | 254 | 10754 | 57.46 | 856 | 841 | 172.5 |
| B | 15 | 36 | 94152 | 580.02 | 844 | 825 | 160.9 |
| B | 10 | 246 | 54786 | 335.37 | 844 | 825 | 160.9 |
| B | 10 | 251 | 45563 | 278.04 | 844 | 825 | 160.9 |
| C | 14 | 238 | 127612 | 661.27 | 811 | 820 | 191.7 |
| C | 3 | 233 | 120330 | 623.29 | 811 | 820 | 191.7 |
| C | 2 | 16 | 69739 | 359.44 | 811 | 820 | 191.7 |
| D | 7 | 80 | 1458772 | 7245.99 | 820 | 798 | 201.2 |
| D | 1 | 52 | 495270 | 2457.48 | 820 | 798 | 201.2 |
| D | 2 | 250 | 229432 | 1136.29 | 820 | 798 | 201.2 |
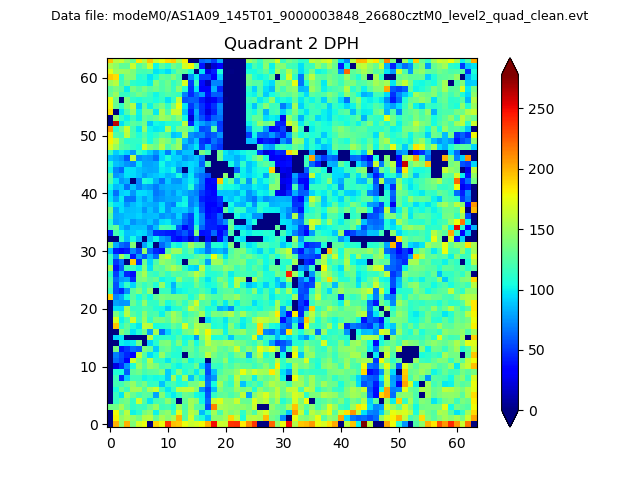
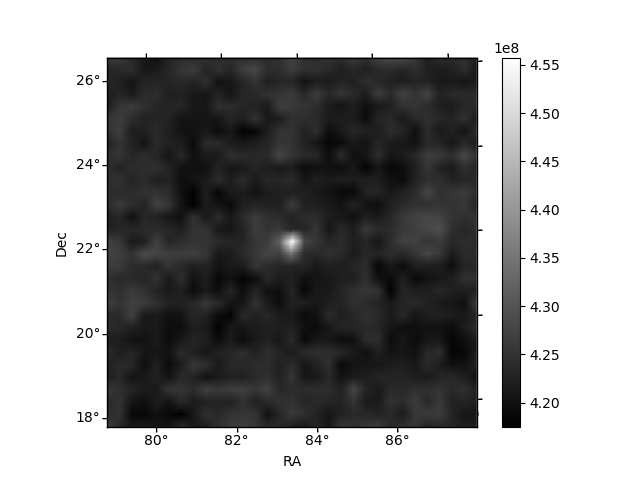
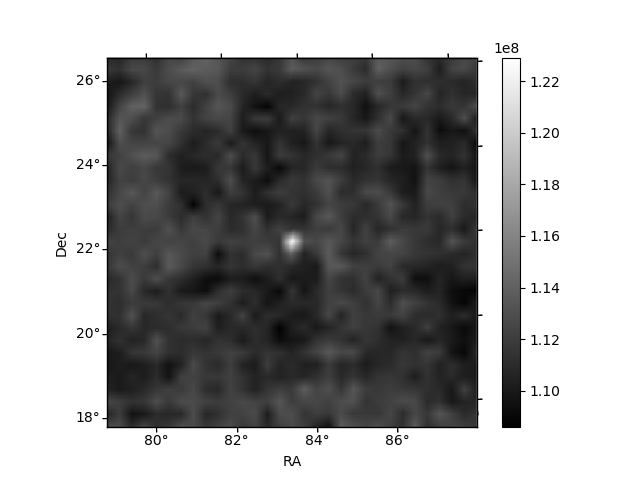
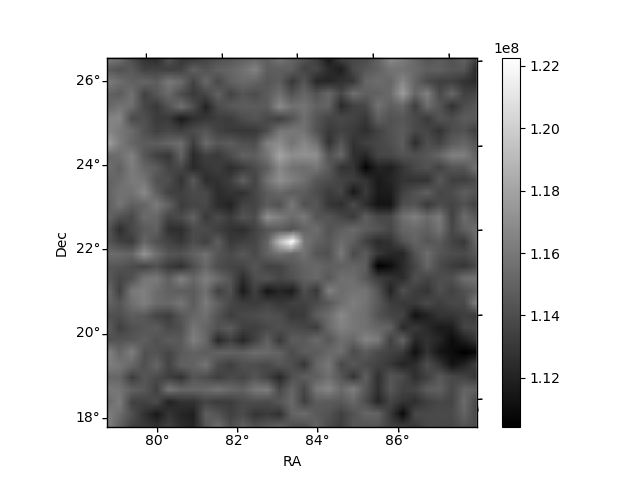
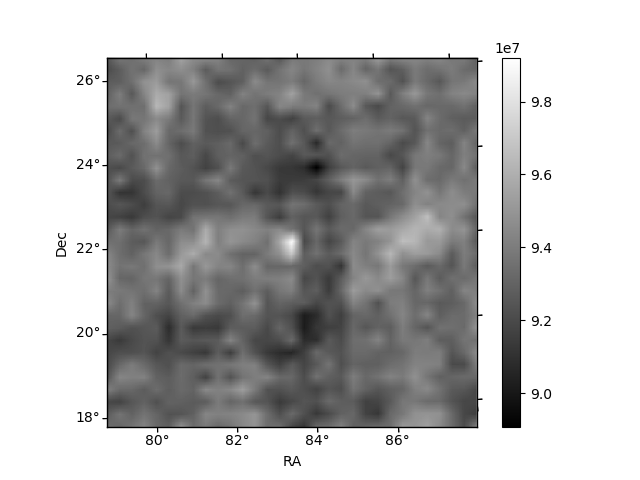
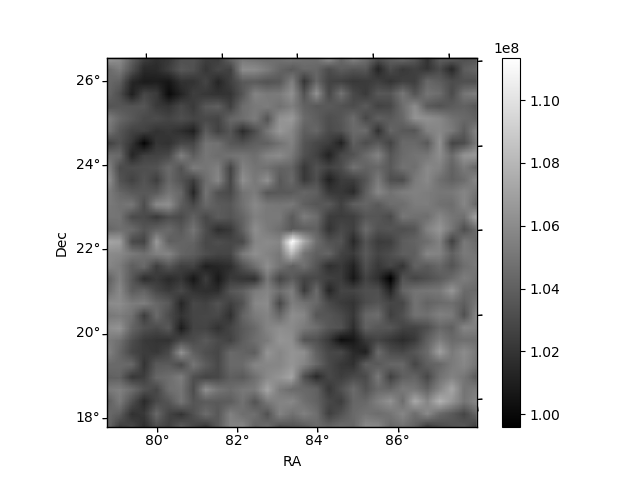
Histogram calculated using DETX and DETY for each event in the final _common_clean file
| Quadrant A | 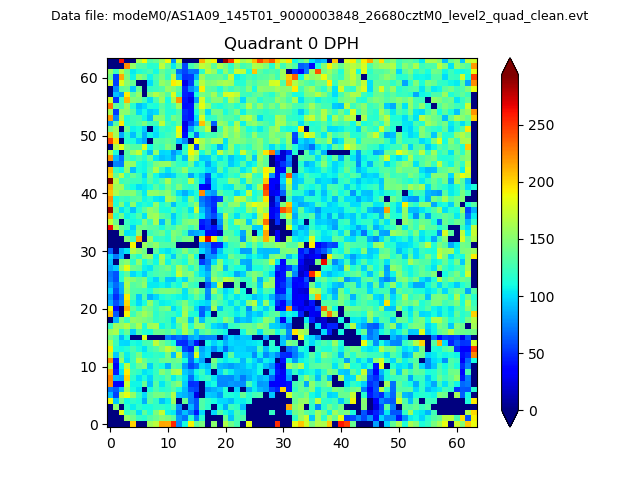 |
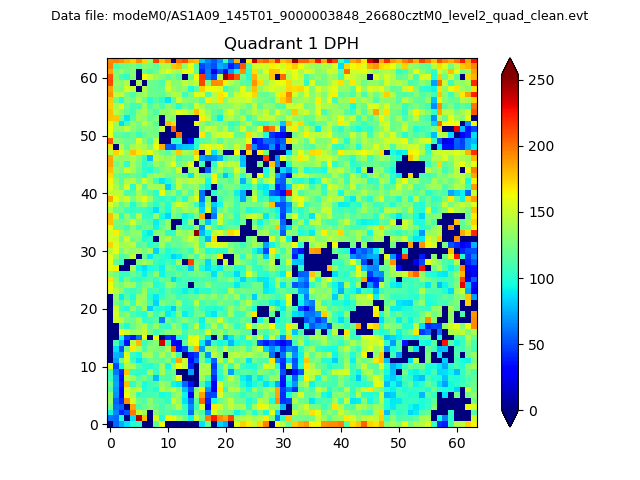 |
Quadrant B |
|---|---|---|---|
| Quadrant D | 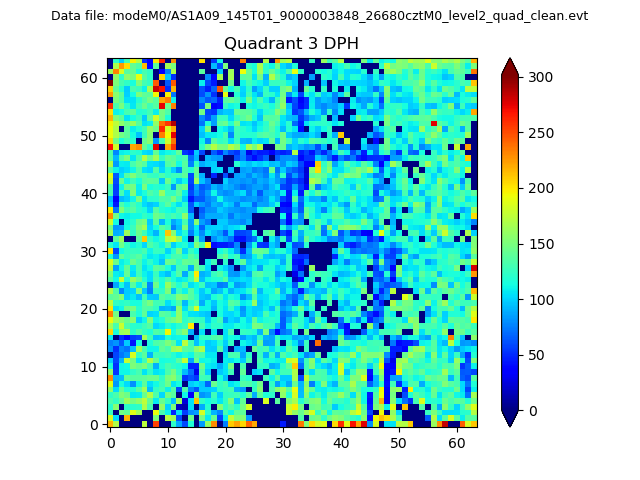 |
 |
Quadrant C |
| Plot type | Count rate plots | Images |
|---|---|---|
| Comparison with Poisson distribution Blue bars denote a histogram of data divided into 1 sec bins. Red curve is a Poisson curve with rate = median count rate of data. |
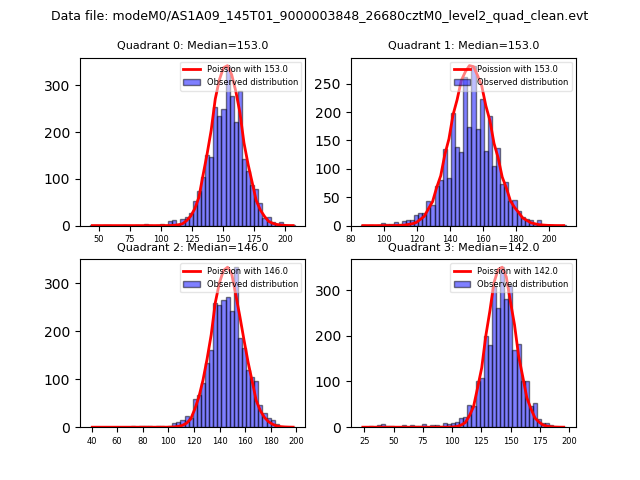 |
 |
| Quadrant-wise count rates Data is divided into 100 sec bins |
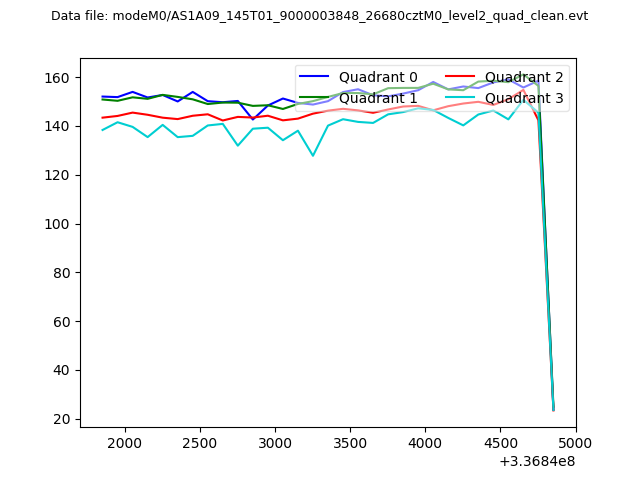 |
|
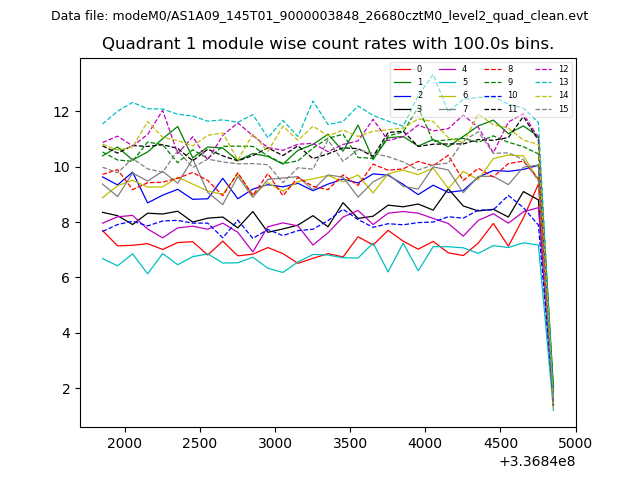
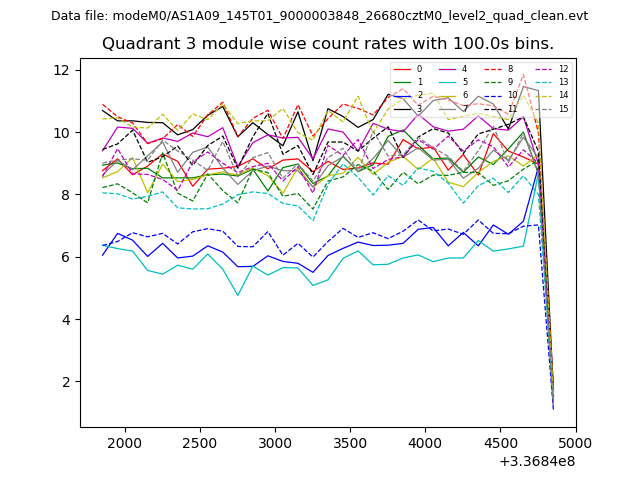
| Module-wise count rates for Quadrant A Data is divided into 100 sec bins |
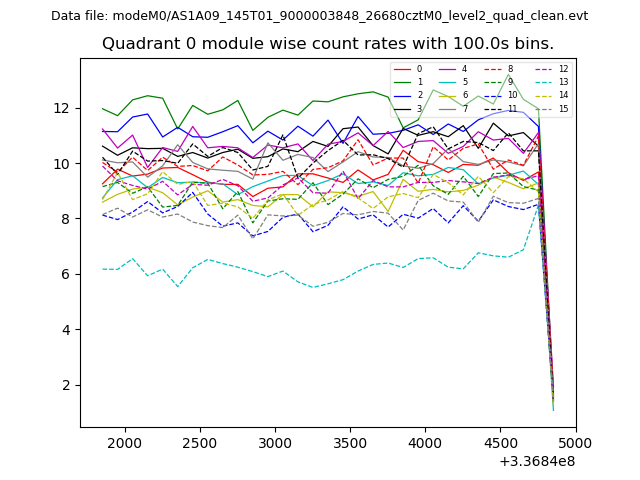 |
 |
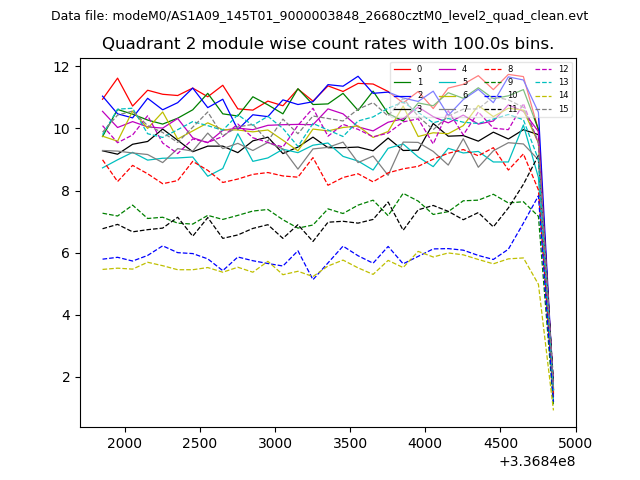
| Module-wise count rates for Quadrant B Data is divided into 100 sec bins |
 |
 |
| Module-wise count rates for Quadrant C Data is divided into 100 sec bins |
 |
 |
| Module-wise count rates for Quadrant D Data is divided into 100 sec bins |
 |
 |
| Parameter | Plot |
|---|---|
| CZT HV Monitor | 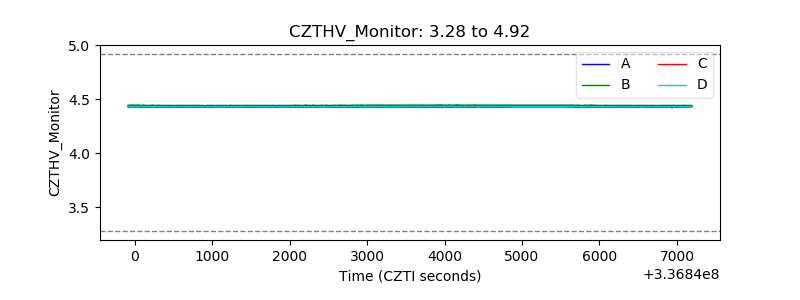 |
| D_VDD | 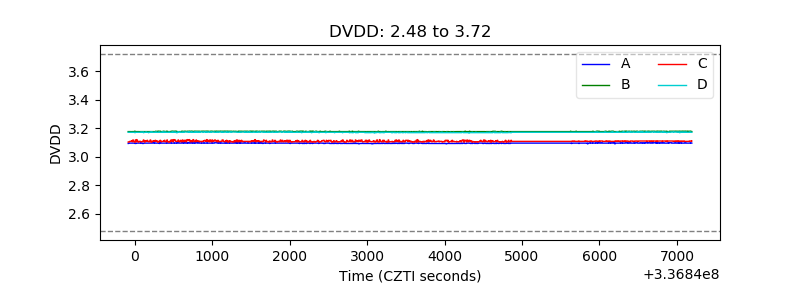 |
| Temperature 1 | 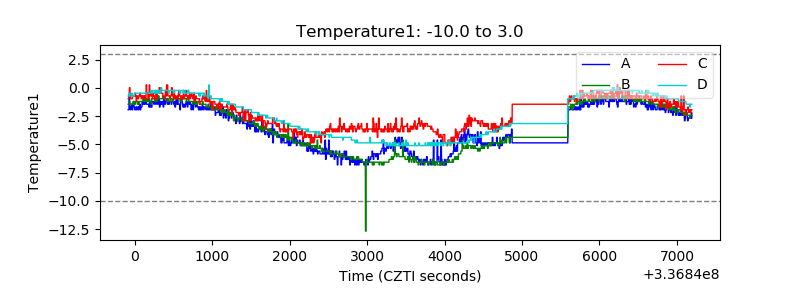 |
| Veto HV Monitor | 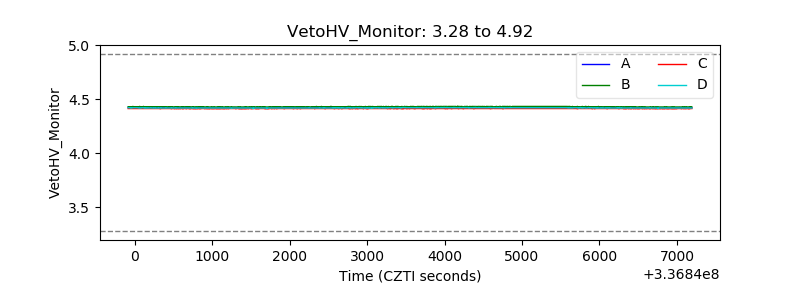 |
| Veto LLD | 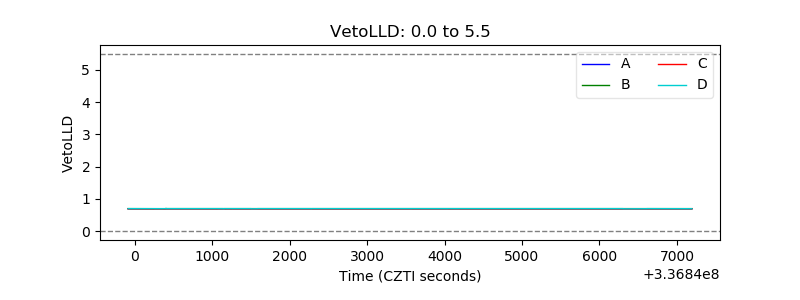 |
| Alpha Counter | 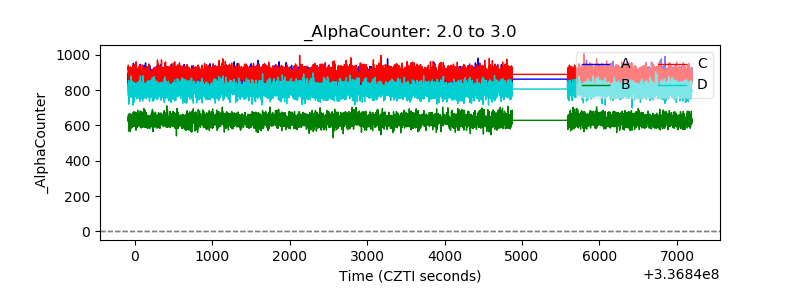 |
| _CPM_Rate | 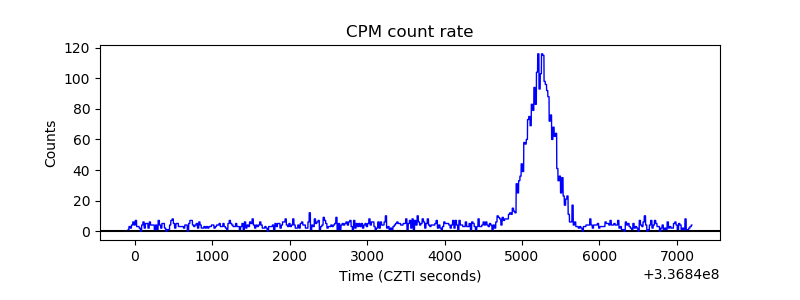 |
| CZT Counter | 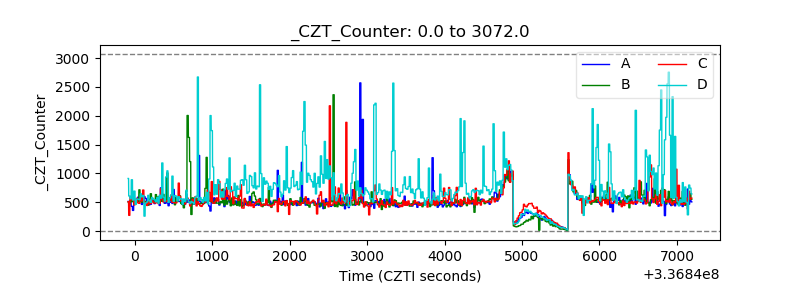 |
| +2.5 Volts monitor | 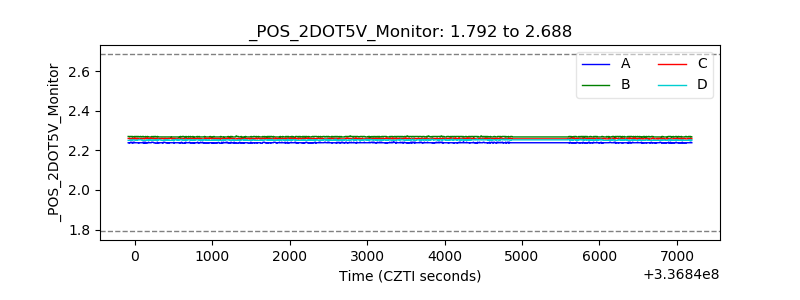 |
| +5 Volts monitor | 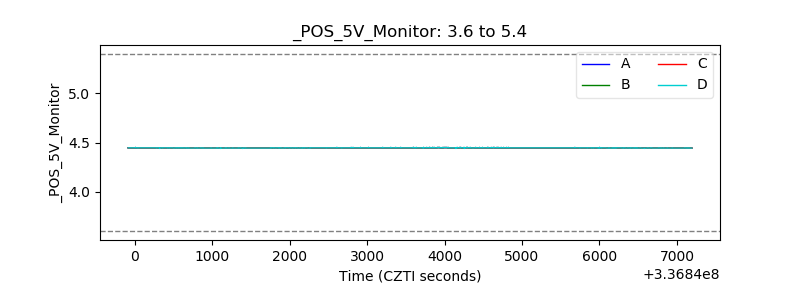 |
| _ROLL_ROT | 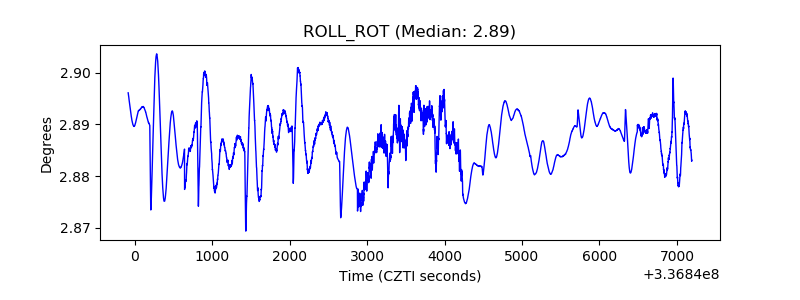 |
| _Roll_DEC | 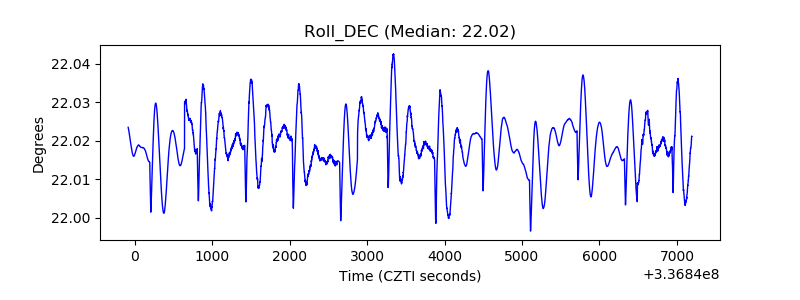 |
| _Roll_RA |  |
| Veto Counter | 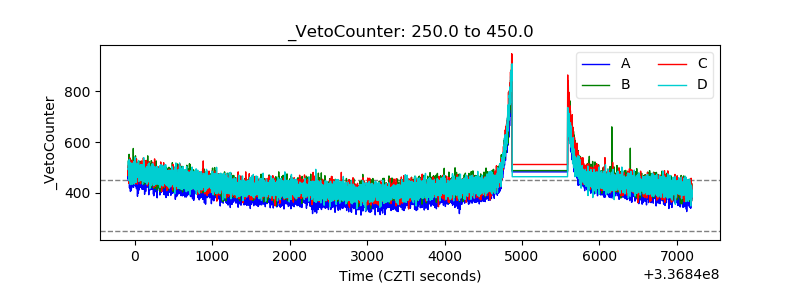 |