| Param | Original file | Final file |
|---|---|---|
| Filename | modeM0/AS1A09_145T01_9000003848_26681cztM0_level2.evt | modeM0/AS1A09_145T01_9000003848_26681cztM0_level2_quad_clean.evt |
| Size (bytes) | 605,551,680 | 86,549,760 |
| Size | 577.5 MB | 82.5 MB |
| Events in quadrant A | 3,778,617 | 538,669 |
| Events in quadrant B | 4,041,674 | 542,672 |
| Events in quadrant C | 3,864,025 | 520,582 |
| Events in quadrant D | 6,155,430 | 506,082 |
| Mode M0 | |||
|---|---|---|---|
| Quadrant | BADHDUFLAG | Total packets | Discarded packets |
| A | 0 | 15613 | 0 |
| B | 0 | 16506 | 0 |
| C | 0 | 15806 | 0 |
| D | 0 | 23269 | 0 |
| Mode M9 | |||
|---|---|---|---|
| Quadrant | BADHDUFLAG | Total packets | Discarded packets |
| A | 0 | 7 | 0 |
| B | 0 | 8 | 0 |
| C | 0 | 8 | 0 |
| D | 0 | 8 | 0 |
| Quadrant | Total seconds | Saturated seconds | Saturation percentage |
|---|---|---|---|
| A | 7373 | 148 | 2.007324% |
| B | 7373 | 189 | 2.563407% |
| C | 7373 | 205 | 2.780415% |
| D | 7372 | 856 | 11.611503% |
Noise dominated data is calculated using 1-second bins in cleaned event files. If a bin has >2000 counts, and if more than 50% of those come from <1% of pixels, then it is considered to be noise-dominated and hence unusable.
| Quadrant | # 1 sec bins | Bins with >0 counts | Bins with >2000 counts | High rate bins dominated by noise | Noise dominated (total time) | Noise dominated (detector-on time) | Marked lightcurve |
|---|---|---|---|---|---|---|---|
| A | 7753 | 7375 | 3 | 3 | 0.04% | 0.04% | 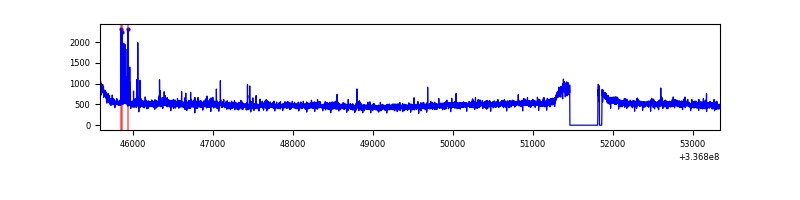 |
| B | 7753 | 7375 | 11 | 11 | 0.14% | 0.15% | 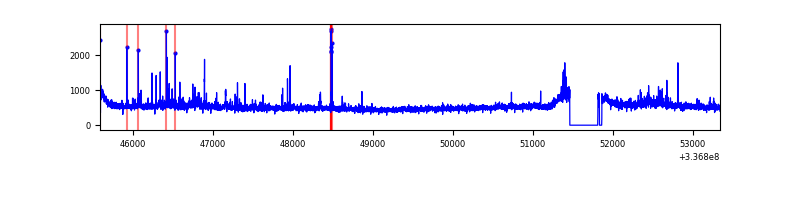 |
| C | 7753 | 7375 | 3 | 3 | 0.04% | 0.04% | 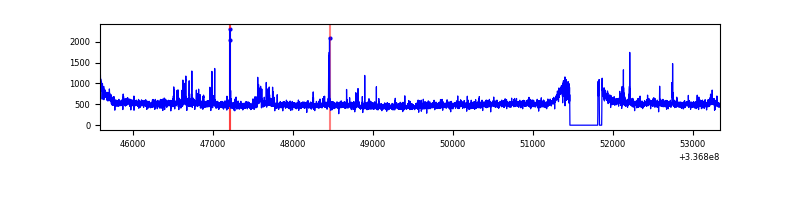 |
| D | 7752 | 7373 | 439 | 439 | 5.66% | 5.95% | 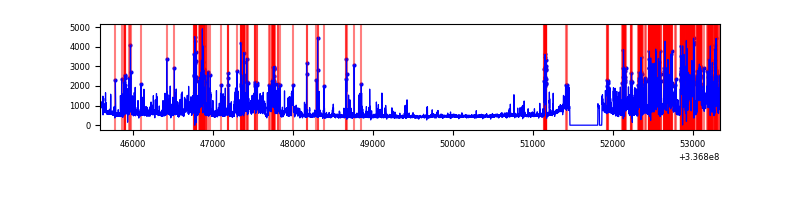 |
Top three noisy pixels from each quadrant. If the there are fewer than three noisy pixels in the level2.evt file, extra rows are filled as -1
| Pixel properties | Quadrant properties | ||||||
|---|---|---|---|---|---|---|---|
| Quadrant | DetID | PixID | Counts | Sigma | Mean | Median | Sigma |
| A | 0 | 13 | 57901 | 293.85 | 959 | 942 | 193.8 |
| A | 4 | 2 | 15298 | 74.06 | 959 | 942 | 193.8 |
| A | 13 | 254 | 12977 | 62.09 | 959 | 942 | 193.8 |
| B | 0 | 189 | 123185 | 673.49 | 946 | 923 | 181.5 |
| B | 10 | 246 | 59181 | 320.92 | 946 | 923 | 181.5 |
| B | 0 | 245 | 51622 | 279.28 | 946 | 923 | 181.5 |
| C | 14 | 238 | 144541 | 666.21 | 911 | 920 | 215.6 |
| C | 2 | 16 | 120501 | 554.69 | 911 | 920 | 215.6 |
| C | 3 | 233 | 44262 | 201.05 | 911 | 920 | 215.6 |
| D | 1 | 52 | 1683781 | 7681.51 | 894 | 869 | 219.1 |
| D | 7 | 80 | 562305 | 2562.63 | 894 | 869 | 219.1 |
| D | 2 | 250 | 213500 | 970.54 | 894 | 869 | 219.1 |
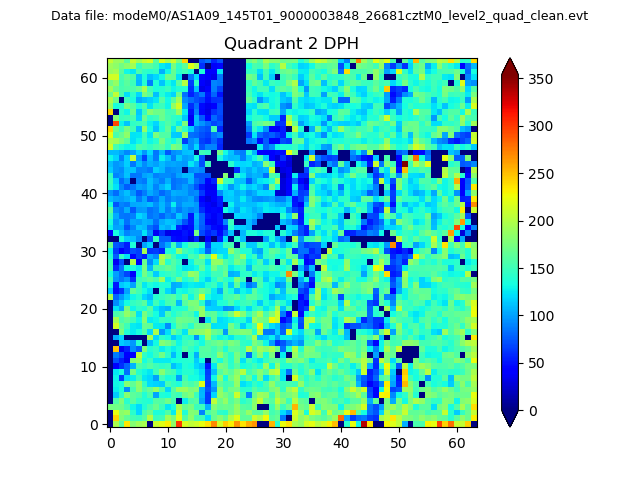
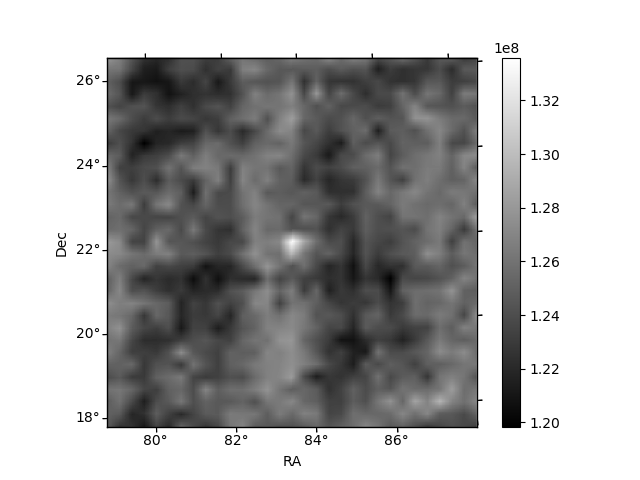
Histogram calculated using DETX and DETY for each event in the final _common_clean file
| Quadrant A | 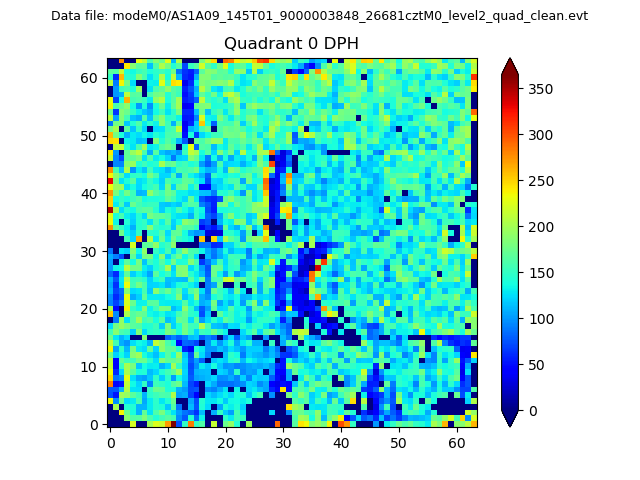 |
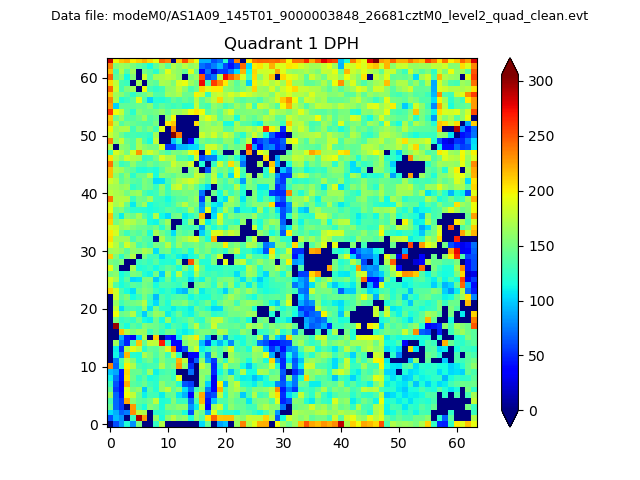 |
Quadrant B |
|---|---|---|---|
| Quadrant D | 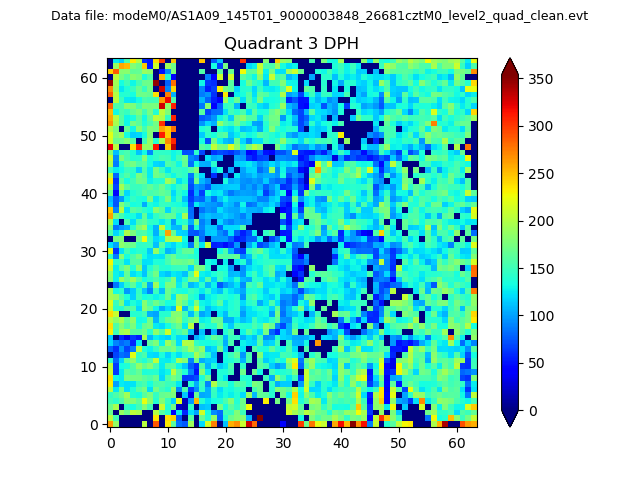 |
 |
Quadrant C |
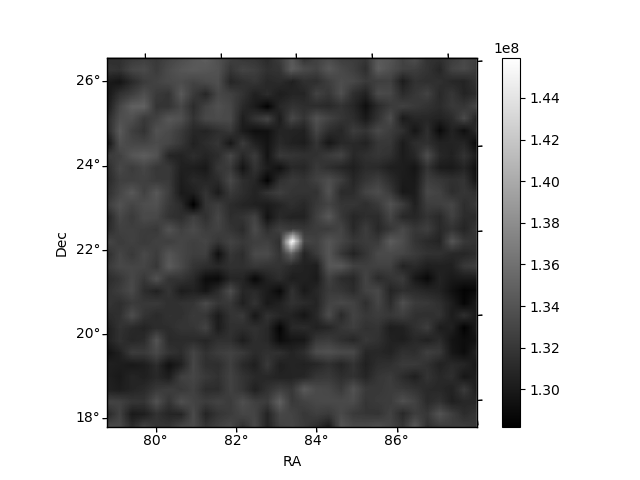
| Plot type | Count rate plots | Images |
|---|---|---|
| Comparison with Poisson distribution Blue bars denote a histogram of data divided into 1 sec bins. Red curve is a Poisson curve with rate = median count rate of data. |
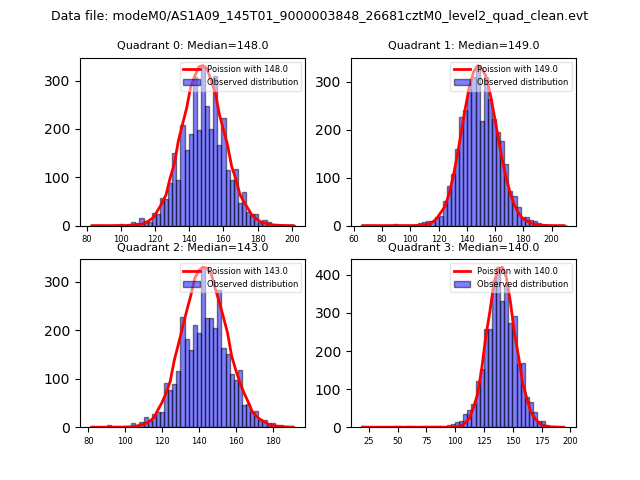 |
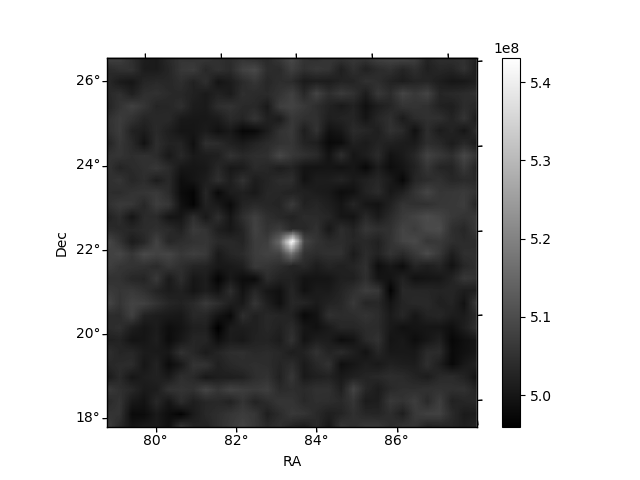 |
| Quadrant-wise count rates Data is divided into 100 sec bins |
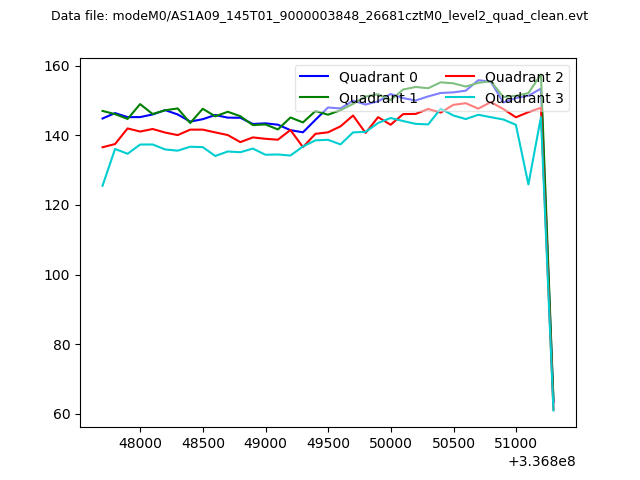 |
|
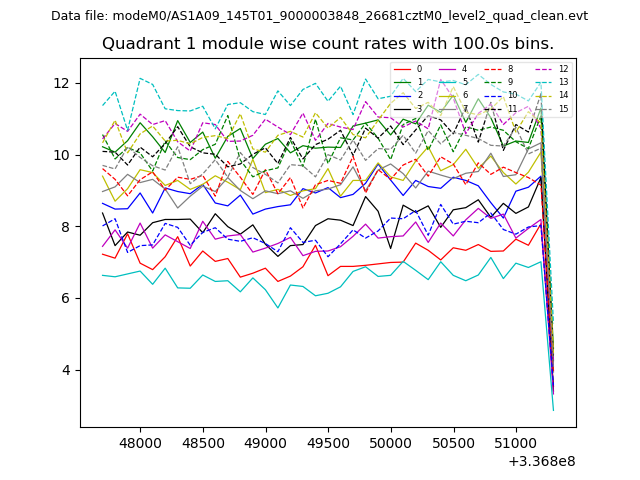
| Module-wise count rates for Quadrant A Data is divided into 100 sec bins |
 |
 |
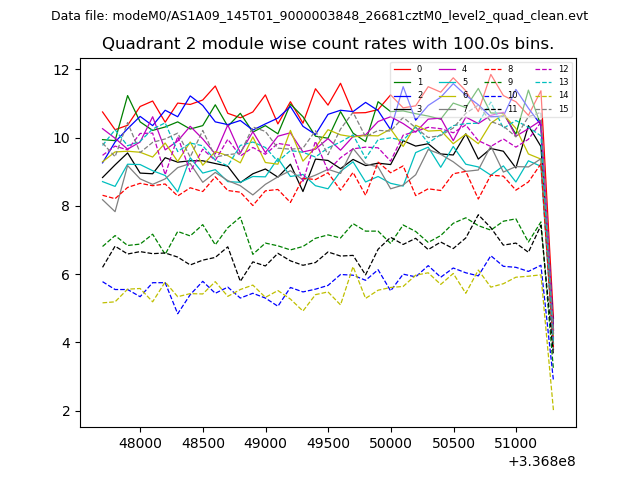
| Module-wise count rates for Quadrant B Data is divided into 100 sec bins |
 |
 |
| Module-wise count rates for Quadrant C Data is divided into 100 sec bins |
 |
 |
| Module-wise count rates for Quadrant D Data is divided into 100 sec bins |
 |
 |
| Parameter | Plot |
|---|---|
| CZT HV Monitor | 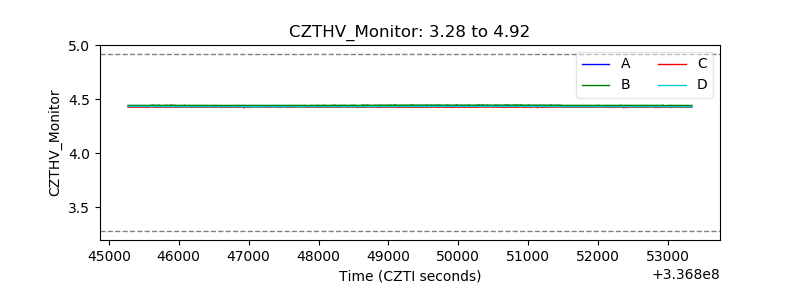 |
| D_VDD | 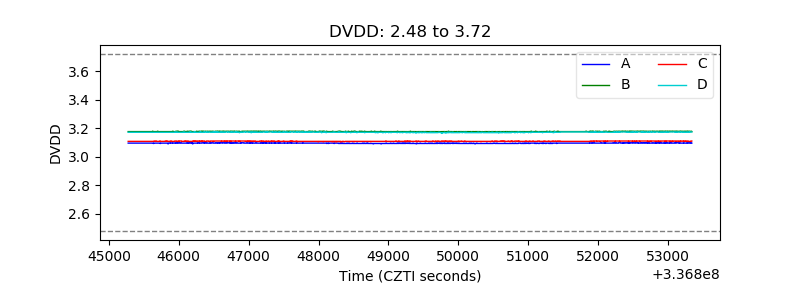 |
| Temperature 1 | 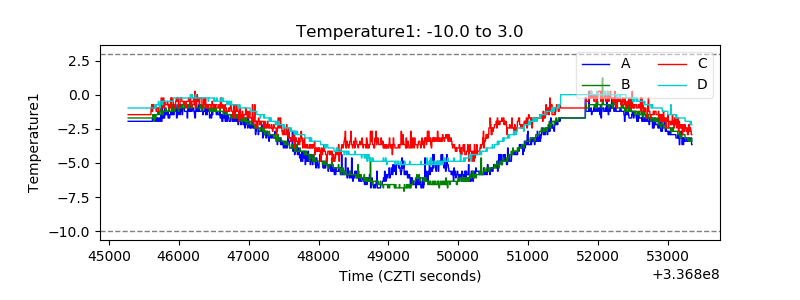 |
| Veto HV Monitor | 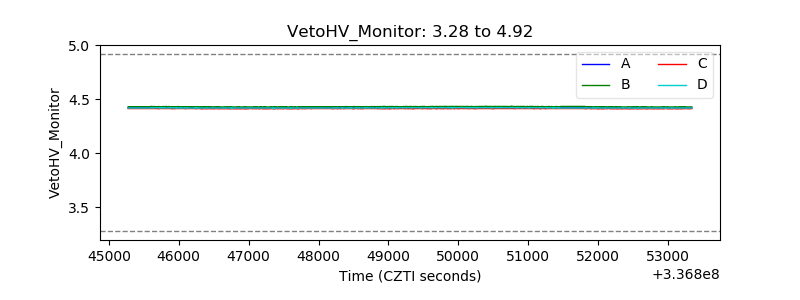 |
| Veto LLD | 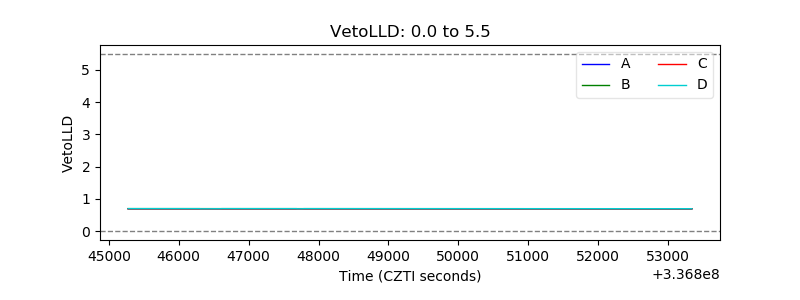 |
| Alpha Counter | 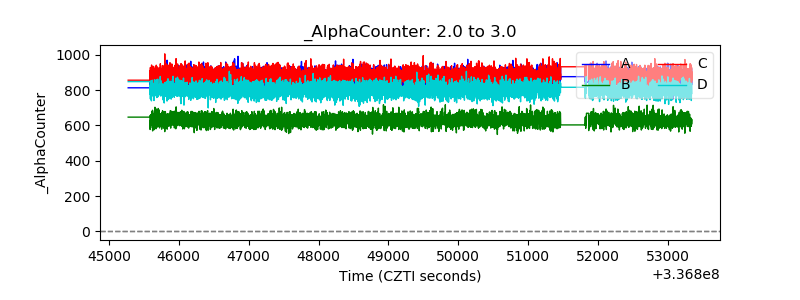 |
| _CPM_Rate | 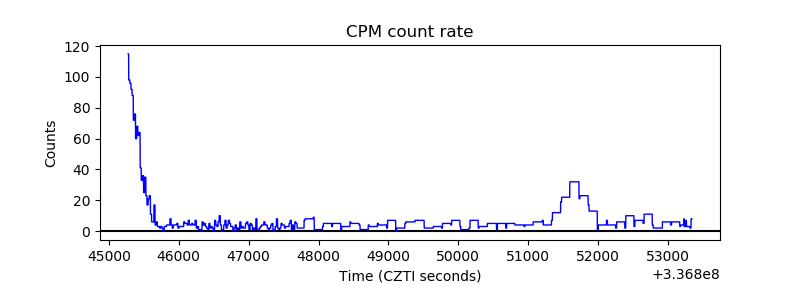 |
| CZT Counter | 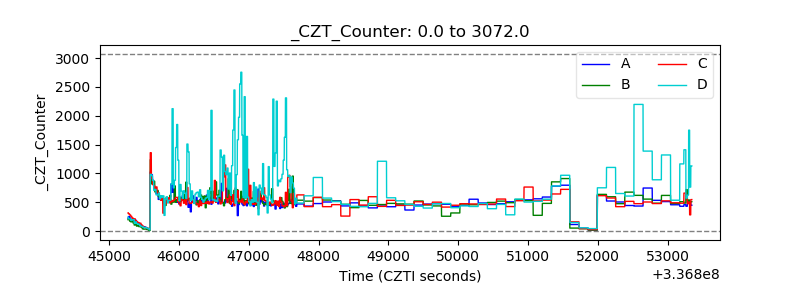 |
| +2.5 Volts monitor |  |
| +5 Volts monitor |  |
| _ROLL_ROT |  |
| _Roll_DEC | 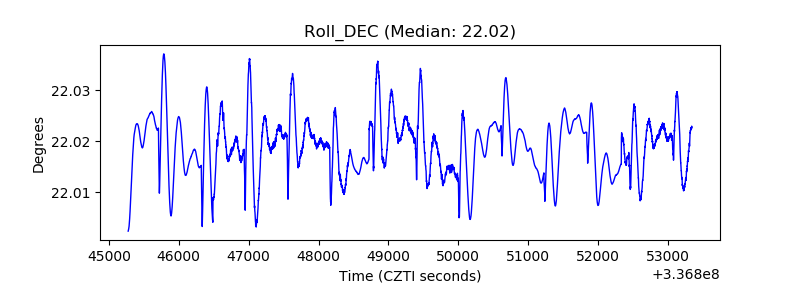 |
| _Roll_RA | 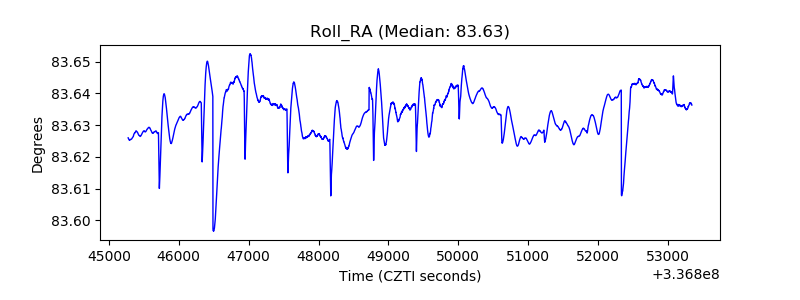 |
| Veto Counter | 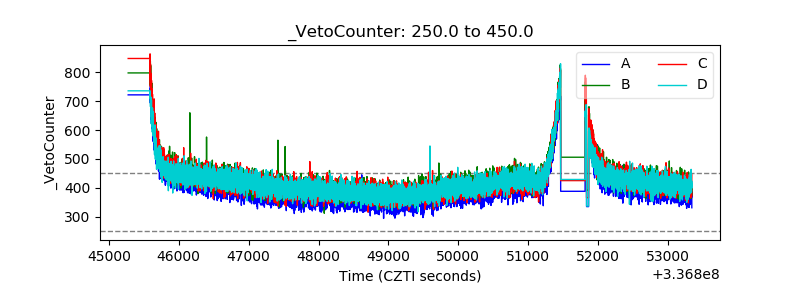 |