| Param | Original file | Final file |
|---|---|---|
| Filename | modeM0/AS1A09_145T01_9000003848_26682cztM0_level2.evt | modeM0/AS1A09_145T01_9000003848_26682cztM0_level2_quad_clean.evt |
| Size (bytes) | 652,821,120 | 90,339,840 |
| Size | 622.6 MB | 86.2 MB |
| Events in quadrant A | 3,932,985 | 566,609 |
| Events in quadrant B | 4,303,895 | 569,594 |
| Events in quadrant C | 4,347,468 | 541,795 |
| Events in quadrant D | 6,668,259 | 525,772 |
| Mode M0 | |||
|---|---|---|---|
| Quadrant | BADHDUFLAG | Total packets | Discarded packets |
| A | 0 | 16317 | 0 |
| B | 0 | 17547 | 0 |
| C | 0 | 17540 | 0 |
| D | 0 | 24918 | 0 |
| Mode M9 | |||
|---|---|---|---|
| Quadrant | BADHDUFLAG | Total packets | Discarded packets |
| A | 0 | 7 | 0 |
| B | 0 | 7 | 0 |
| C | 0 | 7 | 0 |
| D | 0 | 7 | 0 |
| Quadrant | Total seconds | Saturated seconds | Saturation percentage |
|---|---|---|---|
| A | 7648 | 211 | 2.758891% |
| B | 7649 | 303 | 3.961302% |
| C | 7649 | 380 | 4.967970% |
| D | 7648 | 1047 | 13.689854% |
Noise dominated data is calculated using 1-second bins in cleaned event files. If a bin has >2000 counts, and if more than 50% of those come from <1% of pixels, then it is considered to be noise-dominated and hence unusable.
| Quadrant | # 1 sec bins | Bins with >0 counts | Bins with >2000 counts | High rate bins dominated by noise | Noise dominated (total time) | Noise dominated (detector-on time) | Marked lightcurve |
|---|---|---|---|---|---|---|---|
| A | 8313 | 7651 | 1 | 1 | 0.01% | 0.01% | 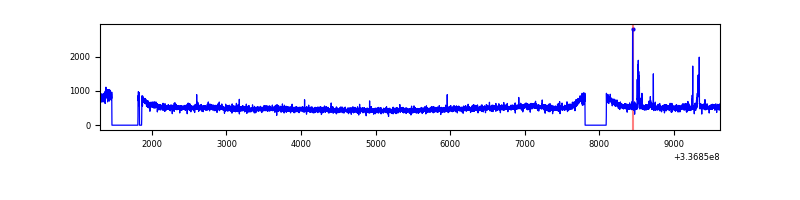 |
| B | 8314 | 7652 | 5 | 5 | 0.06% | 0.07% | 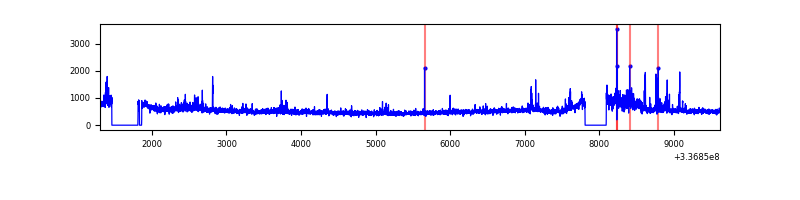 |
| C | 8314 | 7652 | 50 | 50 | 0.60% | 0.65% | 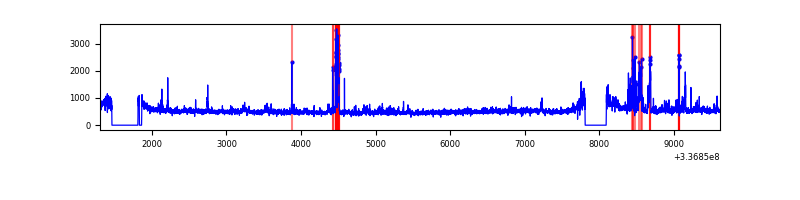 |
| D | 8313 | 7651 | 532 | 532 | 6.40% | 6.95% | 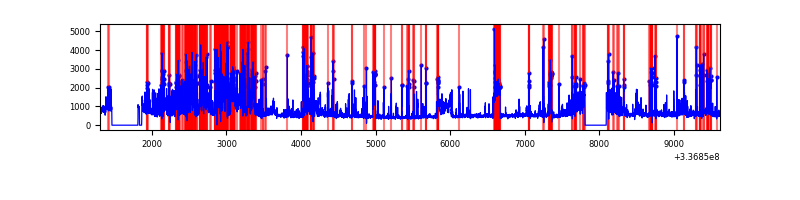 |
Top three noisy pixels from each quadrant. If the there are fewer than three noisy pixels in the level2.evt file, extra rows are filled as -1
| Pixel properties | Quadrant properties | ||||||
|---|---|---|---|---|---|---|---|
| Quadrant | DetID | PixID | Counts | Sigma | Mean | Median | Sigma |
| A | 4 | 2 | 59240 | 291.25 | 995 | 975 | 200.1 |
| A | 0 | 13 | 32691 | 158.54 | 995 | 975 | 200.1 |
| A | 13 | 254 | 12892 | 59.57 | 995 | 975 | 200.1 |
| B | 0 | 189 | 242002 | 1279.07 | 982 | 957 | 188.5 |
| B | 10 | 246 | 102245 | 537.47 | 982 | 957 | 188.5 |
| B | 5 | 172 | 62716 | 327.71 | 982 | 957 | 188.5 |
| C | 3 | 233 | 253040 | 1129.46 | 942 | 948 | 223.2 |
| C | 14 | 238 | 151368 | 673.93 | 942 | 948 | 223.2 |
| C | 2 | 16 | 148534 | 661.23 | 942 | 948 | 223.2 |
| D | 1 | 52 | 1923030 | 8468.09 | 923 | 896 | 227.0 |
| D | 7 | 80 | 614531 | 2703.41 | 923 | 896 | 227.0 |
| D | 2 | 250 | 380016 | 1670.24 | 923 | 896 | 227.0 |
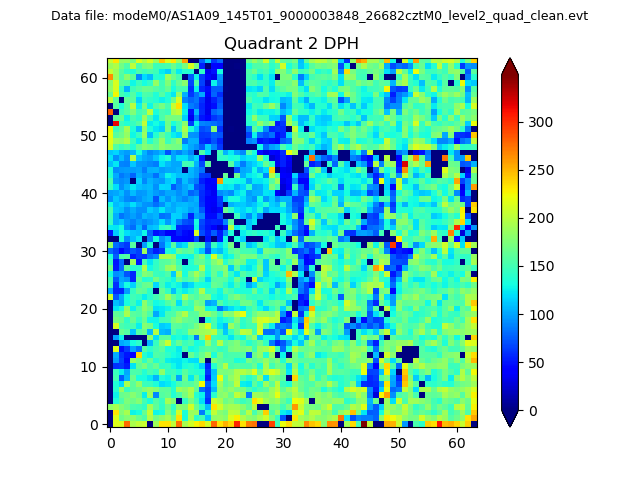
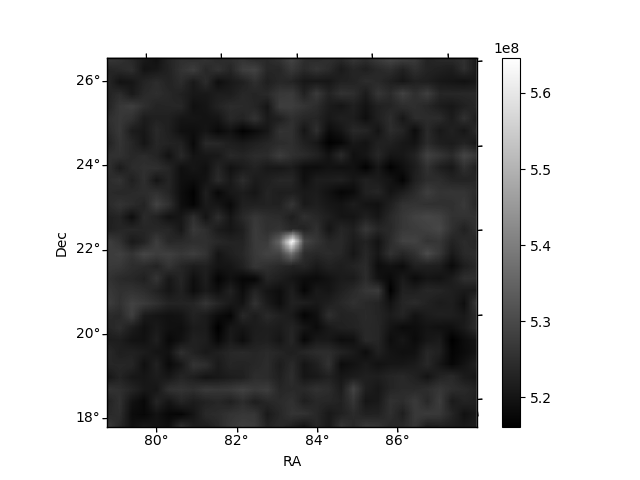
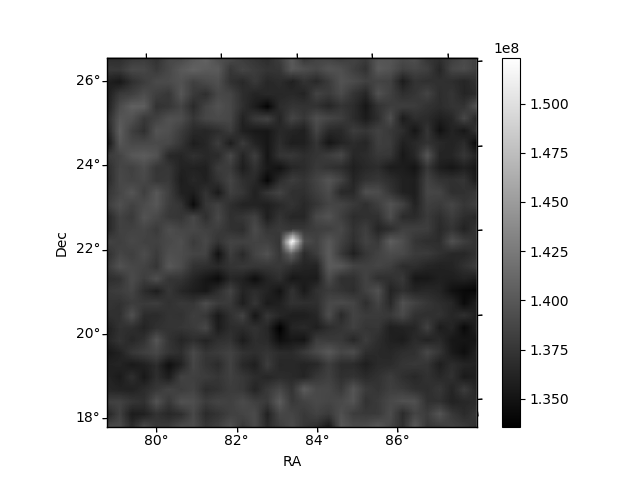
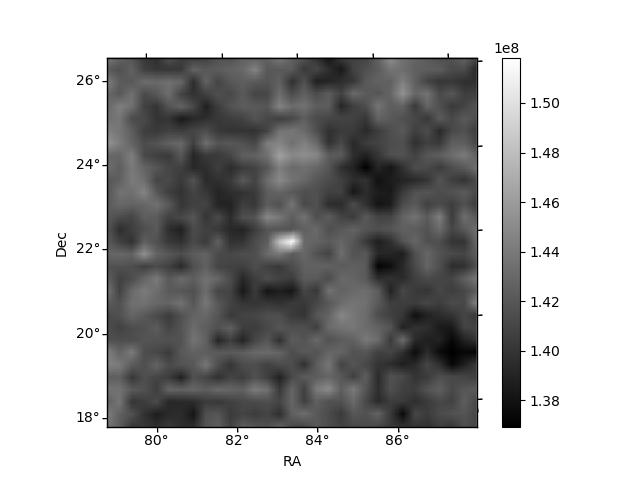
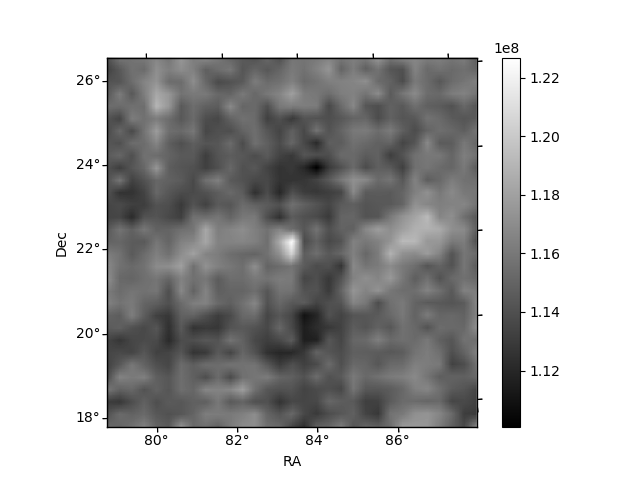
Histogram calculated using DETX and DETY for each event in the final _common_clean file
| Quadrant A | 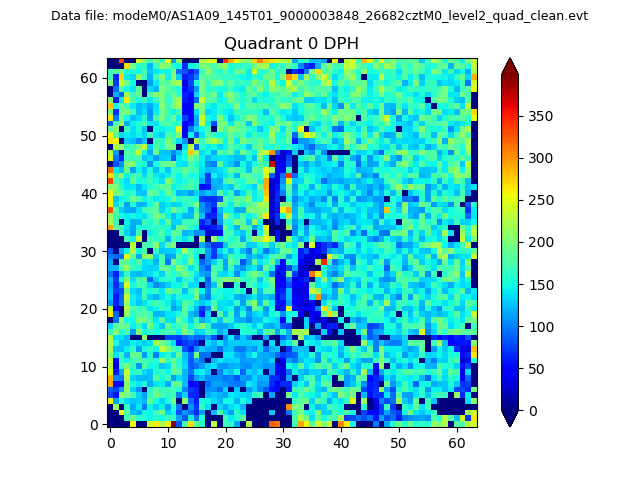 |
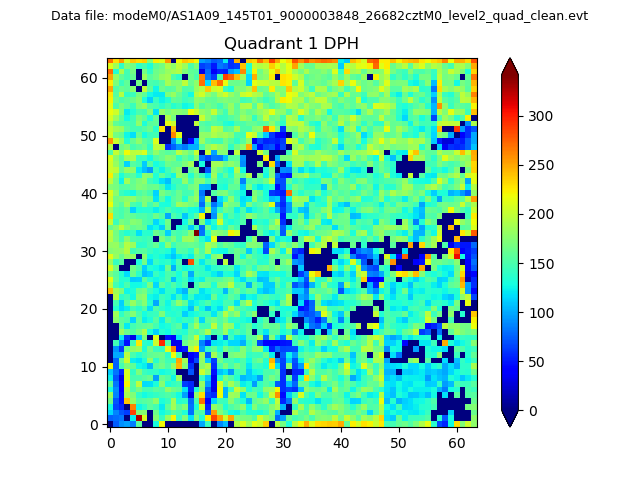 |
Quadrant B |
|---|---|---|---|
| Quadrant D | 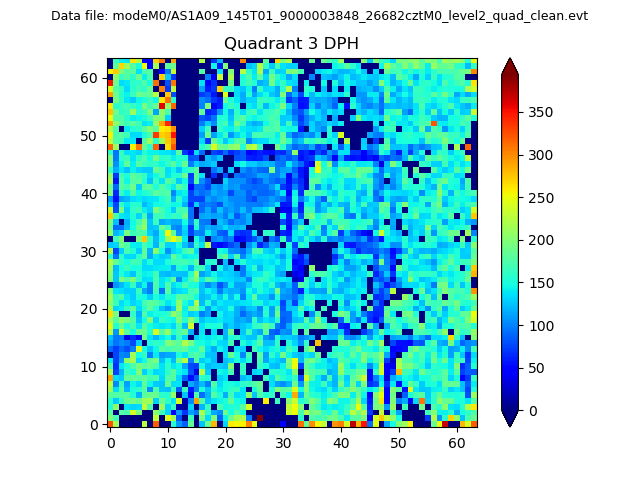 |
 |
Quadrant C |
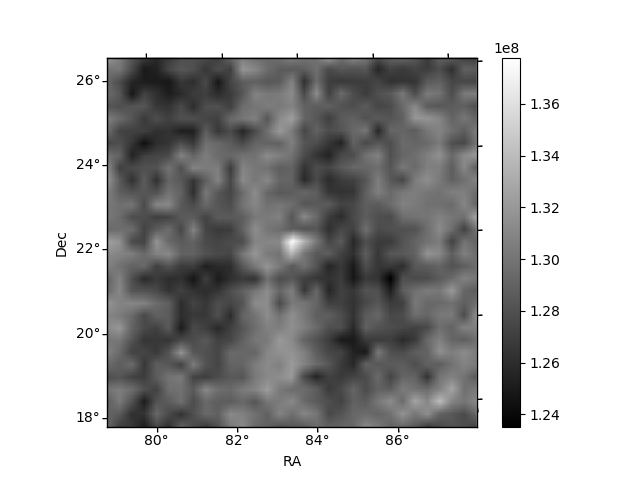
| Plot type | Count rate plots | Images |
|---|---|---|
| Comparison with Poisson distribution Blue bars denote a histogram of data divided into 1 sec bins. Red curve is a Poisson curve with rate = median count rate of data. |
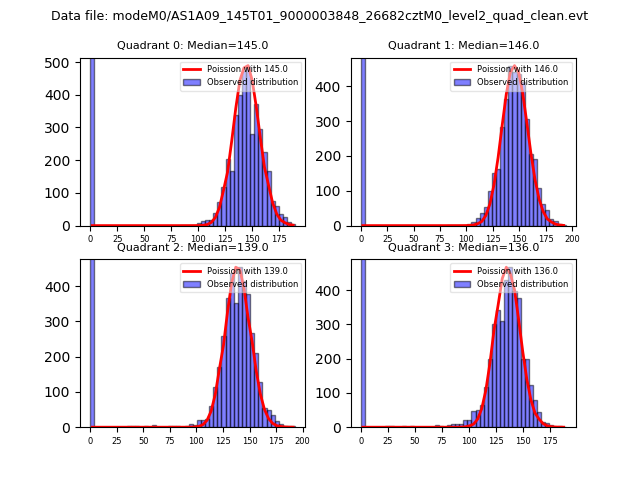 |
 |
| Quadrant-wise count rates Data is divided into 100 sec bins |
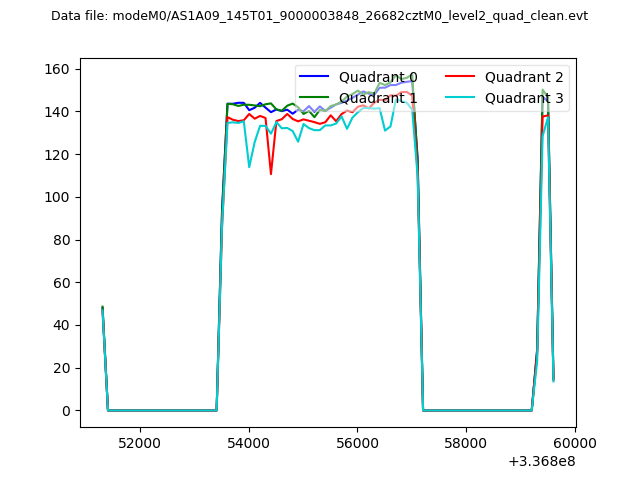 |
|
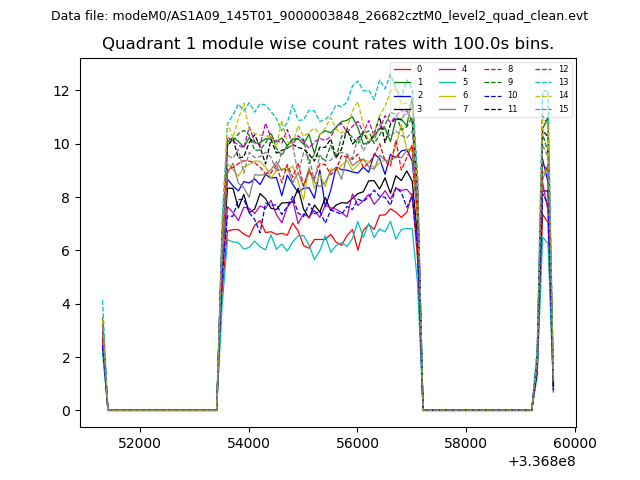
| Module-wise count rates for Quadrant A Data is divided into 100 sec bins |
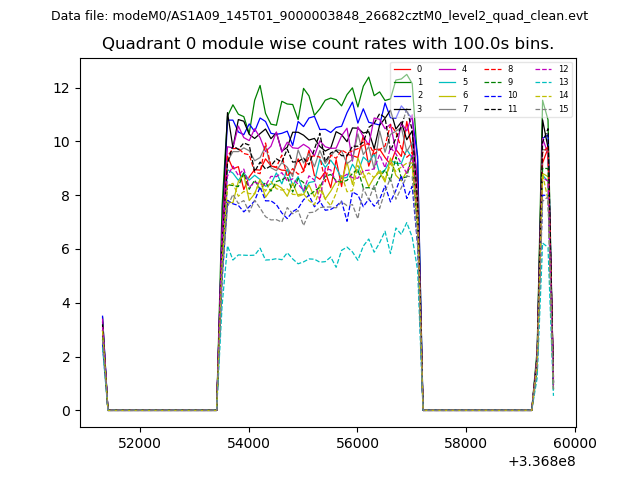 |
 |
| Module-wise count rates for Quadrant B Data is divided into 100 sec bins |
 |
 |
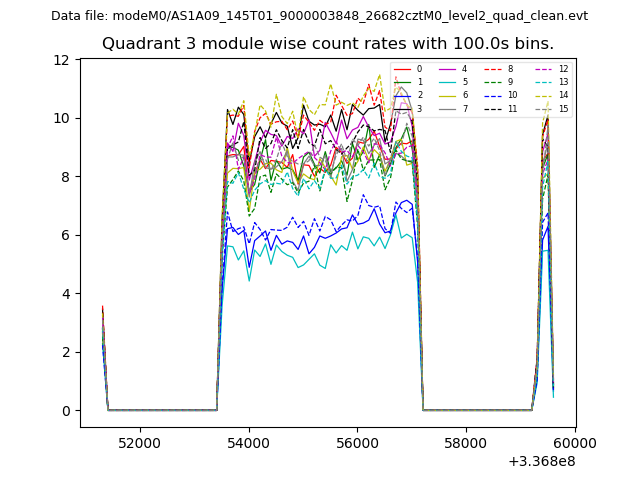
| Module-wise count rates for Quadrant C Data is divided into 100 sec bins |
 |
 |
| Module-wise count rates for Quadrant D Data is divided into 100 sec bins |
 |
 |
| Parameter | Plot |
|---|---|
| CZT HV Monitor | 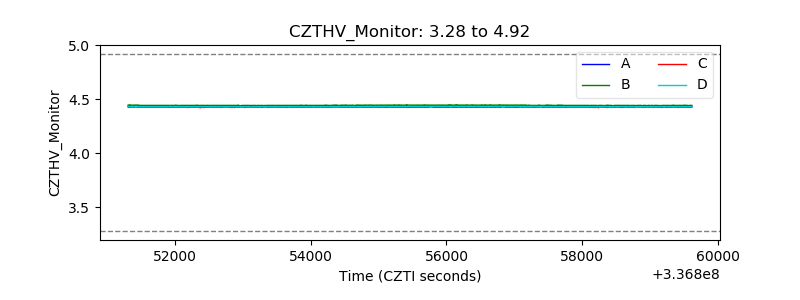 |
| D_VDD | 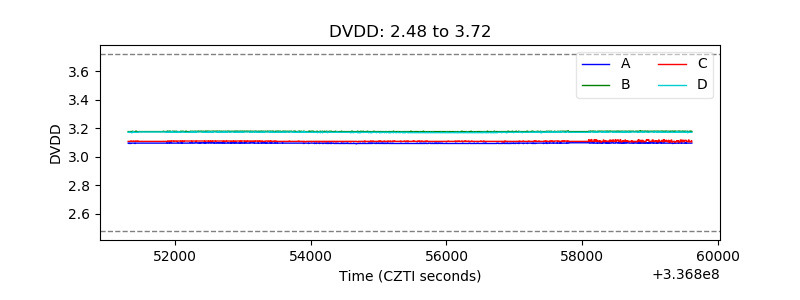 |
| Temperature 1 | 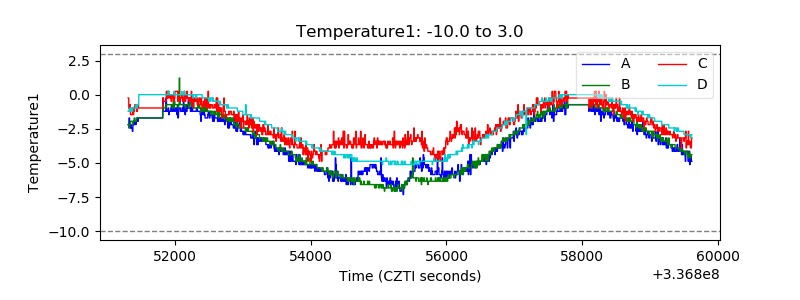 |
| Veto HV Monitor | 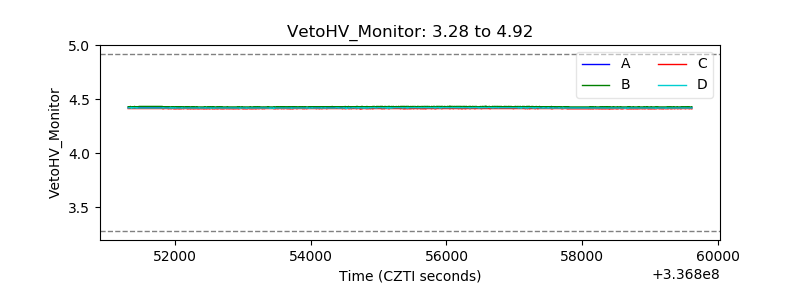 |
| Veto LLD | 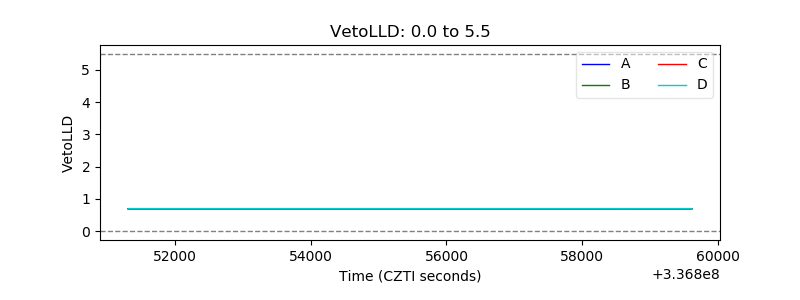 |
| Alpha Counter |  |
| _CPM_Rate | 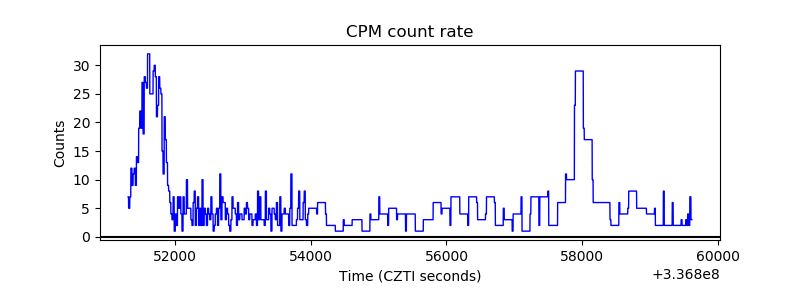 |
| CZT Counter | 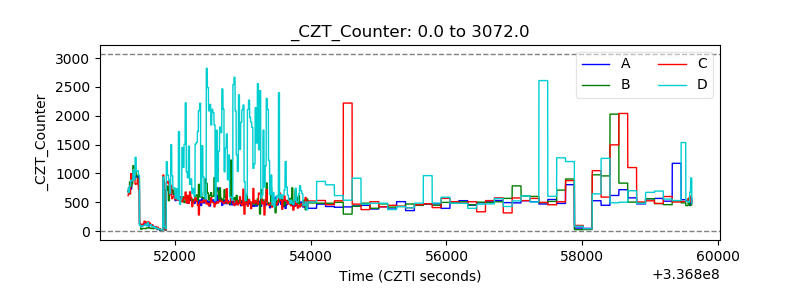 |
| +2.5 Volts monitor | 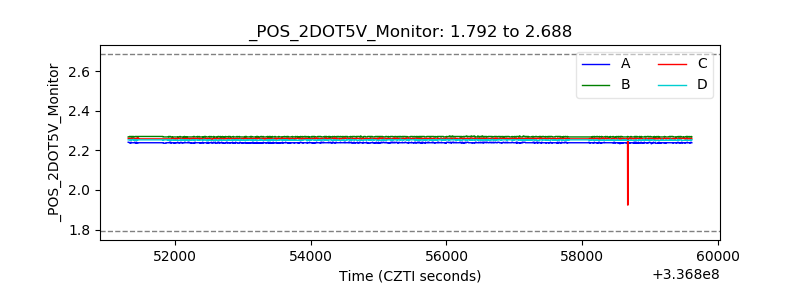 |
| +5 Volts monitor |  |
| _ROLL_ROT | 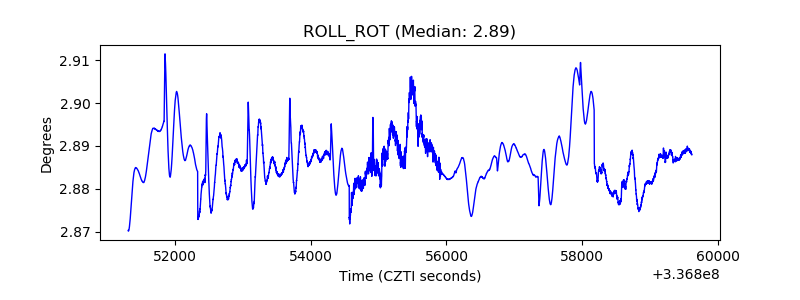 |
| _Roll_DEC | 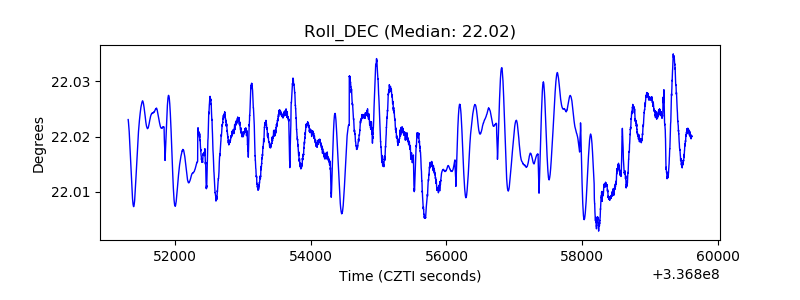 |
| _Roll_RA | 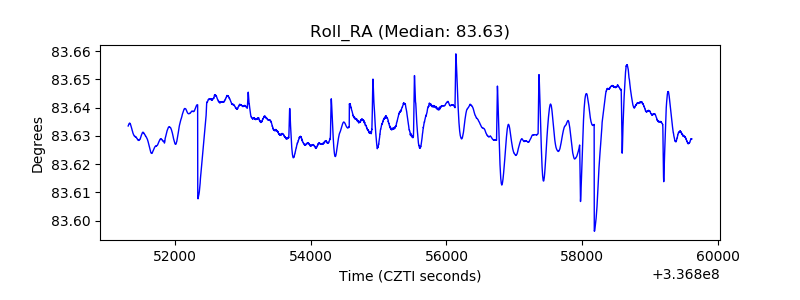 |
| Veto Counter | 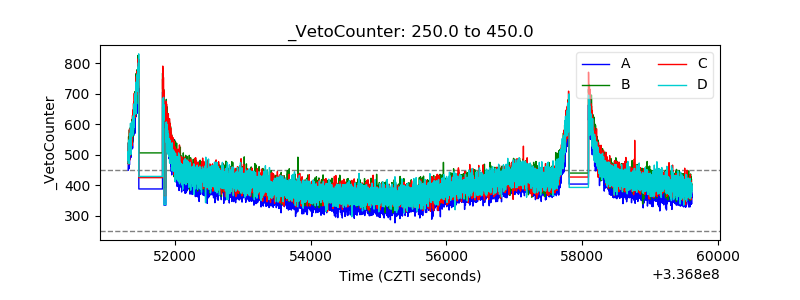 |