| Param | Original file | Final file |
|---|---|---|
| Filename | modeM0/AS1A09_145T01_9000003848_26683cztM0_level2.evt | modeM0/AS1A09_145T01_9000003848_26683cztM0_level2_quad_clean.evt |
| Size (bytes) | 566,616,960 | 97,655,040 |
| Size | 540.4 MB | 93.1 MB |
| Events in quadrant A | 3,568,971 | 634,087 |
| Events in quadrant B | 3,740,641 | 636,493 |
| Events in quadrant C | 3,899,757 | 608,794 |
| Events in quadrant D | 5,467,268 | 581,444 |
| Mode M0 | |||
|---|---|---|---|
| Quadrant | BADHDUFLAG | Total packets | Discarded packets |
| A | 0 | 14886 | 0 |
| B | 0 | 15457 | 0 |
| C | 0 | 15847 | 0 |
| D | 0 | 21026 | 0 |
| Mode M9 | |||
|---|---|---|---|
| Quadrant | BADHDUFLAG | Total packets | Discarded packets |
| A | 0 | 4 | 0 |
| B | 0 | 4 | 0 |
| C | 0 | 4 | 0 |
| D | 0 | 4 | 0 |
| Quadrant | Total seconds | Saturated seconds | Saturation percentage |
|---|---|---|---|
| A | 7124 | 45 | 0.631668% |
| B | 7125 | 70 | 0.982456% |
| C | 7125 | 152 | 2.133333% |
| D | 7125 | 638 | 8.954386% |
Noise dominated data is calculated using 1-second bins in cleaned event files. If a bin has >2000 counts, and if more than 50% of those come from <1% of pixels, then it is considered to be noise-dominated and hence unusable.
| Quadrant | # 1 sec bins | Bins with >0 counts | Bins with >2000 counts | High rate bins dominated by noise | Noise dominated (total time) | Noise dominated (detector-on time) | Marked lightcurve |
|---|---|---|---|---|---|---|---|
| A | 7574 | 7125 | 1 | 1 | 0.01% | 0.01% | 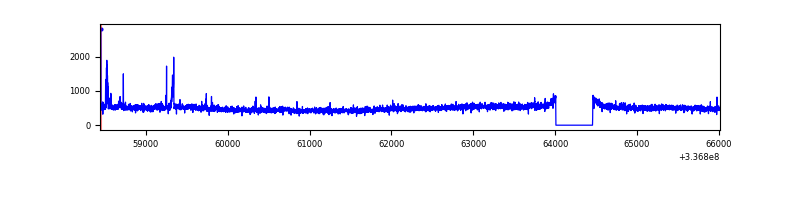 |
| B | 7575 | 7126 | 3 | 3 | 0.04% | 0.04% | 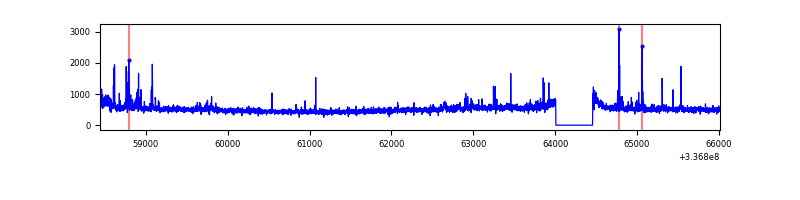 |
| C | 7575 | 7126 | 21 | 21 | 0.28% | 0.29% | 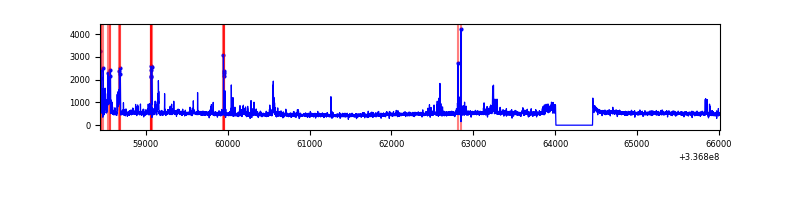 |
| D | 7575 | 7126 | 380 | 380 | 5.02% | 5.33% | 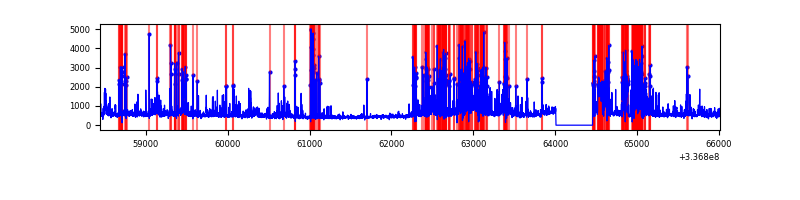 |
Top three noisy pixels from each quadrant. If the there are fewer than three noisy pixels in the level2.evt file, extra rows are filled as -1
| Pixel properties | Quadrant properties | ||||||
|---|---|---|---|---|---|---|---|
| Quadrant | DetID | PixID | Counts | Sigma | Mean | Median | Sigma |
| A | 4 | 2 | 89143 | 484.64 | 893 | 878 | 182.1 |
| A | 0 | 13 | 34683 | 185.61 | 893 | 878 | 182.1 |
| A | 13 | 254 | 12517 | 63.91 | 893 | 878 | 182.1 |
| B | 0 | 189 | 115813 | 682.95 | 887 | 868 | 168.3 |
| B | 5 | 172 | 78081 | 458.77 | 887 | 868 | 168.3 |
| B | 12 | 111 | 19891 | 113.03 | 887 | 868 | 168.3 |
| C | 3 | 233 | 236705 | 1172.49 | 850 | 857 | 201.2 |
| C | 14 | 238 | 136631 | 674.98 | 850 | 857 | 201.2 |
| C | 2 | 16 | 99916 | 492.46 | 850 | 857 | 201.2 |
| D | 7 | 80 | 1102975 | 5349.33 | 834 | 811 | 206.0 |
| D | 2 | 250 | 497767 | 2411.97 | 834 | 811 | 206.0 |
| D | 1 | 52 | 492323 | 2385.54 | 834 | 811 | 206.0 |
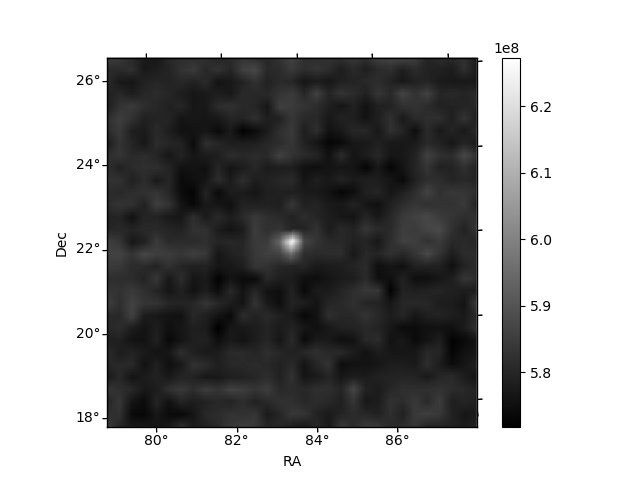
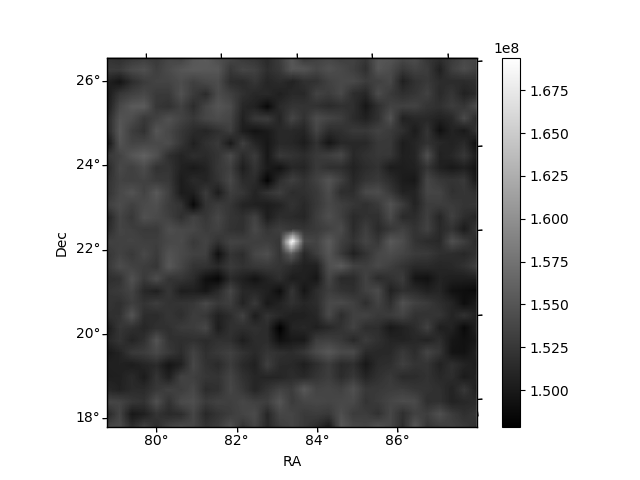
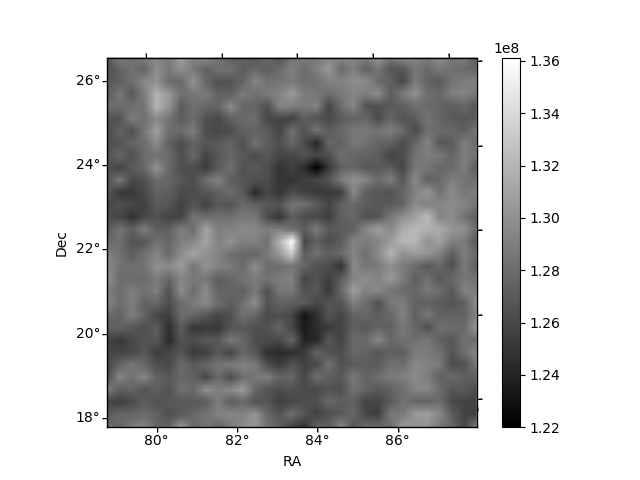
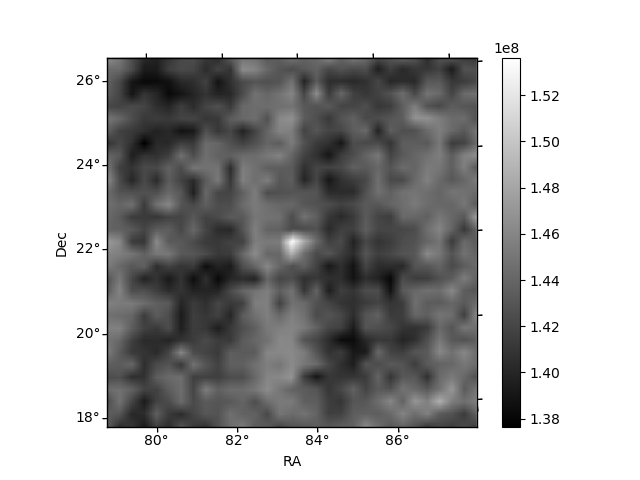
Histogram calculated using DETX and DETY for each event in the final _common_clean file
| Quadrant A | 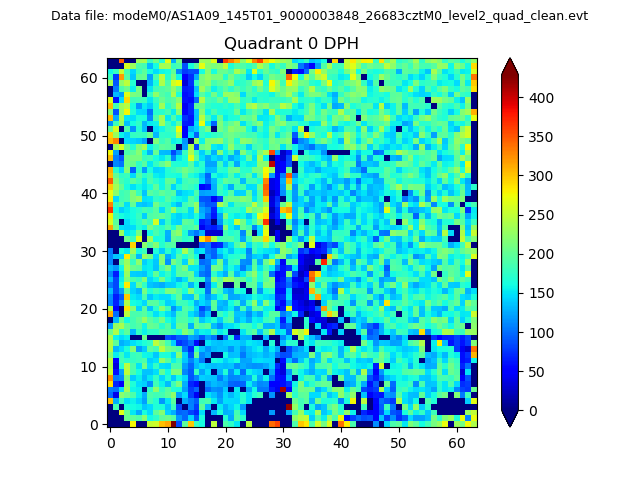 |
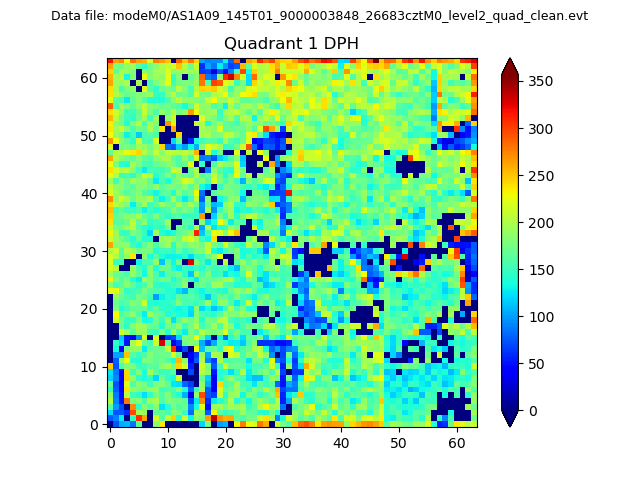 |
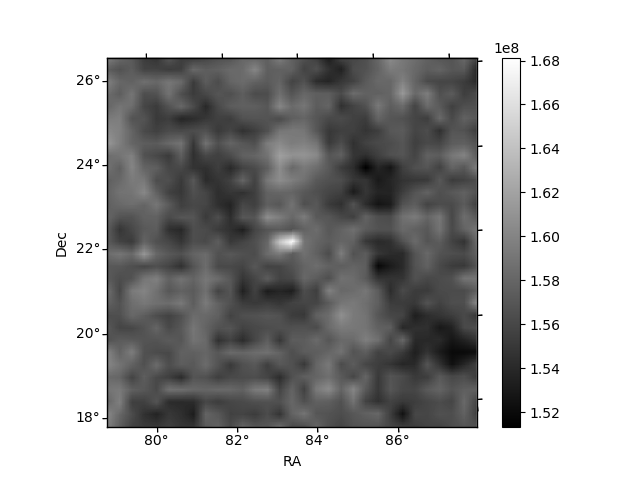
Quadrant B |
|---|---|---|---|
| Quadrant D | 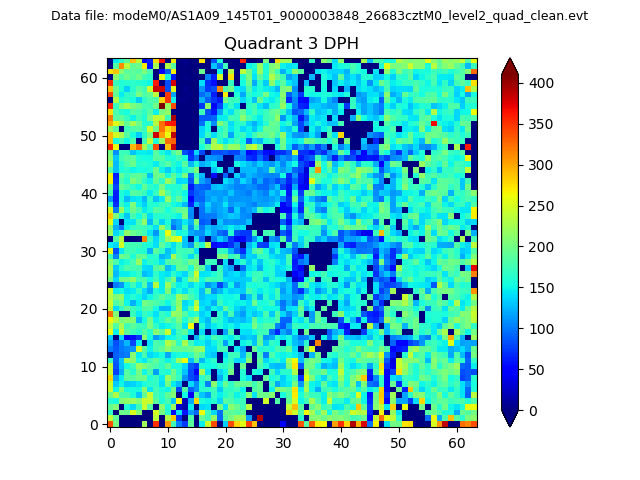 |
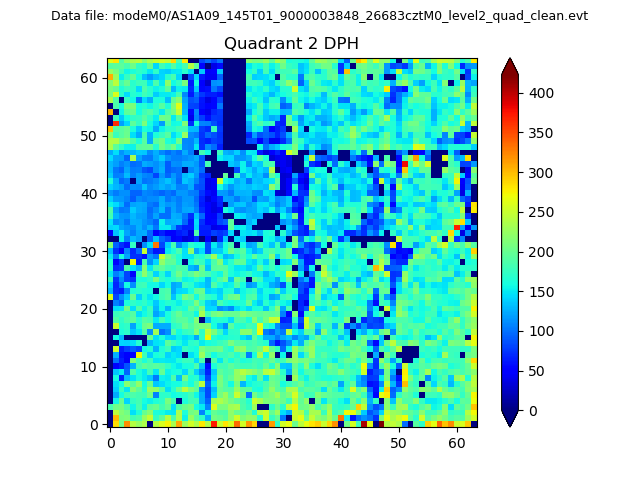 |
Quadrant C |
| Plot type | Count rate plots | Images |
|---|---|---|
| Comparison with Poisson distribution Blue bars denote a histogram of data divided into 1 sec bins. Red curve is a Poisson curve with rate = median count rate of data. |
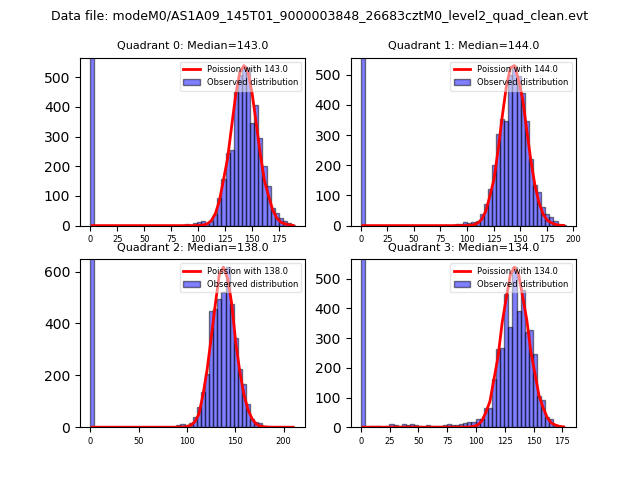 |
 |
| Quadrant-wise count rates Data is divided into 100 sec bins |
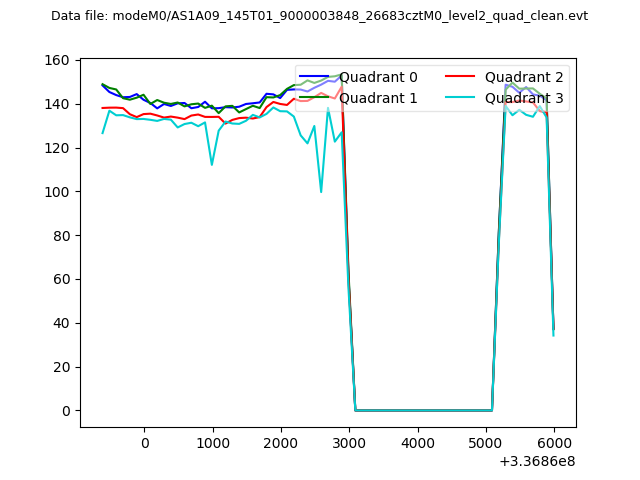 |
|
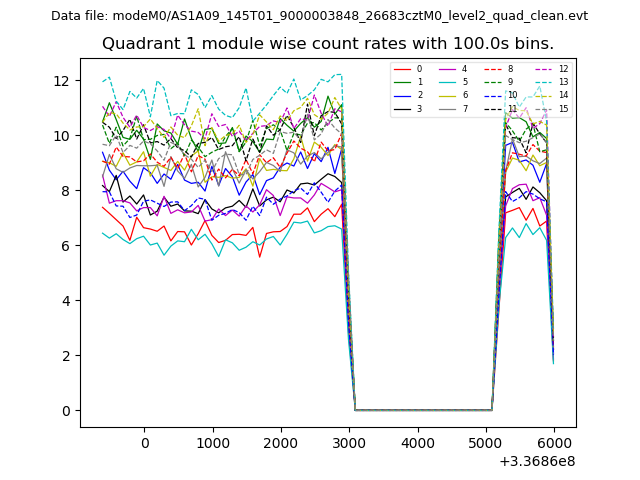
| Module-wise count rates for Quadrant A Data is divided into 100 sec bins |
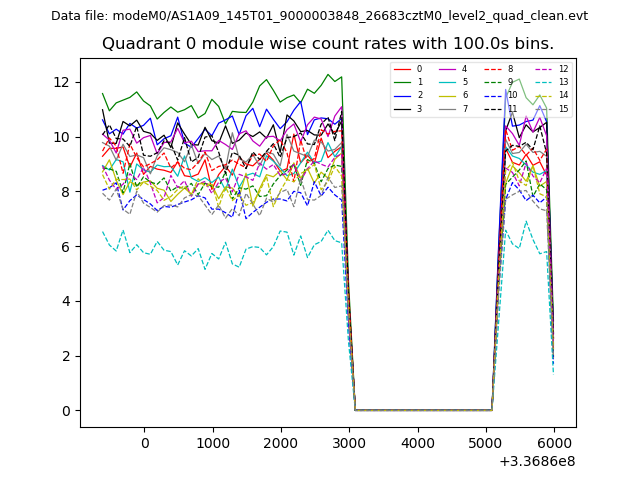 |
 |
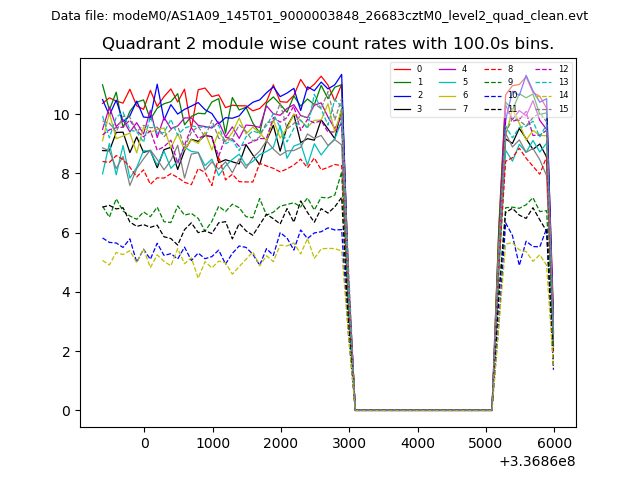
| Module-wise count rates for Quadrant B Data is divided into 100 sec bins |
 |
 |
| Module-wise count rates for Quadrant C Data is divided into 100 sec bins |
 |
 |
| Module-wise count rates for Quadrant D Data is divided into 100 sec bins |
 |
 |
| Parameter | Plot |
|---|---|
| CZT HV Monitor | 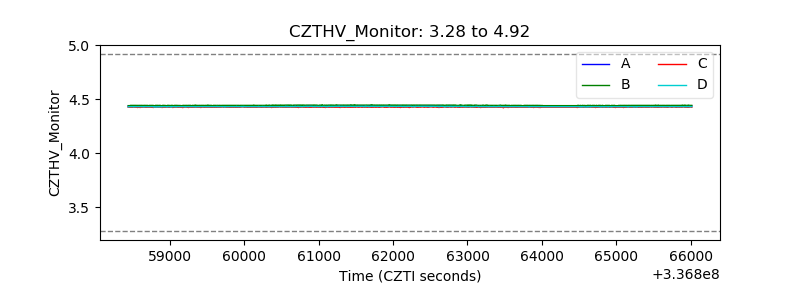 |
| D_VDD | 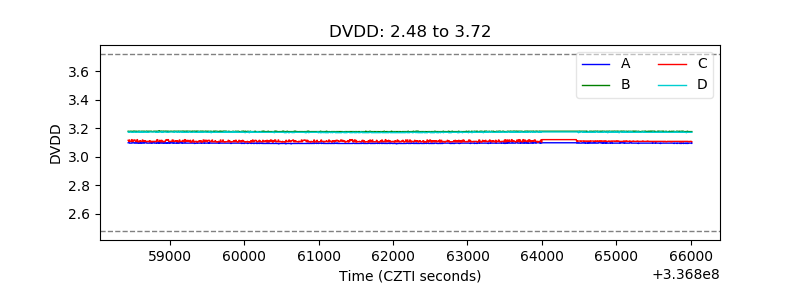 |
| Temperature 1 | 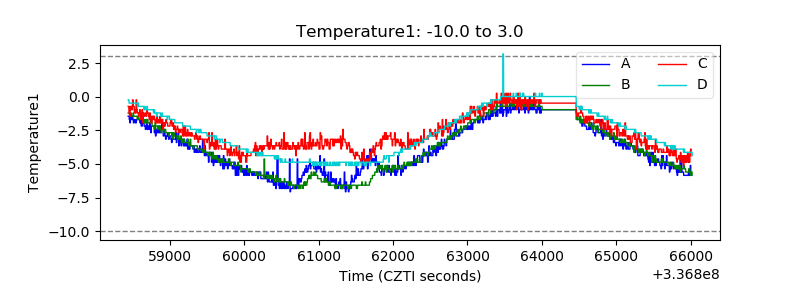 |
| Veto HV Monitor | 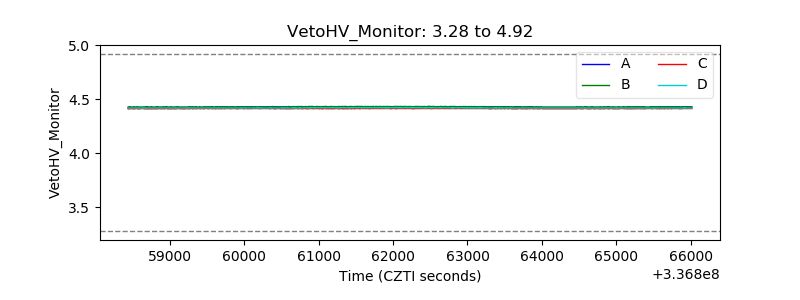 |
| Veto LLD | 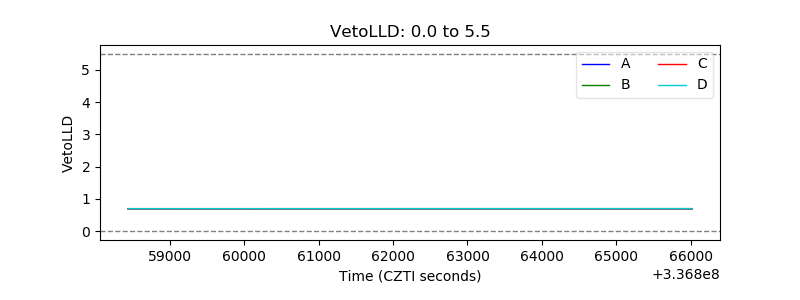 |
| Alpha Counter |  |
| _CPM_Rate | 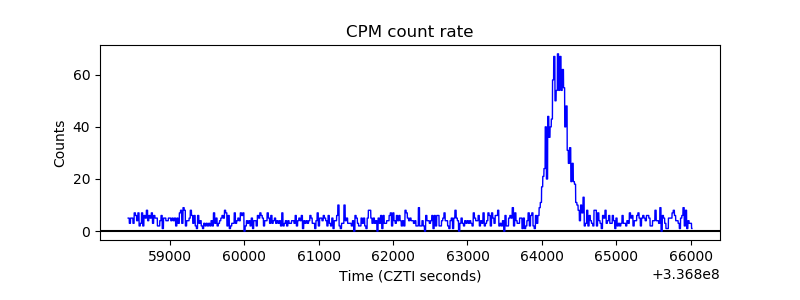 |
| CZT Counter | 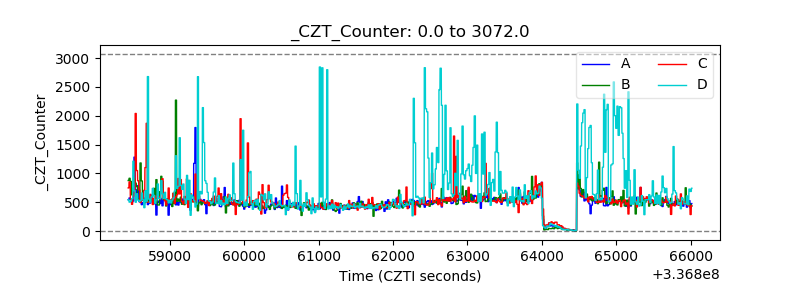 |
| +2.5 Volts monitor |  |
| +5 Volts monitor | 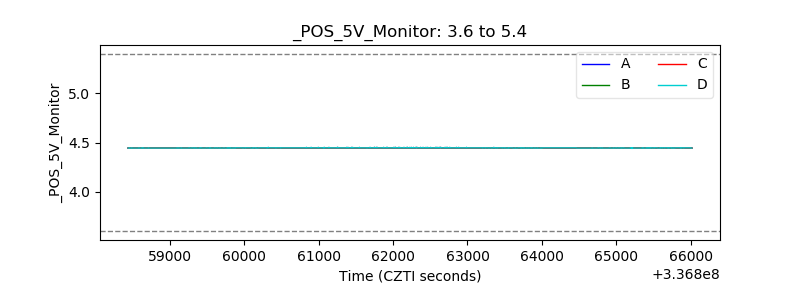 |
| _ROLL_ROT |  |
| _Roll_DEC | 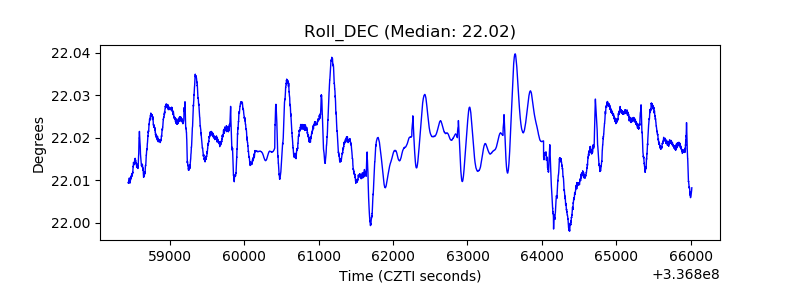 |
| _Roll_RA | 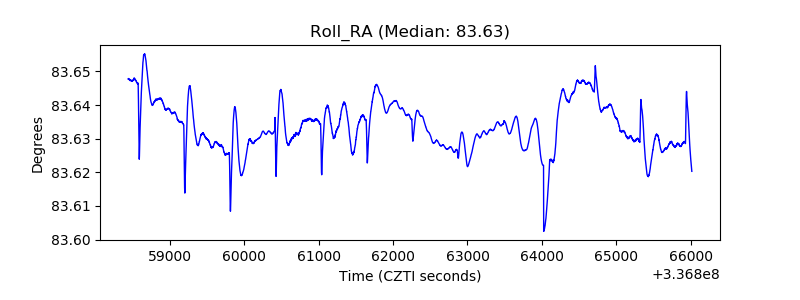 |
| Veto Counter | 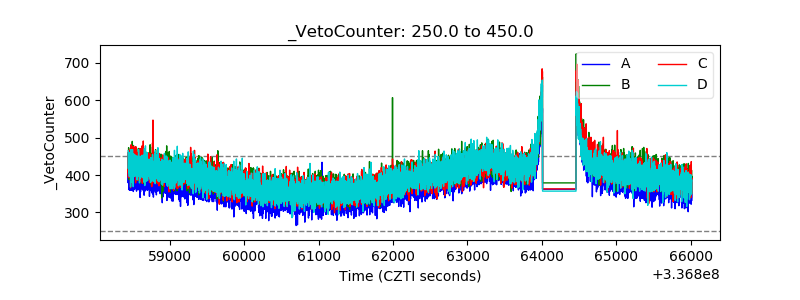 |