| Param | Original file | Final file |
|---|---|---|
| Filename | modeM0/AS1A09_145T01_9000003848_26685cztM0_level2.evt | modeM0/AS1A09_145T01_9000003848_26685cztM0_level2_quad_clean.evt |
| Size (bytes) | 768,772,800 | 136,244,160 |
| Size | 733.2 MB | 129.9 MB |
| Events in quadrant A | 4,069,488 | 920,923 |
| Events in quadrant B | 8,158,188 | 864,213 |
| Events in quadrant C | 4,287,190 | 890,141 |
| Events in quadrant D | 6,183,240 | 851,589 |
| Mode M0 | |||
|---|---|---|---|
| Quadrant | BADHDUFLAG | Total packets | Discarded packets |
| A | 0 | 17621 | 0 |
| B | 0 | 29870 | 0 |
| C | 0 | 18000 | 0 |
| D | 0 | 24226 | 0 |
| Mode M9 | |||
|---|---|---|---|
| Quadrant | BADHDUFLAG | Total packets | Discarded packets |
| A | 0 | 8 | 0 |
| B | 0 | 9 | 1 |
| C | 0 | 9 | 0 |
| D | 0 | 9 | 0 |
| Quadrant | Total seconds | Saturated seconds | Saturation percentage |
|---|---|---|---|
| A | 8605 | 38 | 0.441604% |
| B | 8570 | 1176 | 13.722287% |
| C | 8585 | 98 | 1.141526% |
| D | 8541 | 586 | 6.861023% |
Noise dominated data is calculated using 1-second bins in cleaned event files. If a bin has >2000 counts, and if more than 50% of those come from <1% of pixels, then it is considered to be noise-dominated and hence unusable.
| Quadrant | # 1 sec bins | Bins with >0 counts | Bins with >2000 counts | High rate bins dominated by noise | Noise dominated (total time) | Noise dominated (detector-on time) | Marked lightcurve |
|---|---|---|---|---|---|---|---|
| A | 10004 | 9012 | 2 | 2 | 0.02% | 0.02% | 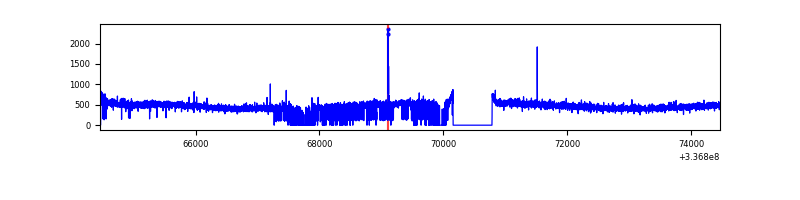 |
| B | 10004 | 8990 | 928 | 928 | 9.28% | 10.32% | 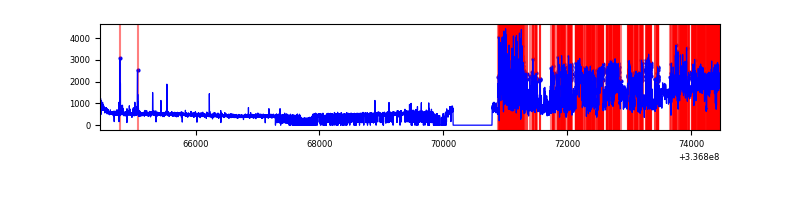 |
| C | 10004 | 8970 | 5 | 5 | 0.05% | 0.06% | 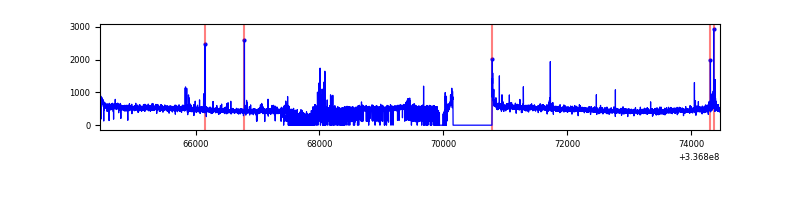 |
| D | 10004 | 8965 | 419 | 419 | 4.19% | 4.67% | 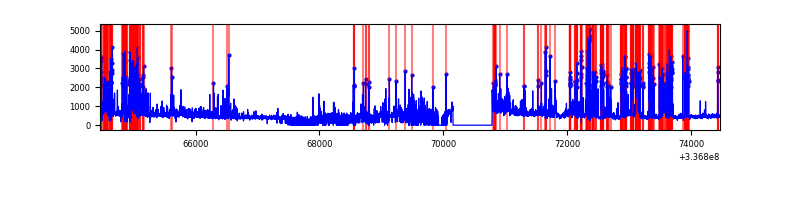 |
Top three noisy pixels from each quadrant. If the there are fewer than three noisy pixels in the level2.evt file, extra rows are filled as -1
| Pixel properties | Quadrant properties | ||||||
|---|---|---|---|---|---|---|---|
| Quadrant | DetID | PixID | Counts | Sigma | Mean | Median | Sigma |
| A | 0 | 13 | 27424 | 124.0 | 1045 | 1028 | 212.9 |
| A | 13 | 254 | 15186 | 66.51 | 1045 | 1028 | 212.9 |
| A | 3 | 137 | 9424 | 39.44 | 1045 | 1028 | 212.9 |
| B | 0 | 189 | 4163143 | 21725.05 | 1002 | 981 | 191.6 |
| B | 5 | 172 | 28730 | 144.84 | 1002 | 981 | 191.6 |
| B | 12 | 111 | 22509 | 112.37 | 1002 | 981 | 191.6 |
| C | 14 | 238 | 161481 | 676.93 | 1002 | 1012 | 237.1 |
| C | 15 | 208 | 82054 | 341.87 | 1002 | 1012 | 237.1 |
| C | 3 | 233 | 65810 | 273.35 | 1002 | 1012 | 237.1 |
| D | 7 | 80 | 1043572 | 4288.41 | 981 | 953 | 243.1 |
| D | 1 | 52 | 732121 | 3007.38 | 981 | 953 | 243.1 |
| D | 2 | 250 | 461935 | 1896.07 | 981 | 953 | 243.1 |
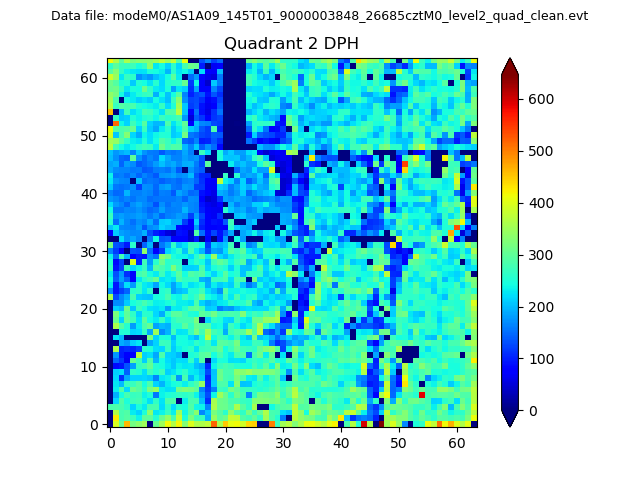
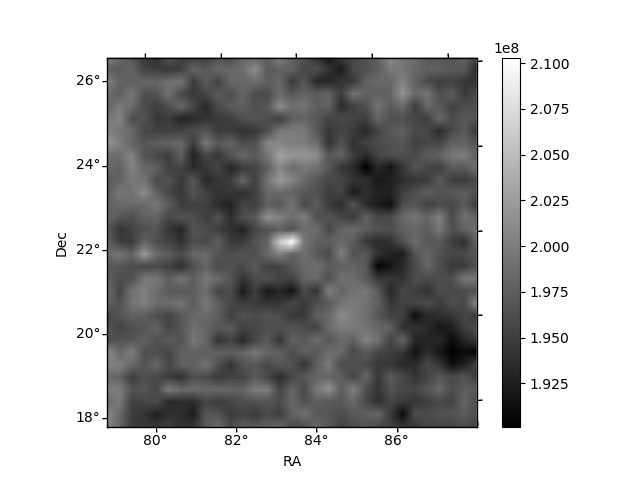
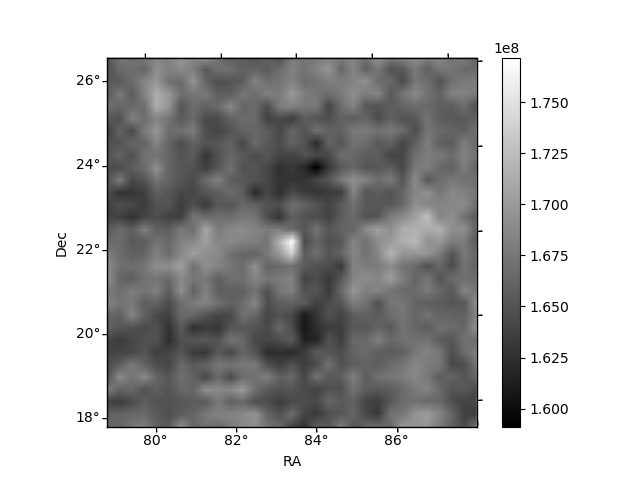
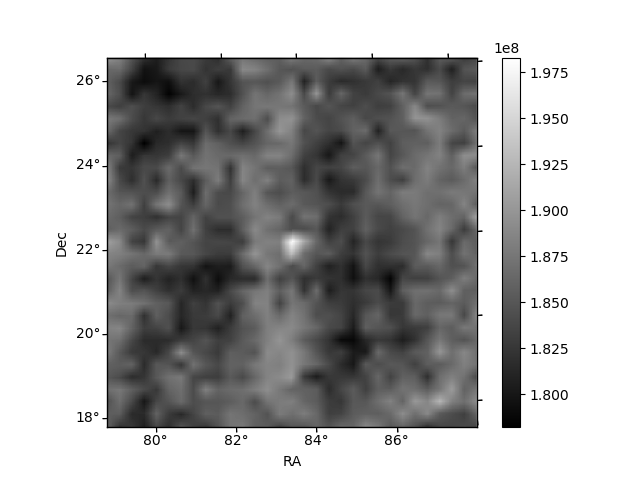
Histogram calculated using DETX and DETY for each event in the final _common_clean file
| Quadrant A | 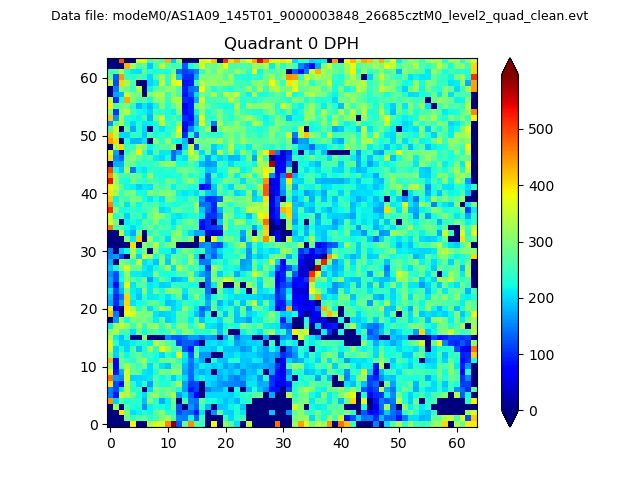 |
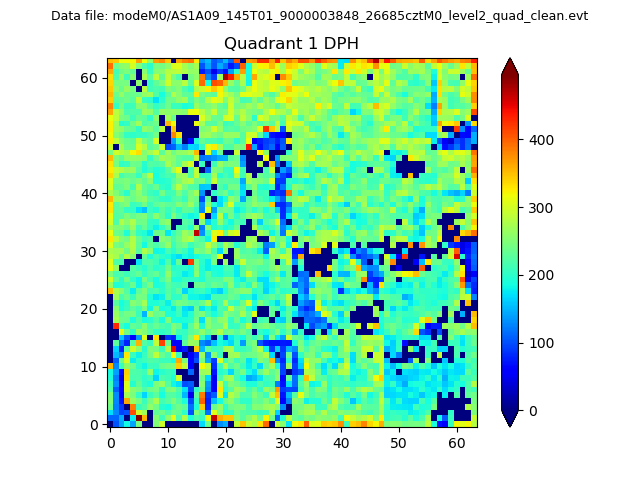 |
Quadrant B |
|---|---|---|---|
| Quadrant D | 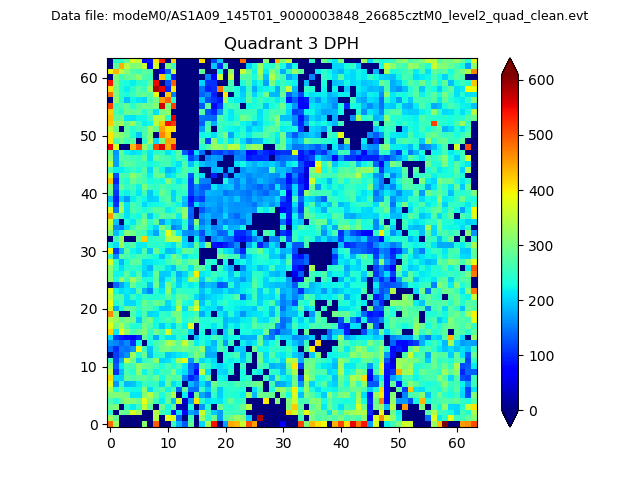 |
 |
Quadrant C |
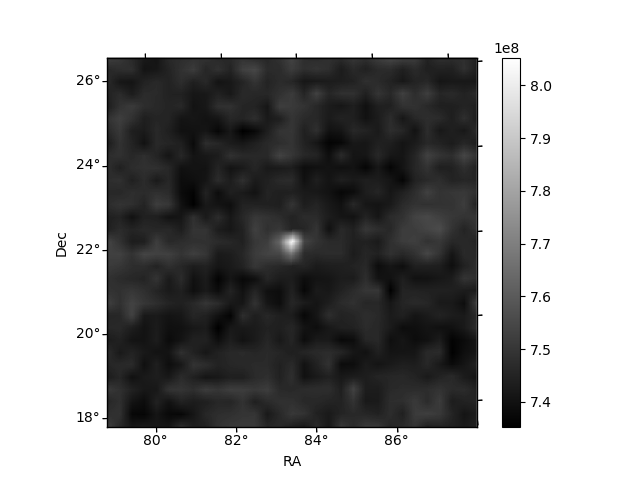
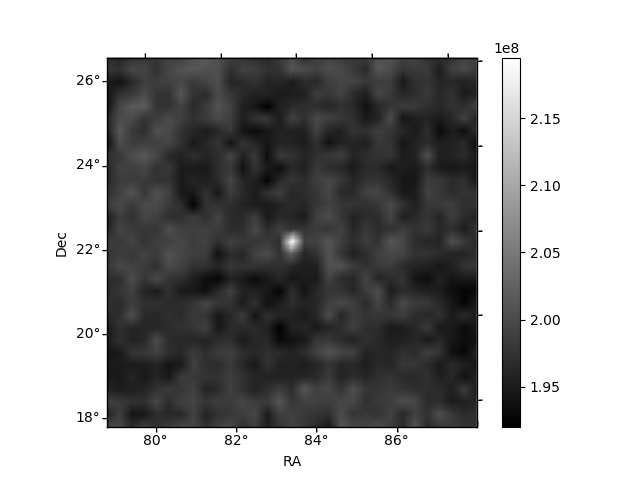
| Plot type | Count rate plots | Images |
|---|---|---|
| Comparison with Poisson distribution Blue bars denote a histogram of data divided into 1 sec bins. Red curve is a Poisson curve with rate = median count rate of data. |
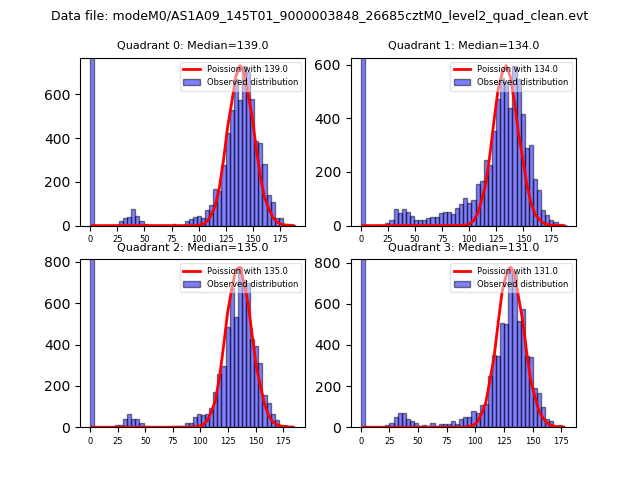 |
 |
| Quadrant-wise count rates Data is divided into 100 sec bins |
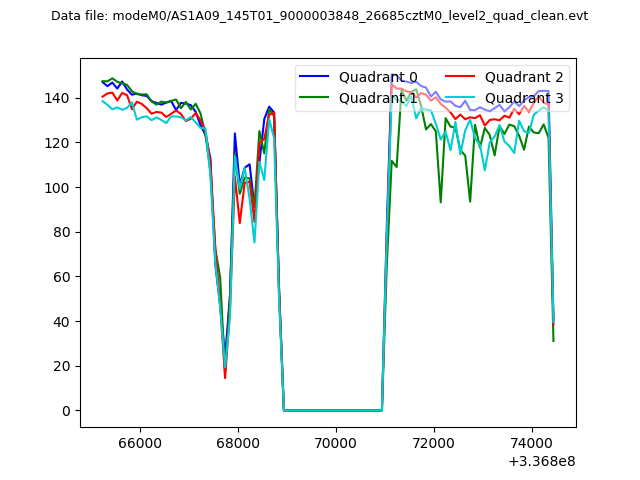 |
|
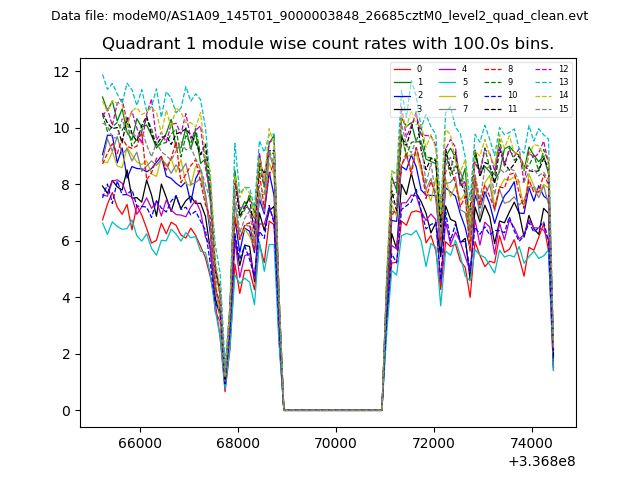
| Module-wise count rates for Quadrant A Data is divided into 100 sec bins |
 |
 |
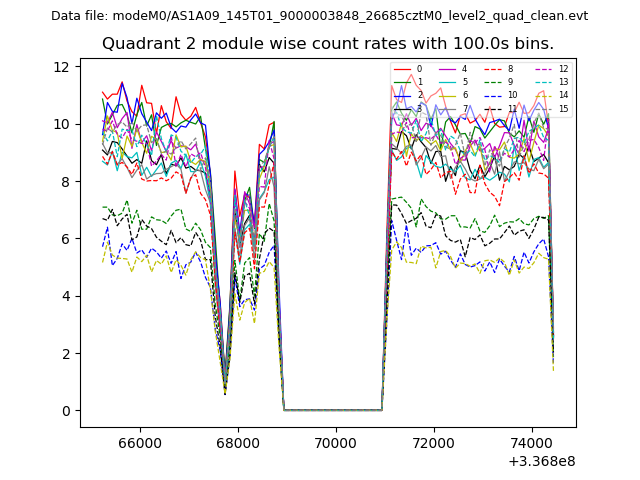
| Module-wise count rates for Quadrant B Data is divided into 100 sec bins |
 |
 |
| Module-wise count rates for Quadrant C Data is divided into 100 sec bins |
 |
 |
| Module-wise count rates for Quadrant D Data is divided into 100 sec bins |
 |
 |
| Parameter | Plot |
|---|---|
| CZT HV Monitor | 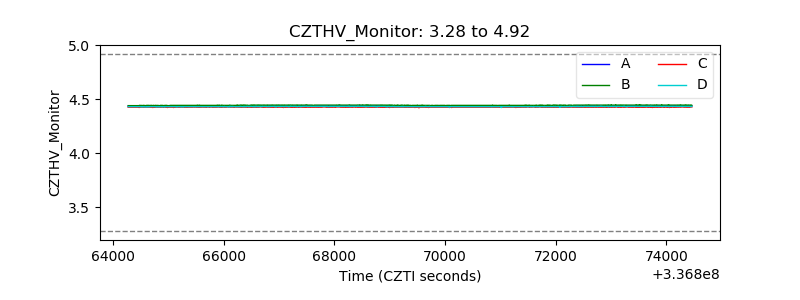 |
| D_VDD | 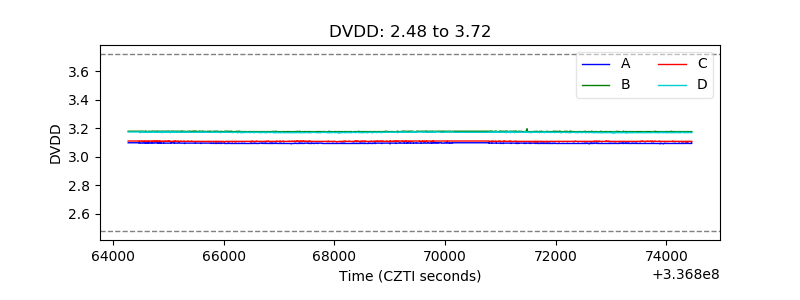 |
| Temperature 1 | 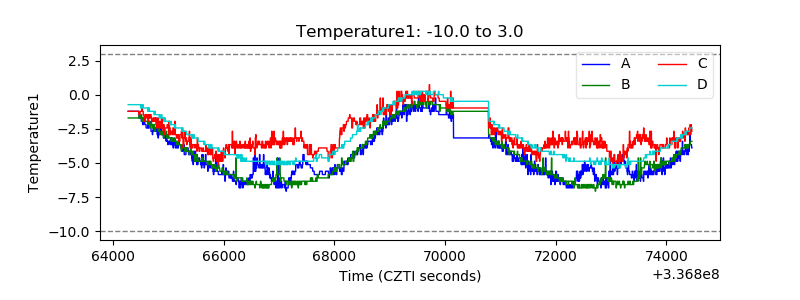 |
| Veto HV Monitor | 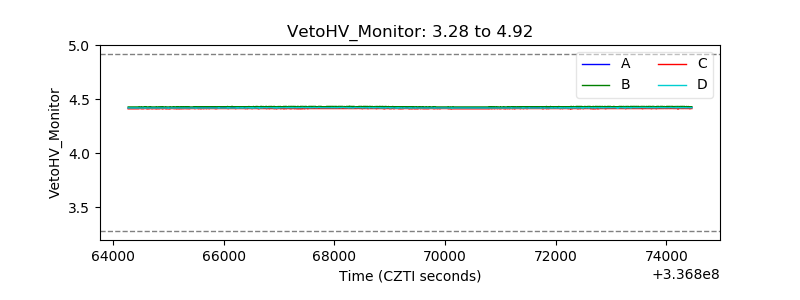 |
| Veto LLD | 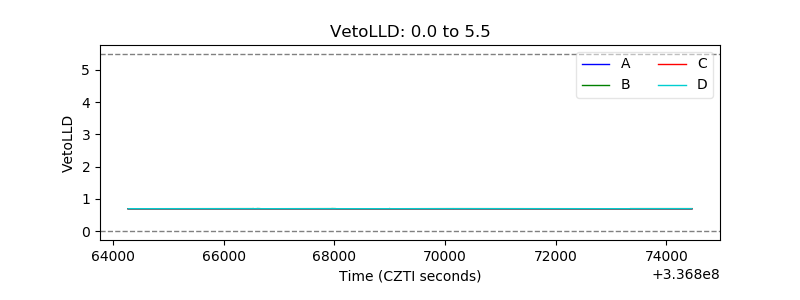 |
| Alpha Counter | 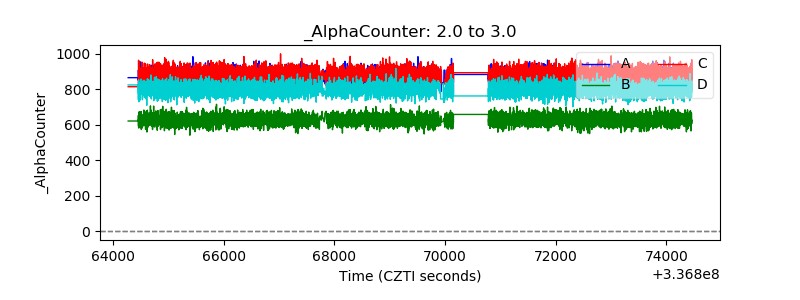 |
| _CPM_Rate | 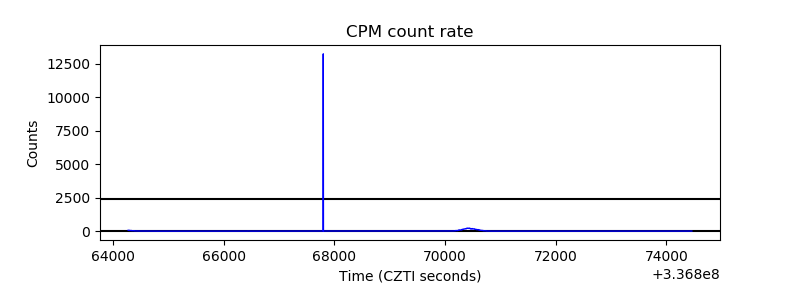 |
| CZT Counter | 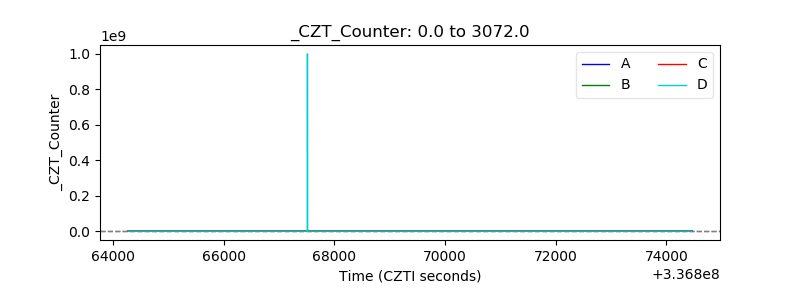 |
| +2.5 Volts monitor |  |
| +5 Volts monitor |  |
| _ROLL_ROT | 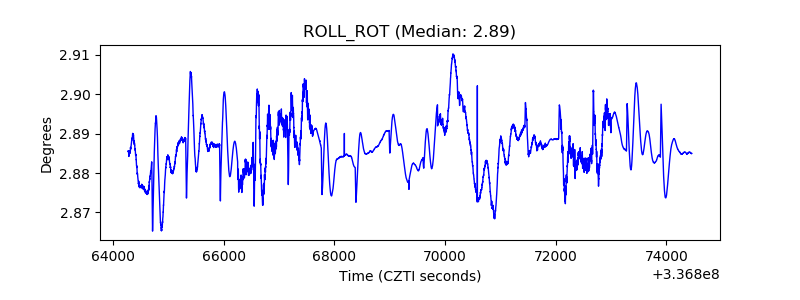 |
| _Roll_DEC | 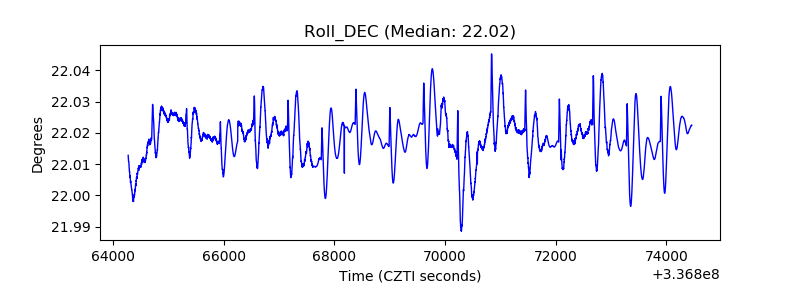 |
| _Roll_RA | 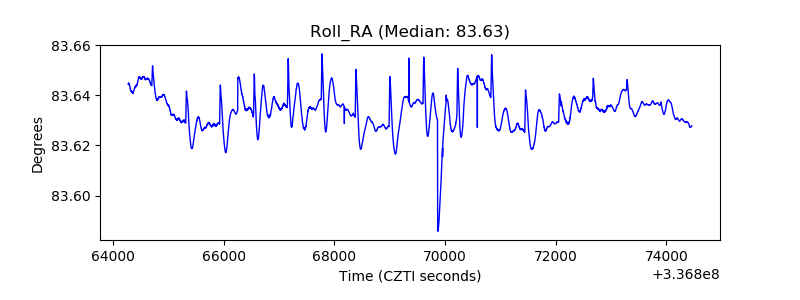 |
| Veto Counter | 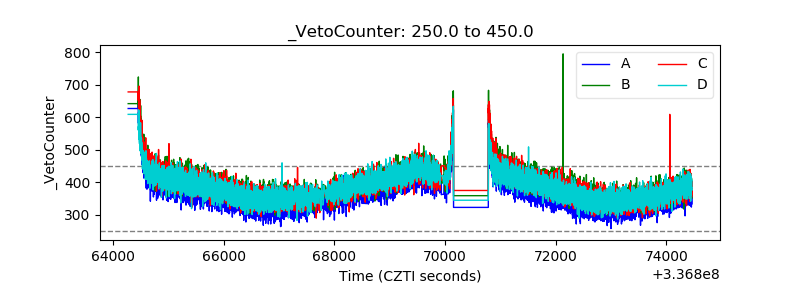 |