| Param | Original file | Final file |
|---|---|---|
| Filename | modeM0/AS1A09_145T01_9000003848_26686cztM0_level2.evt | modeM0/AS1A09_145T01_9000003848_26686cztM0_level2_quad_clean.evt |
| Size (bytes) | 1,098,305,280 | 189,351,360 |
| Size | 1.0 GB | 180.6 MB |
| Events in quadrant A | 6,054,583 | 1,278,696 |
| Events in quadrant B | 10,558,274 | 1,184,993 |
| Events in quadrant C | 6,506,091 | 1,239,591 |
| Events in quadrant D | 9,302,280 | 1,170,658 |
| Mode M0 | |||
|---|---|---|---|
| Quadrant | BADHDUFLAG | Total packets | Discarded packets |
| A | 0 | 25720 | 0 |
| B | 0 | 39474 | 0 |
| C | 0 | 26750 | 0 |
| D | 0 | 36281 | 0 |
| Mode M9 | |||
|---|---|---|---|
| Quadrant | BADHDUFLAG | Total packets | Discarded packets |
| A | 0 | 16 | 0 |
| B | 0 | 16 | 0 |
| C | 0 | 16 | 0 |
| D | 0 | 16 | 0 |
| Quadrant | Total seconds | Saturated seconds | Saturation percentage |
|---|---|---|---|
| A | 12442 | 60 | 0.482238% |
| B | 12444 | 2083 | 16.738991% |
| C | 12444 | 172 | 1.382192% |
| D | 12444 | 985 | 7.915461% |
Noise dominated data is calculated using 1-second bins in cleaned event files. If a bin has >2000 counts, and if more than 50% of those come from <1% of pixels, then it is considered to be noise-dominated and hence unusable.
| Quadrant | # 1 sec bins | Bins with >0 counts | Bins with >2000 counts | High rate bins dominated by noise | Noise dominated (total time) | Noise dominated (detector-on time) | Marked lightcurve |
|---|---|---|---|---|---|---|---|
| A | 19598 | 12444 | 0 | 0 | 0.00% | 0.00% | 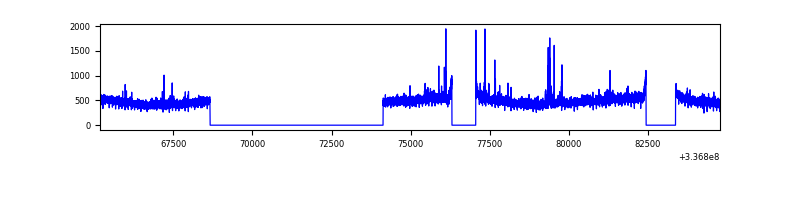 |
| B | 19599 | 12446 | 1606 | 1606 | 8.19% | 12.90% | 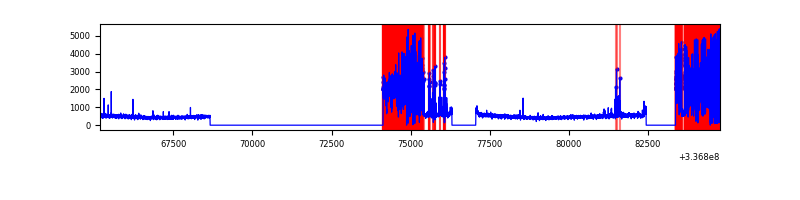 |
| C | 19599 | 12446 | 24 | 24 | 0.12% | 0.19% | 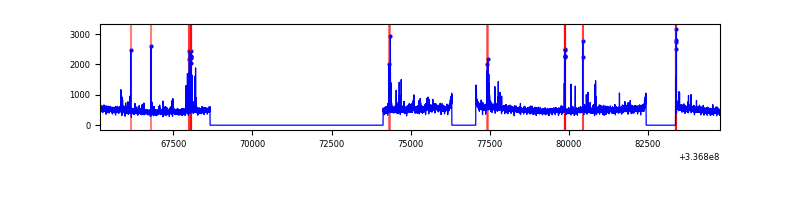 |
| D | 19599 | 12445 | 738 | 738 | 3.77% | 5.93% | 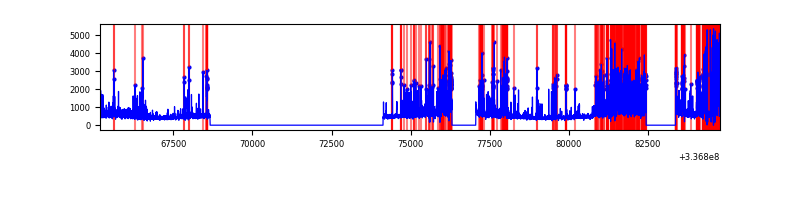 |
Top three noisy pixels from each quadrant. If the there are fewer than three noisy pixels in the level2.evt file, extra rows are filled as -1
| Pixel properties | Quadrant properties | ||||||
|---|---|---|---|---|---|---|---|
| Quadrant | DetID | PixID | Counts | Sigma | Mean | Median | Sigma |
| A | 0 | 13 | 93723 | 296.98 | 1538 | 1513 | 310.5 |
| A | 13 | 254 | 20553 | 61.32 | 1538 | 1513 | 310.5 |
| A | 6 | 16 | 18968 | 56.22 | 1538 | 1513 | 310.5 |
| B | 0 | 189 | 4845812 | 18102.94 | 1411 | 1383 | 267.6 |
| B | 10 | 247 | 69440 | 254.32 | 1411 | 1383 | 267.6 |
| B | 4 | 80 | 40519 | 146.25 | 1411 | 1383 | 267.6 |
| C | 14 | 238 | 237004 | 680.67 | 1471 | 1484 | 346.0 |
| C | 15 | 208 | 215966 | 619.87 | 1471 | 1484 | 346.0 |
| C | 5 | 37 | 213526 | 612.82 | 1471 | 1484 | 346.0 |
| D | 7 | 80 | 1659853 | 4750.31 | 1434 | 1397 | 349.1 |
| D | 1 | 52 | 1361433 | 3895.55 | 1434 | 1397 | 349.1 |
| D | 2 | 250 | 443521 | 1266.37 | 1434 | 1397 | 349.1 |
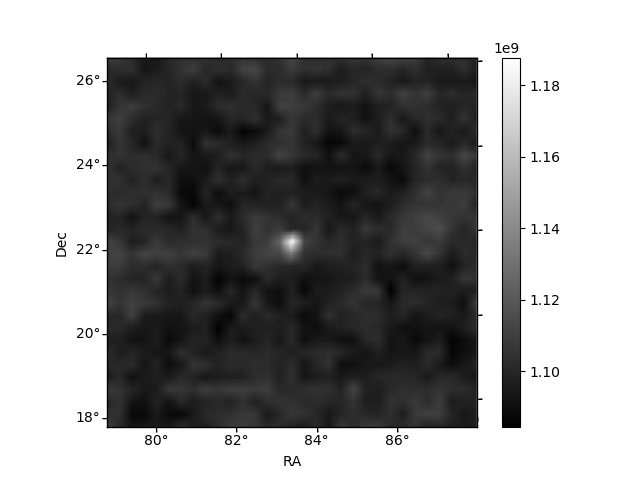
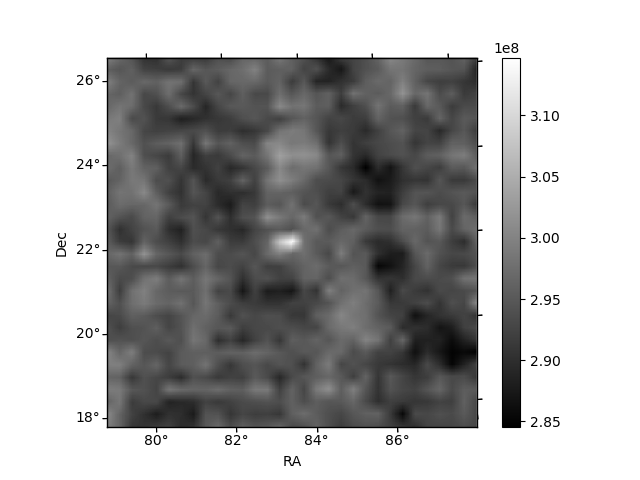
Histogram calculated using DETX and DETY for each event in the final _common_clean file
| Quadrant A | 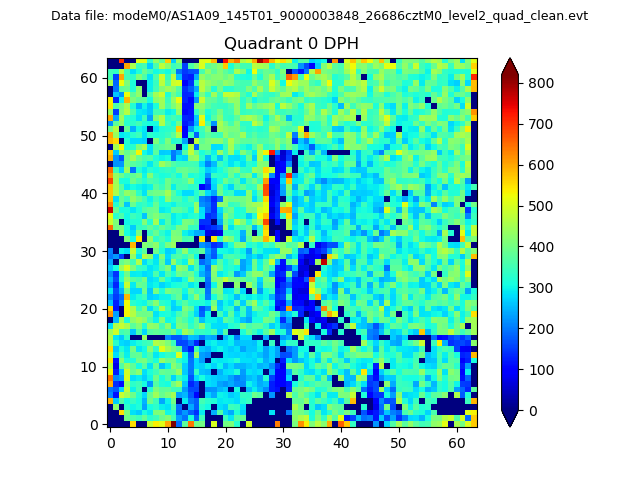 |
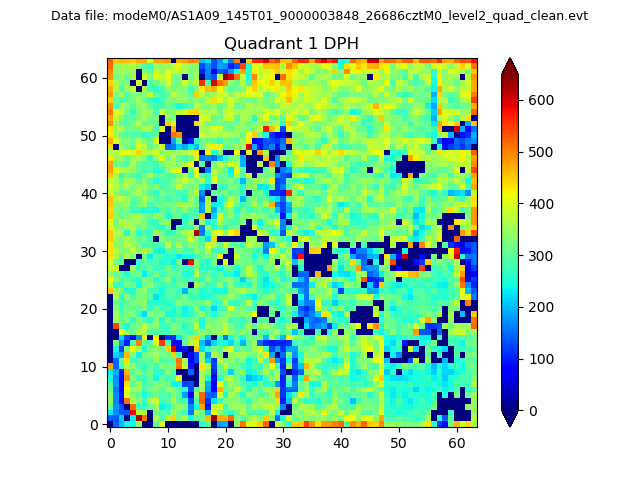 |
Quadrant B |
|---|---|---|---|
| Quadrant D |  |
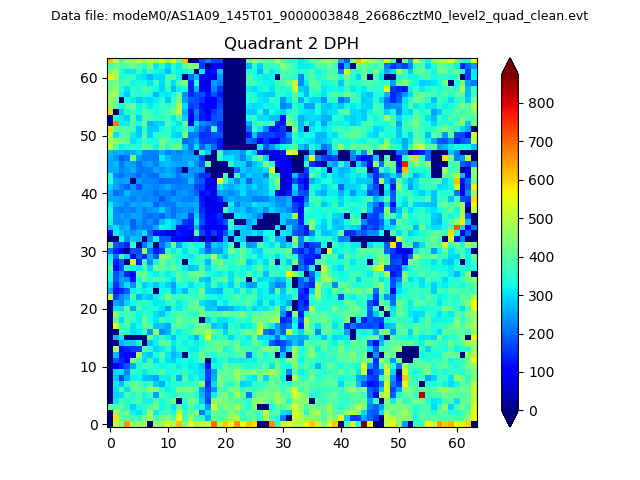 |
Quadrant C |
| Plot type | Count rate plots | Images |
|---|---|---|
| Comparison with Poisson distribution Blue bars denote a histogram of data divided into 1 sec bins. Red curve is a Poisson curve with rate = median count rate of data. |
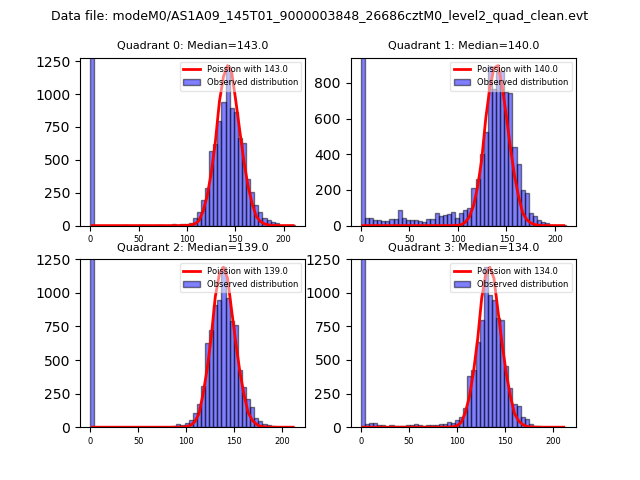 |
 |
| Quadrant-wise count rates Data is divided into 100 sec bins |
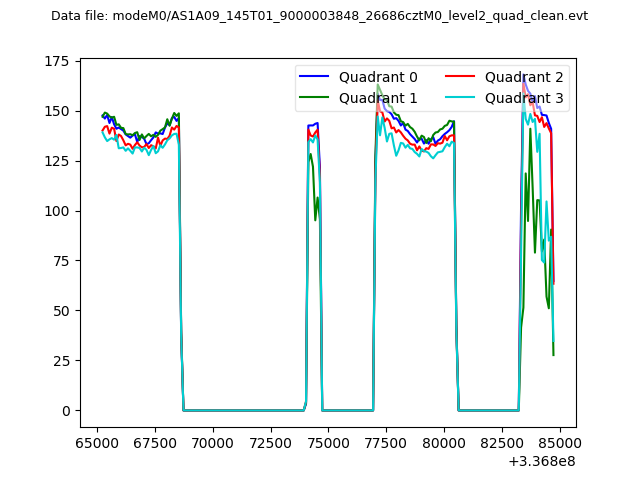 |
|
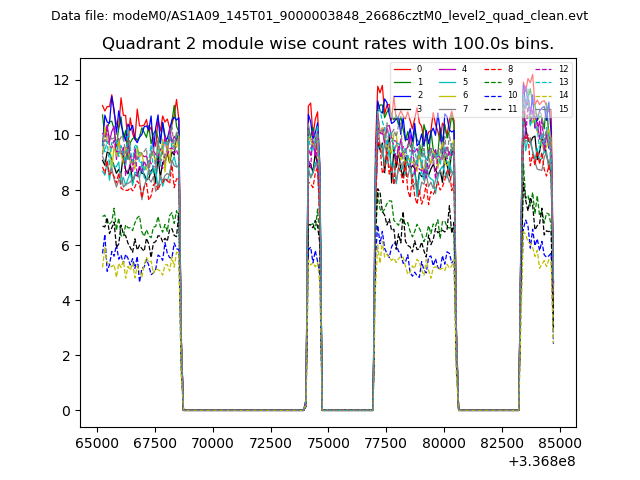
| Module-wise count rates for Quadrant A Data is divided into 100 sec bins |
 |
 |
| Module-wise count rates for Quadrant B Data is divided into 100 sec bins |
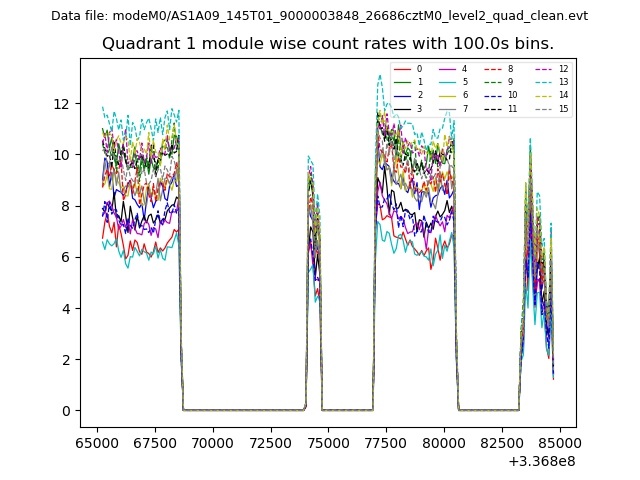 |
 |
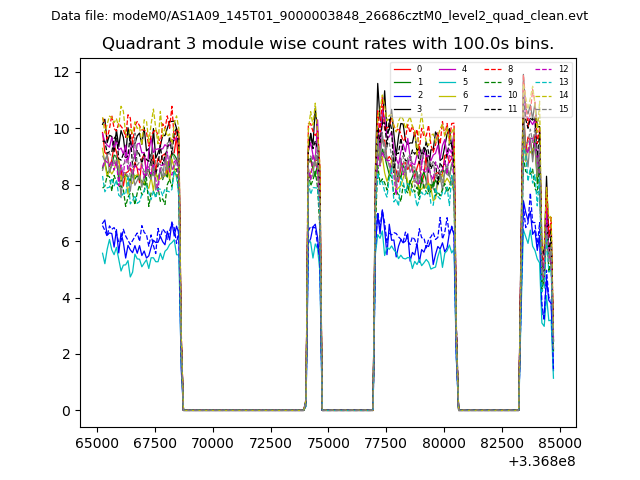
| Module-wise count rates for Quadrant C Data is divided into 100 sec bins |
 |
 |
| Module-wise count rates for Quadrant D Data is divided into 100 sec bins |
 |
 |
| Parameter | Plot |
|---|---|
| CZT HV Monitor | 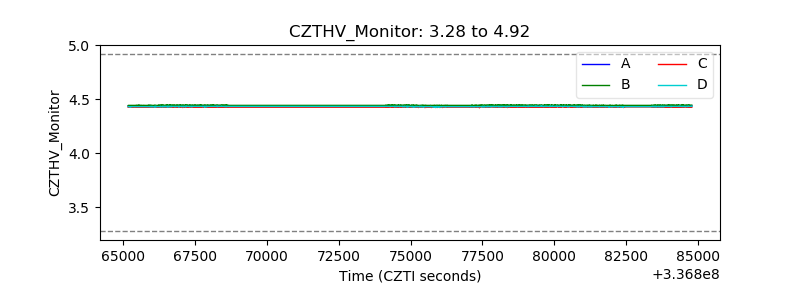 |
| D_VDD | 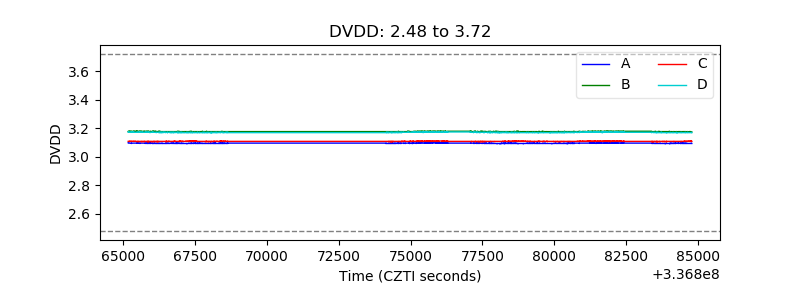 |
| Temperature 1 | 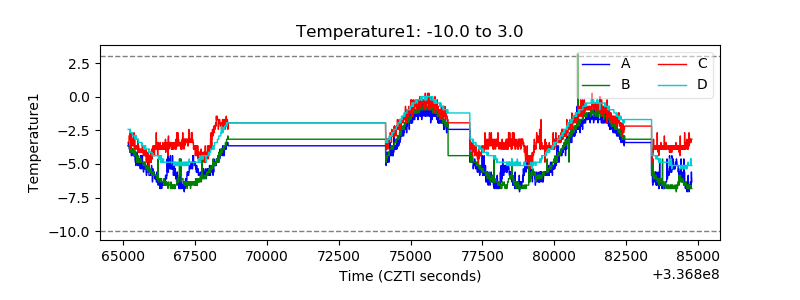 |
| Veto HV Monitor |  |
| Veto LLD | 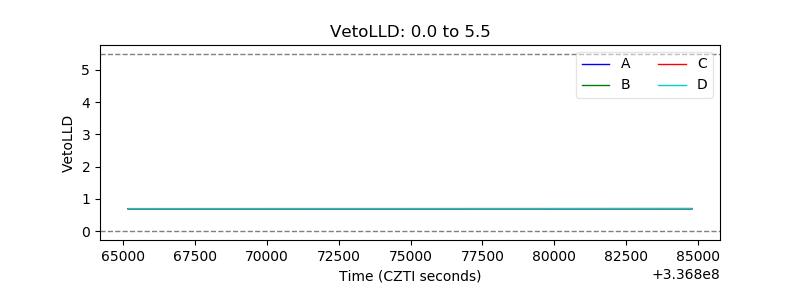 |
| Alpha Counter | 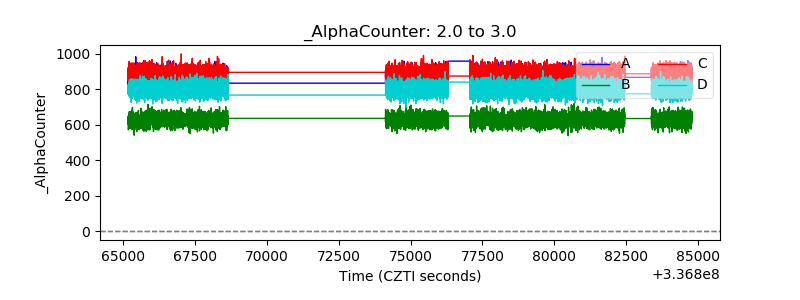 |
| _CPM_Rate |  |
| CZT Counter | 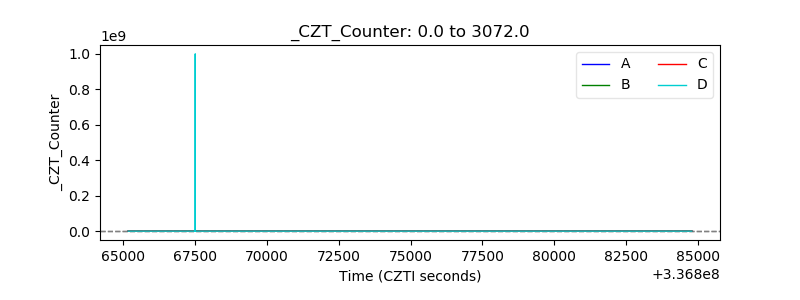 |
| +2.5 Volts monitor | 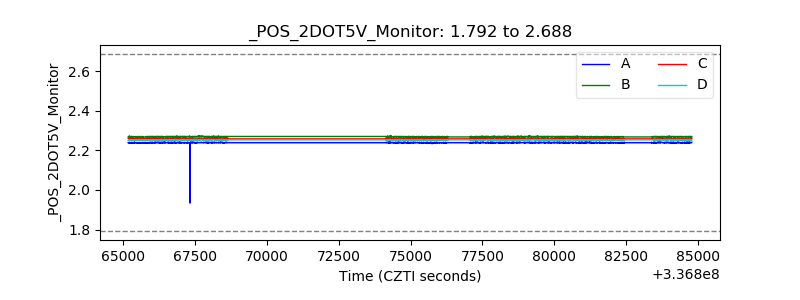 |
| +5 Volts monitor | 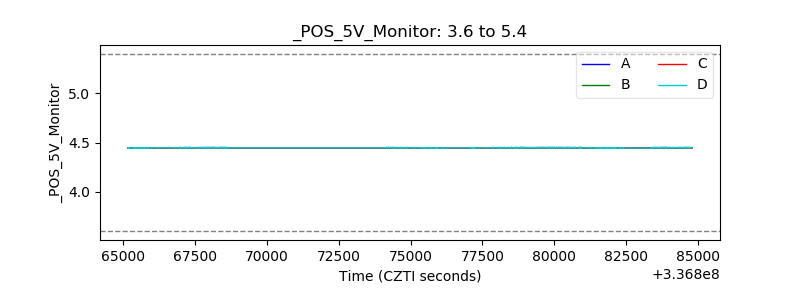 |
| _ROLL_ROT | 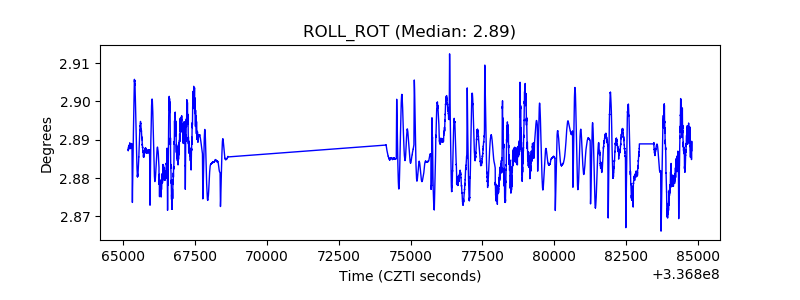 |
| _Roll_DEC | 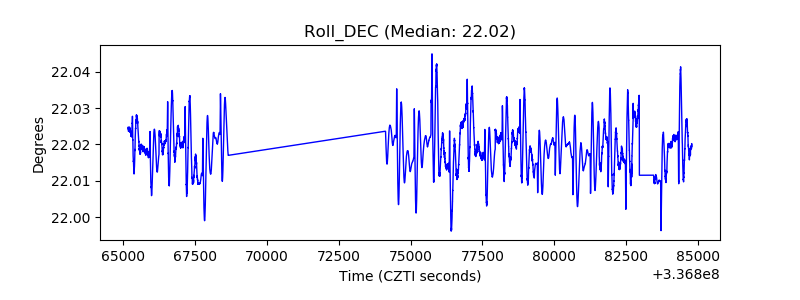 |
| _Roll_RA | 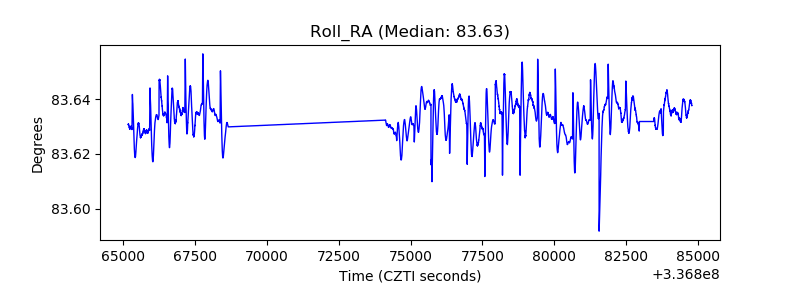 |
| Veto Counter | 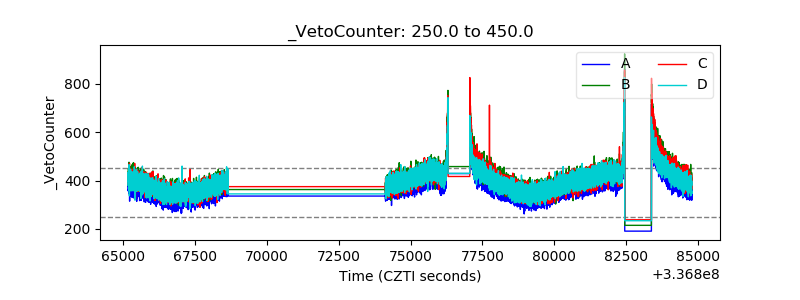 |