| Param | Original file | Final file |
|---|---|---|
| Filename | modeM0/AS1A09_145T01_9000003848_26687cztM0_level2.evt | modeM0/AS1A09_145T01_9000003848_26687cztM0_level2_quad_clean.evt |
| Size (bytes) | 1,853,291,520 | 243,014,400 |
| Size | 1.7 GB | 231.8 MB |
| Events in quadrant A | 8,279,944 | 1,689,038 |
| Events in quadrant B | 18,577,599 | 1,480,893 |
| Events in quadrant C | 9,485,129 | 1,630,290 |
| Events in quadrant D | 18,637,375 | 1,382,319 |
| Mode M0 | |||
|---|---|---|---|
| Quadrant | BADHDUFLAG | Total packets | Discarded packets |
| A | 0 | 35301 | 0 |
| B | 0 | 66247 | 0 |
| C | 0 | 39061 | 0 |
| D | 0 | 67011 | 0 |
| Mode M9 | |||
|---|---|---|---|
| Quadrant | BADHDUFLAG | Total packets | Discarded packets |
| A | 0 | 25 | 0 |
| B | 0 | 25 | 0 |
| C | 0 | 25 | 0 |
| D | 0 | 25 | 0 |
| Quadrant | Total seconds | Saturated seconds | Saturation percentage |
|---|---|---|---|
| A | 17056 | 82 | 0.480769% |
| B | 17057 | 4031 | 23.632526% |
| C | 17058 | 307 | 1.799742% |
| D | 17057 | 3204 | 18.784077% |
Noise dominated data is calculated using 1-second bins in cleaned event files. If a bin has >2000 counts, and if more than 50% of those come from <1% of pixels, then it is considered to be noise-dominated and hence unusable.
| Quadrant | # 1 sec bins | Bins with >0 counts | Bins with >2000 counts | High rate bins dominated by noise | Noise dominated (total time) | Noise dominated (detector-on time) | Marked lightcurve |
|---|---|---|---|---|---|---|---|
| A | 26130 | 17060 | 8 | 8 | 0.03% | 0.05% | 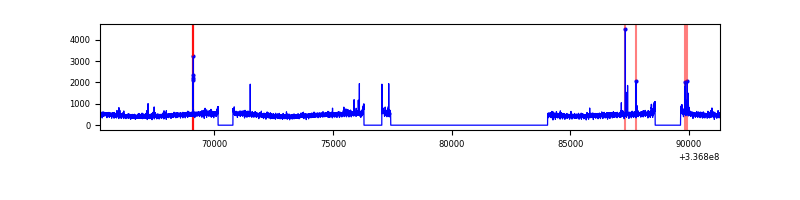 |
| B | 26131 | 17060 | 3123 | 3123 | 11.95% | 18.31% | 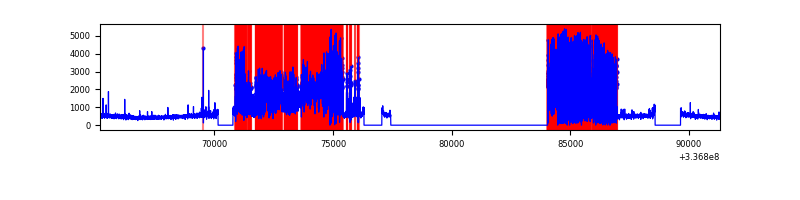 |
| C | 26131 | 17062 | 43 | 43 | 0.16% | 0.25% | 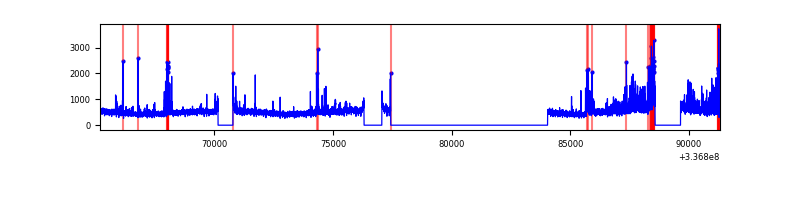 |
| D | 26131 | 17060 | 2828 | 2828 | 10.82% | 16.58% | 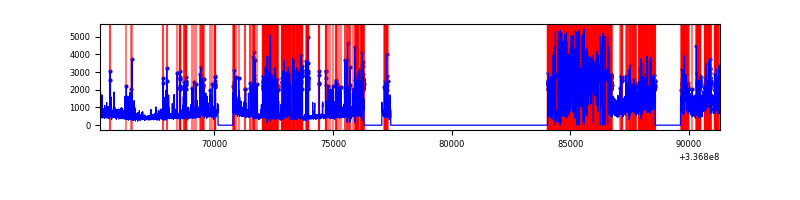 |
Top three noisy pixels from each quadrant. If the there are fewer than three noisy pixels in the level2.evt file, extra rows are filled as -1
| Pixel properties | Quadrant properties | ||||||
|---|---|---|---|---|---|---|---|
| Quadrant | DetID | PixID | Counts | Sigma | Mean | Median | Sigma |
| A | 0 | 13 | 117709 | 273.18 | 2112 | 2080 | 423.3 |
| A | 13 | 254 | 28533 | 62.5 | 2112 | 2080 | 423.3 |
| A | 3 | 137 | 19150 | 40.33 | 2112 | 2080 | 423.3 |
| B | 0 | 189 | 11093368 | 31556.69 | 1865 | 1825 | 351.5 |
| B | 10 | 247 | 72911 | 202.25 | 1865 | 1825 | 351.5 |
| B | 12 | 111 | 41880 | 113.96 | 1865 | 1825 | 351.5 |
| C | 1 | 0 | 886491 | 1877.24 | 2015 | 2034 | 471.1 |
| C | 14 | 238 | 325371 | 686.27 | 2015 | 2034 | 471.1 |
| C | 3 | 233 | 162583 | 340.76 | 2015 | 2034 | 471.1 |
| D | 7 | 80 | 8553395 | 18893.11 | 1855 | 1805 | 452.6 |
| D | 1 | 52 | 2277364 | 5027.42 | 1855 | 1805 | 452.6 |
| D | 2 | 250 | 391585 | 861.14 | 1855 | 1805 | 452.6 |
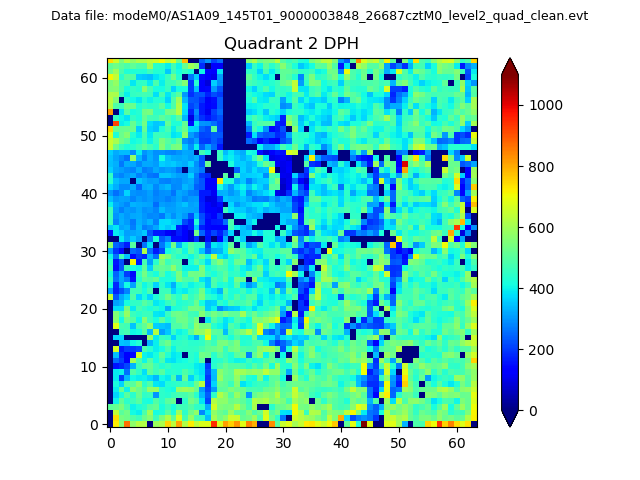
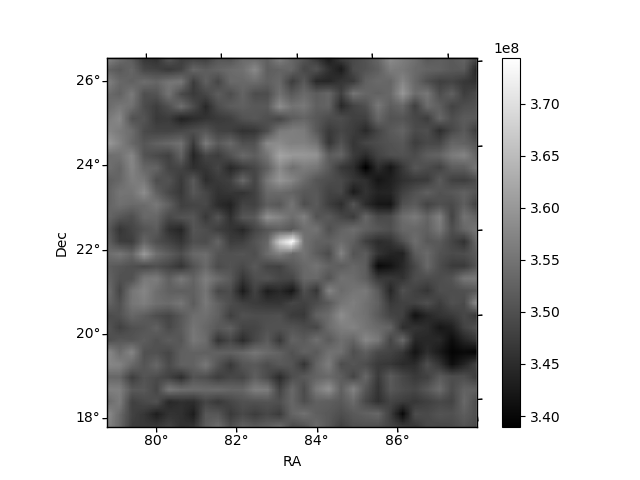
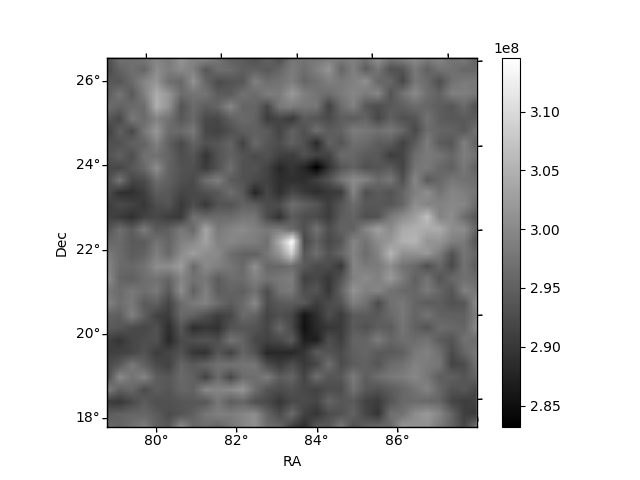
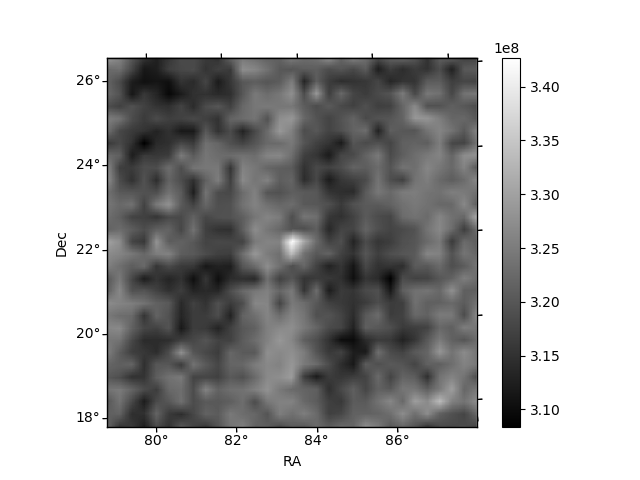
Histogram calculated using DETX and DETY for each event in the final _common_clean file
| Quadrant A | 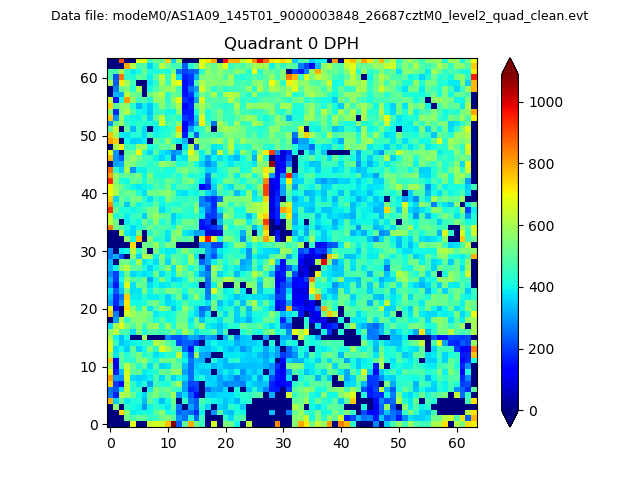 |
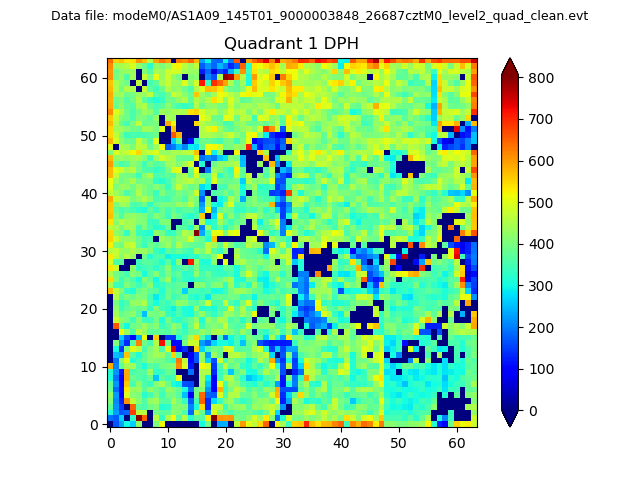 |
Quadrant B |
|---|---|---|---|
| Quadrant D | 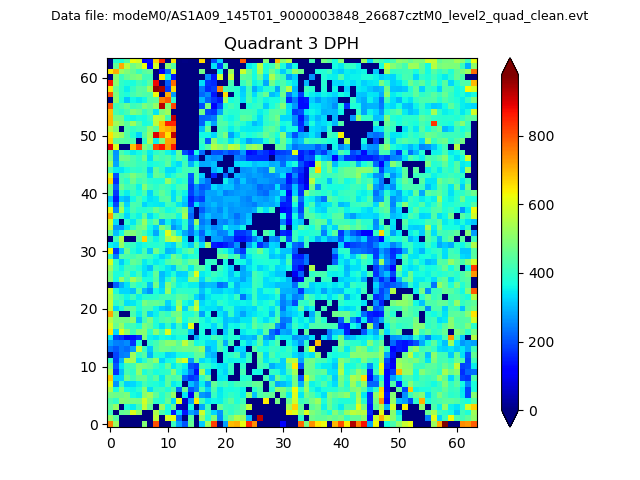 |
 |
Quadrant C |
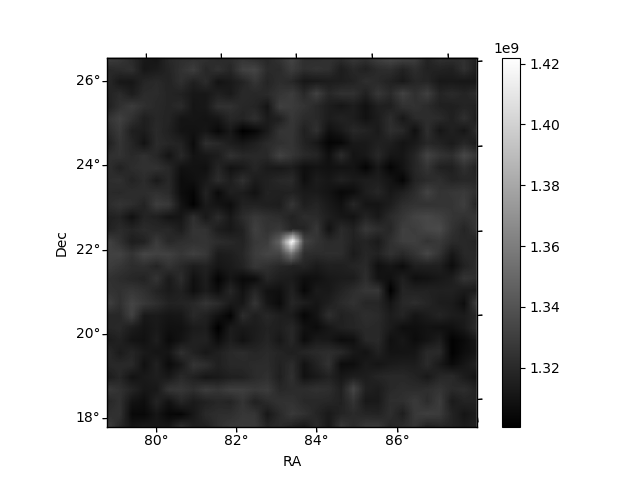
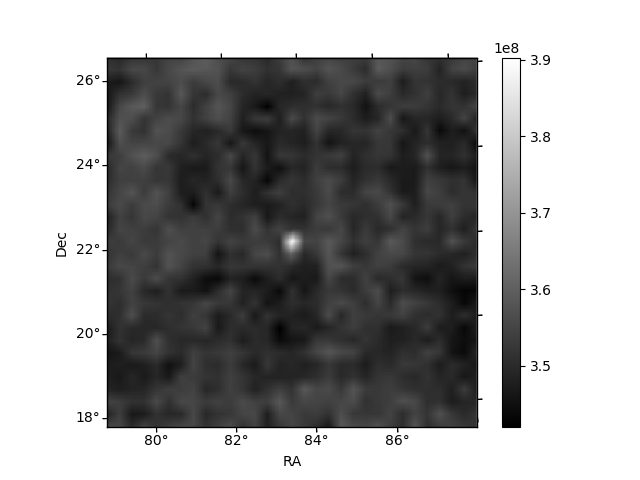
| Plot type | Count rate plots | Images |
|---|---|---|
| Comparison with Poisson distribution Blue bars denote a histogram of data divided into 1 sec bins. Red curve is a Poisson curve with rate = median count rate of data. |
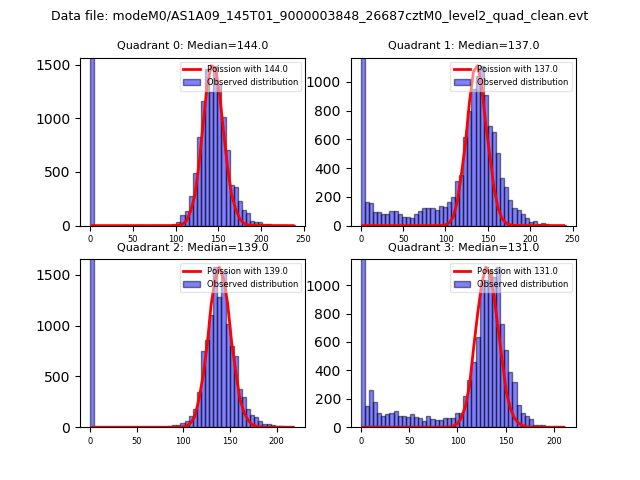 |
 |
| Quadrant-wise count rates Data is divided into 100 sec bins |
 |
|
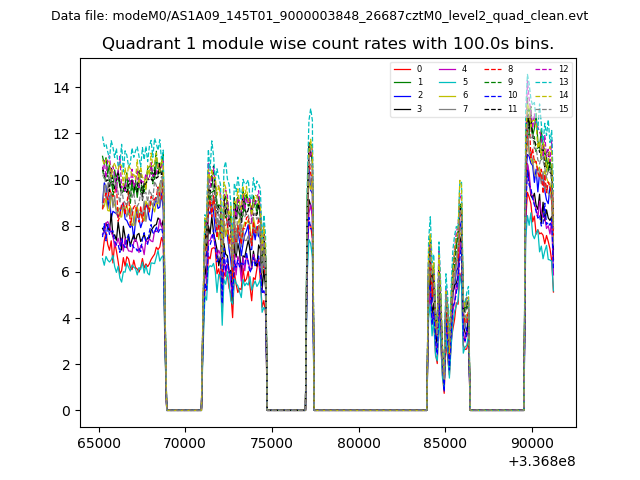
| Module-wise count rates for Quadrant A Data is divided into 100 sec bins |
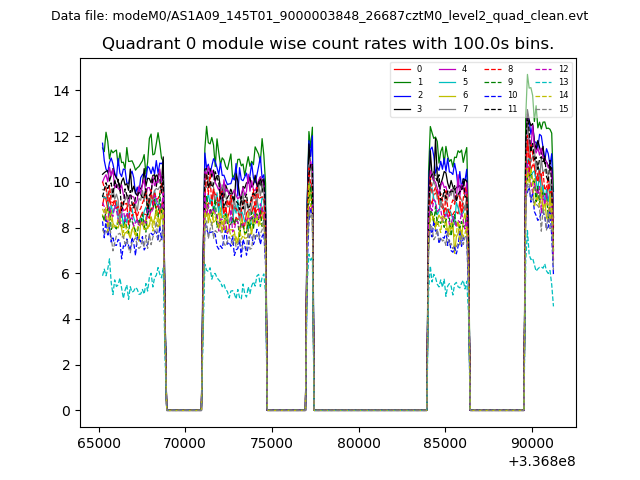 |
 |
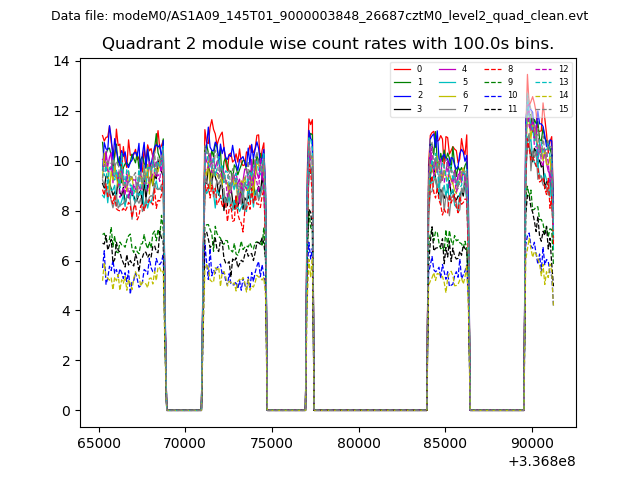
| Module-wise count rates for Quadrant B Data is divided into 100 sec bins |
 |
 |
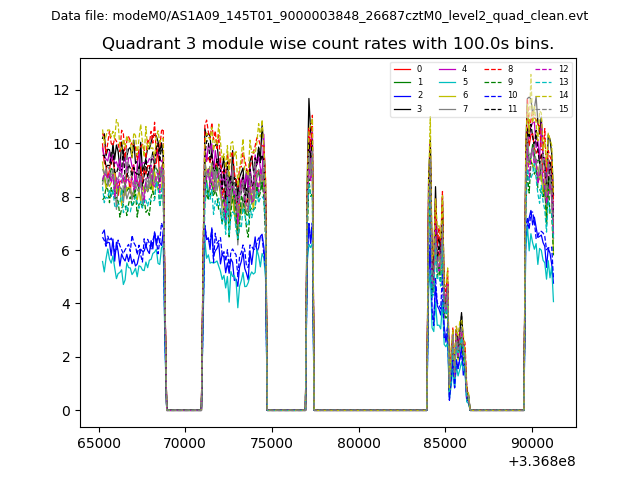
| Module-wise count rates for Quadrant C Data is divided into 100 sec bins |
 |
 |
| Module-wise count rates for Quadrant D Data is divided into 100 sec bins |
 |
 |
| Parameter | Plot |
|---|---|
| CZT HV Monitor | 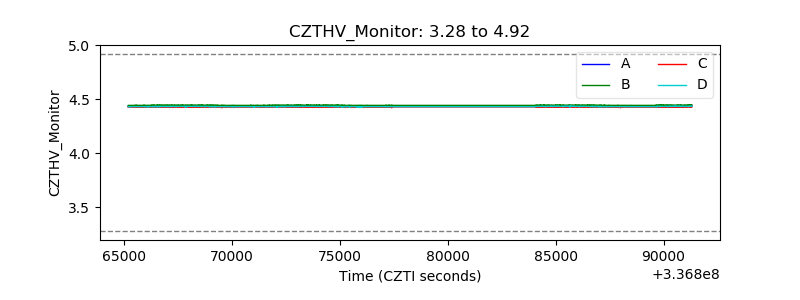 |
| D_VDD | 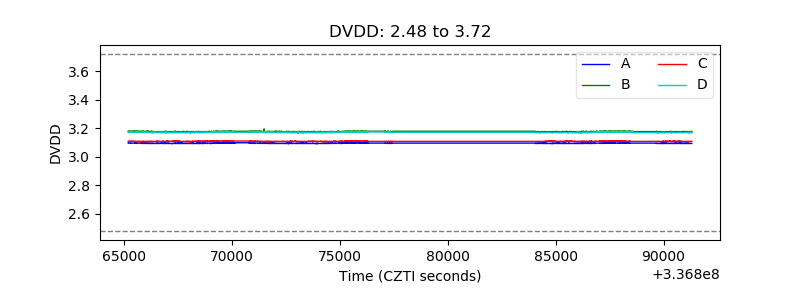 |
| Temperature 1 | 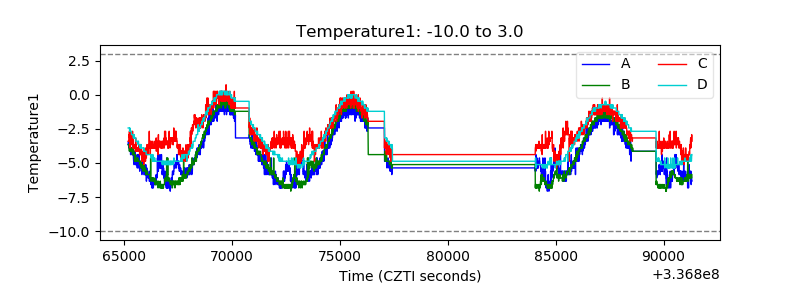 |
| Veto HV Monitor | 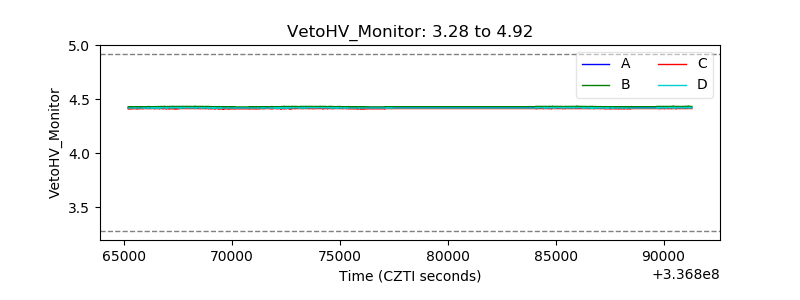 |
| Veto LLD | 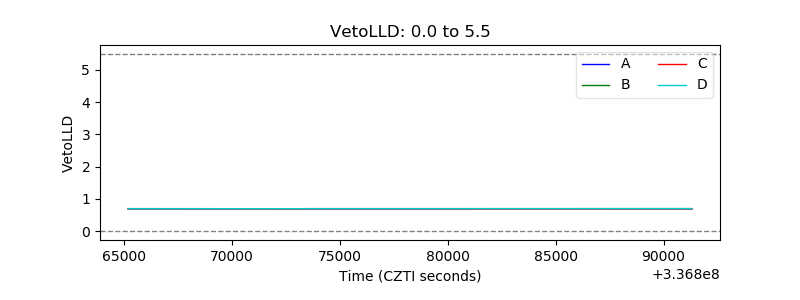 |
| Alpha Counter | 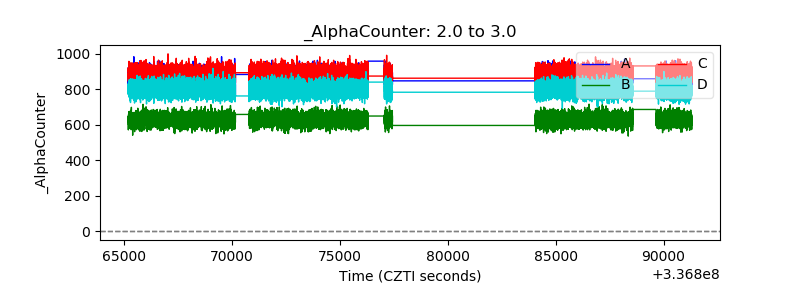 |
| _CPM_Rate | 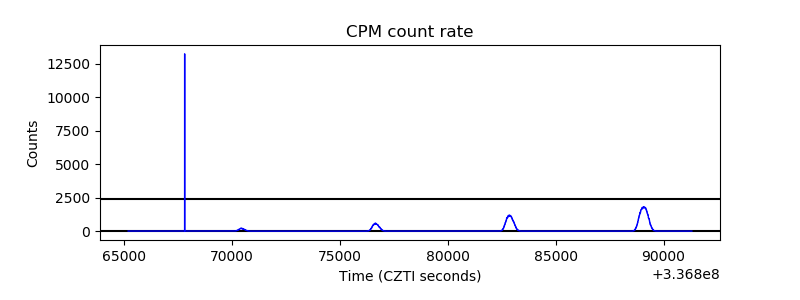 |
| CZT Counter | 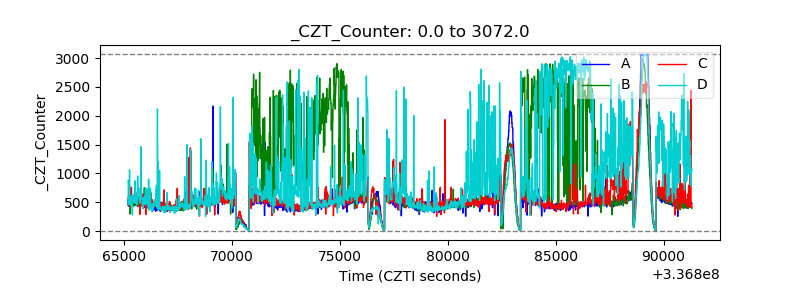 |
| +2.5 Volts monitor |  |
| +5 Volts monitor |  |
| _ROLL_ROT | 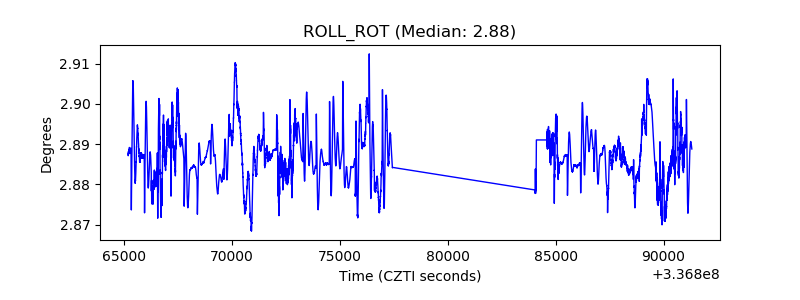 |
| _Roll_DEC | 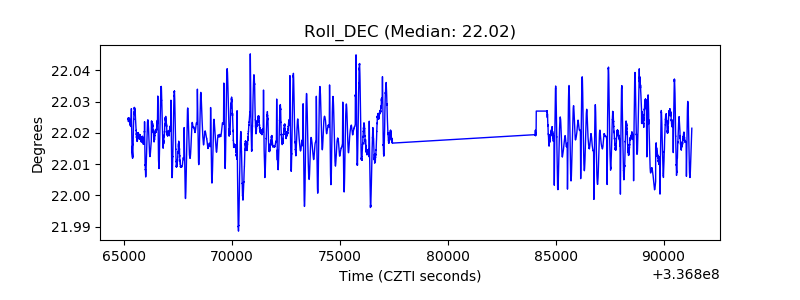 |
| _Roll_RA | 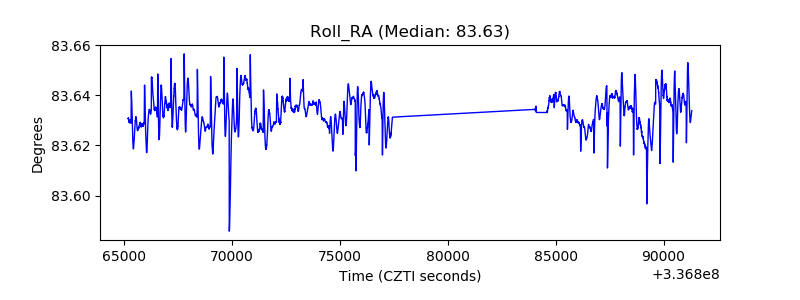 |
| Veto Counter | 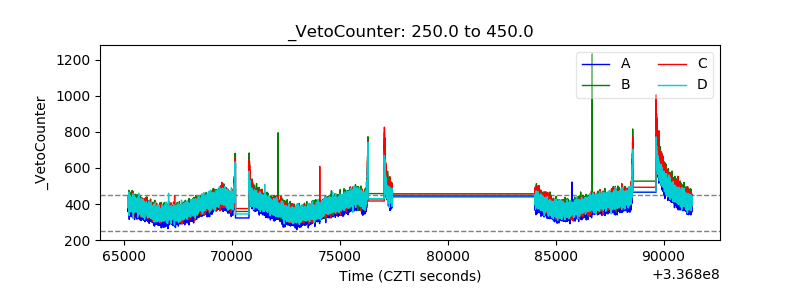 |