| Param | Original file | Final file |
|---|---|---|
| Filename | modeM0/AS1A09_145T01_9000003848_26689cztM0_level2.evt | modeM0/AS1A09_145T01_9000003848_26689cztM0_level2_quad_clean.evt |
| Size (bytes) | 516,640,320 | 84,381,120 |
| Size | 492.7 MB | 80.5 MB |
| Events in quadrant A | 3,083,080 | 562,570 |
| Events in quadrant B | 2,873,879 | 572,115 |
| Events in quadrant C | 3,847,459 | 533,761 |
| Events in quadrant D | 5,458,498 | 490,653 |
| Mode M0 | |||
|---|---|---|---|
| Quadrant | BADHDUFLAG | Total packets | Discarded packets |
| A | 0 | 12522 | 0 |
| B | 0 | 11936 | 0 |
| C | 0 | 15261 | 0 |
| D | 0 | 20041 | 0 |
| Mode M9 | |||
|---|---|---|---|
| Quadrant | BADHDUFLAG | Total packets | Discarded packets |
| A | 0 | 12 | 0 |
| B | 0 | 12 | 0 |
| C | 0 | 12 | 0 |
| D | 0 | 12 | 0 |
| Quadrant | Total seconds | Saturated seconds | Saturation percentage |
|---|---|---|---|
| A | 5665 | 53 | 0.935569% |
| B | 5666 | 44 | 0.776562% |
| C | 5666 | 137 | 2.417932% |
| D | 5666 | 531 | 9.371691% |
Noise dominated data is calculated using 1-second bins in cleaned event files. If a bin has >2000 counts, and if more than 50% of those come from <1% of pixels, then it is considered to be noise-dominated and hence unusable.
| Quadrant | # 1 sec bins | Bins with >0 counts | Bins with >2000 counts | High rate bins dominated by noise | Noise dominated (total time) | Noise dominated (detector-on time) | Marked lightcurve |
|---|---|---|---|---|---|---|---|
| A | 6825 | 5666 | 10 | 10 | 0.15% | 0.18% | 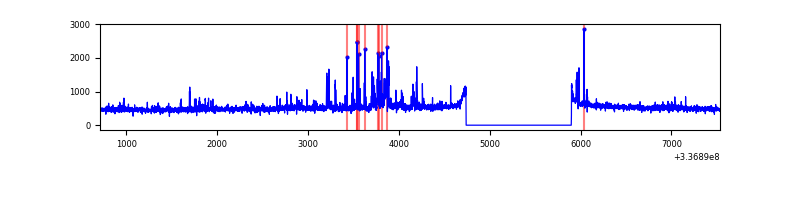 |
| B | 6826 | 5667 | 1 | 1 | 0.01% | 0.02% | 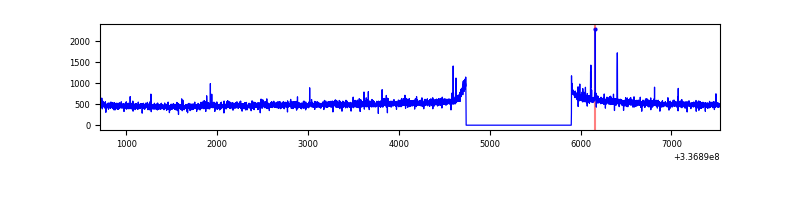 |
| C | 6826 | 5667 | 32 | 32 | 0.47% | 0.56% | 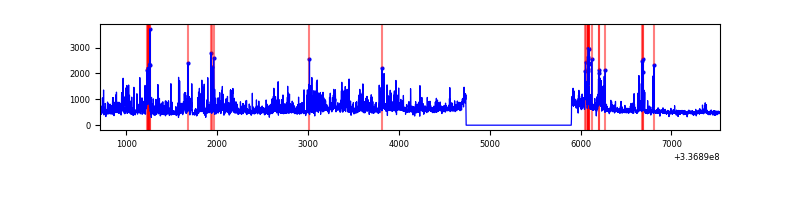 |
| D | 6825 | 5666 | 430 | 430 | 6.30% | 7.59% | 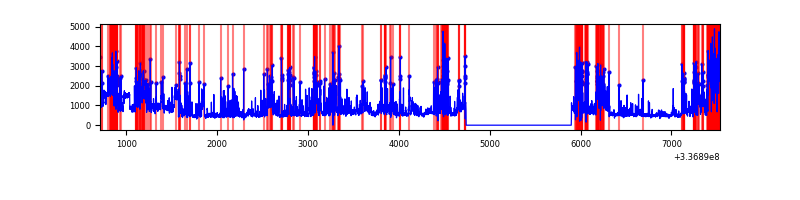 |
Top three noisy pixels from each quadrant. If the there are fewer than three noisy pixels in the level2.evt file, extra rows are filled as -1
| Pixel properties | Quadrant properties | ||||||
|---|---|---|---|---|---|---|---|
| Quadrant | DetID | PixID | Counts | Sigma | Mean | Median | Sigma |
| A | 0 | 13 | 239374 | 1627.6 | 735 | 724 | 146.6 |
| A | 15 | 174 | 10798 | 68.7 | 735 | 724 | 146.6 |
| A | 13 | 254 | 9641 | 60.81 | 735 | 724 | 146.6 |
| B | 14 | 207 | 18878 | 131.33 | 729 | 714 | 138.3 |
| B | 12 | 111 | 15962 | 110.25 | 729 | 714 | 138.3 |
| B | 11 | 111 | 14196 | 97.48 | 729 | 714 | 138.3 |
| C | 1 | 0 | 977938 | 5998.84 | 695 | 702 | 162.9 |
| C | 14 | 238 | 113423 | 691.95 | 695 | 702 | 162.9 |
| C | 15 | 208 | 22477 | 133.67 | 695 | 702 | 162.9 |
| D | 1 | 52 | 1514625 | 8263.56 | 674 | 661 | 183.2 |
| D | 7 | 80 | 1252006 | 6830.12 | 674 | 661 | 183.2 |
| D | 2 | 250 | 83633 | 452.88 | 674 | 661 | 183.2 |
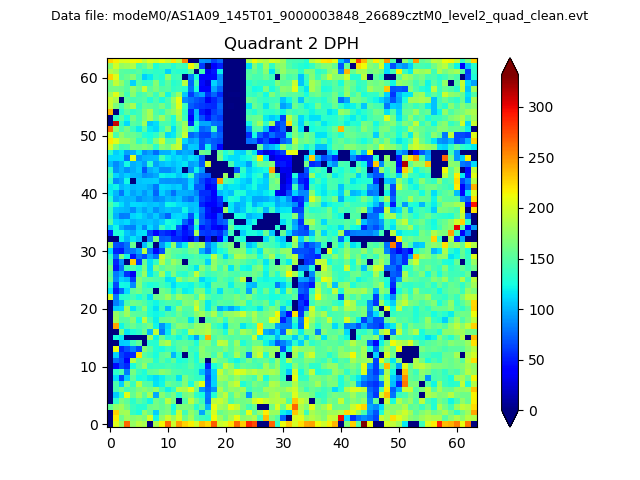
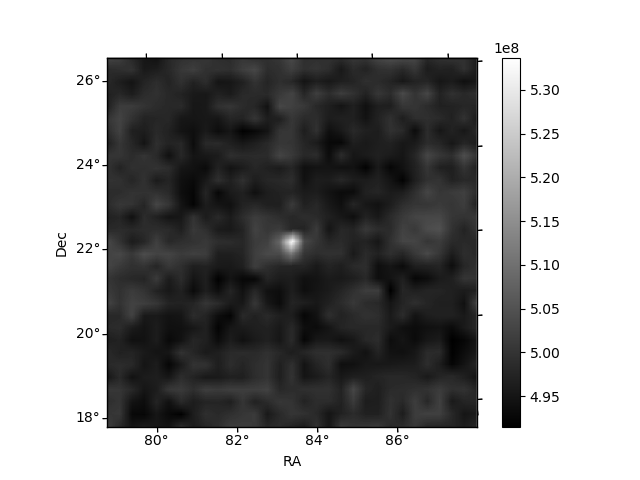
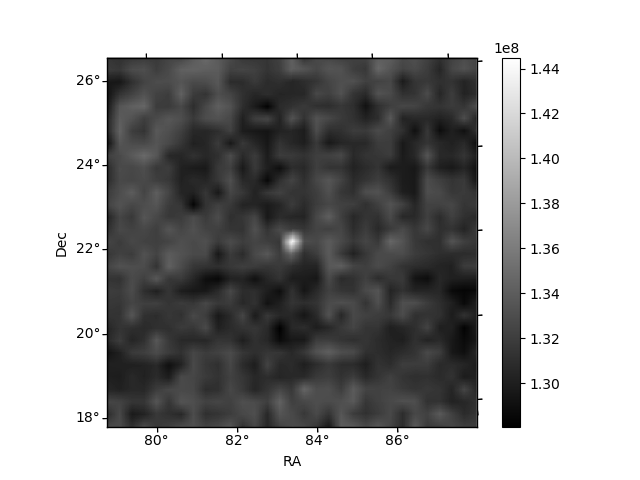
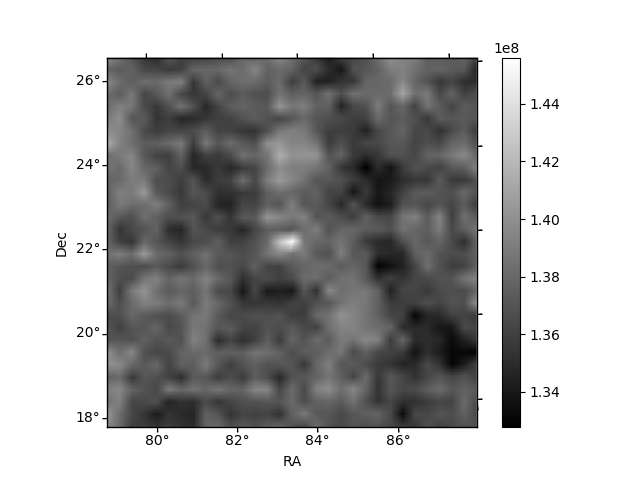
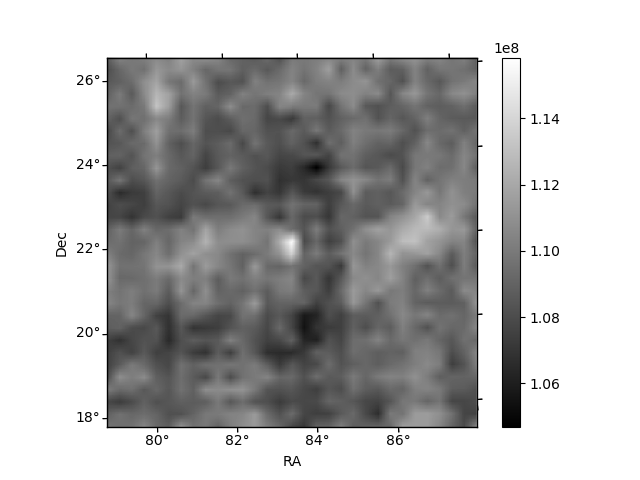
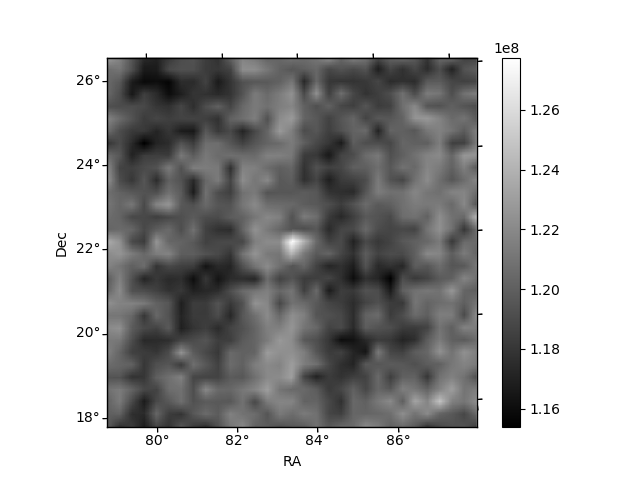
Histogram calculated using DETX and DETY for each event in the final _common_clean file
| Quadrant A | 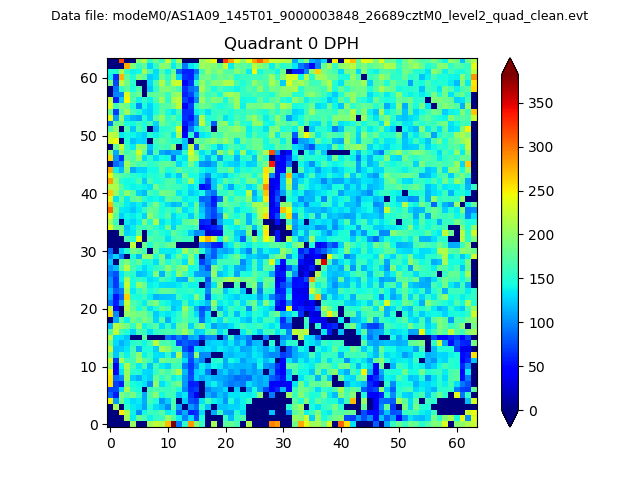 |
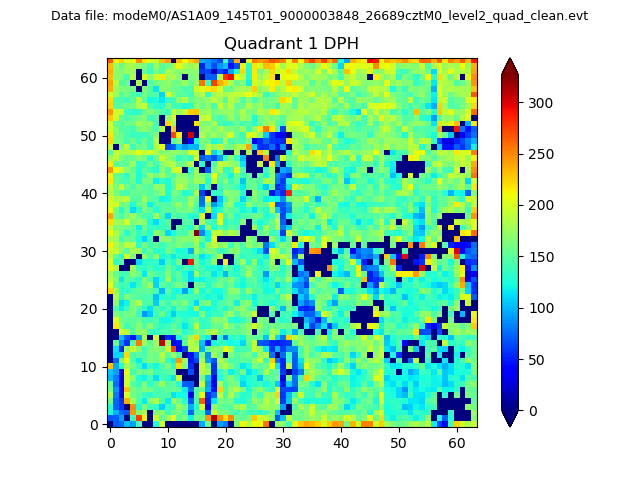 |
Quadrant B |
|---|---|---|---|
| Quadrant D | 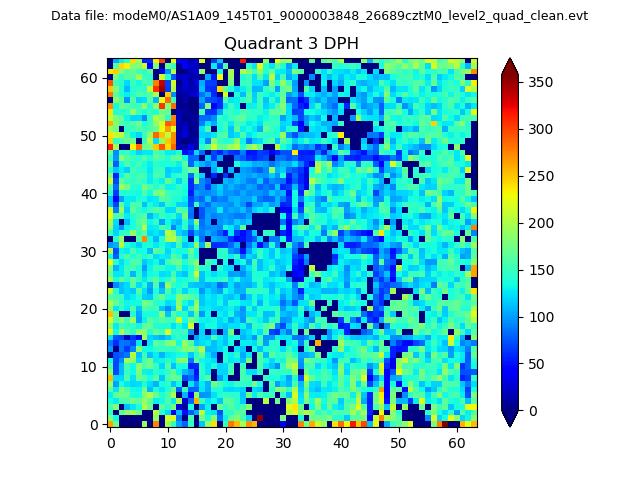 |
 |
Quadrant C |
| Plot type | Count rate plots | Images |
|---|---|---|
| Comparison with Poisson distribution Blue bars denote a histogram of data divided into 1 sec bins. Red curve is a Poisson curve with rate = median count rate of data. |
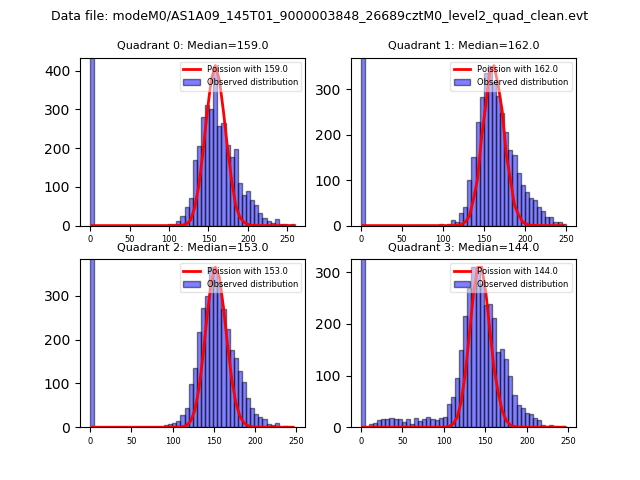 |
 |
| Quadrant-wise count rates Data is divided into 100 sec bins |
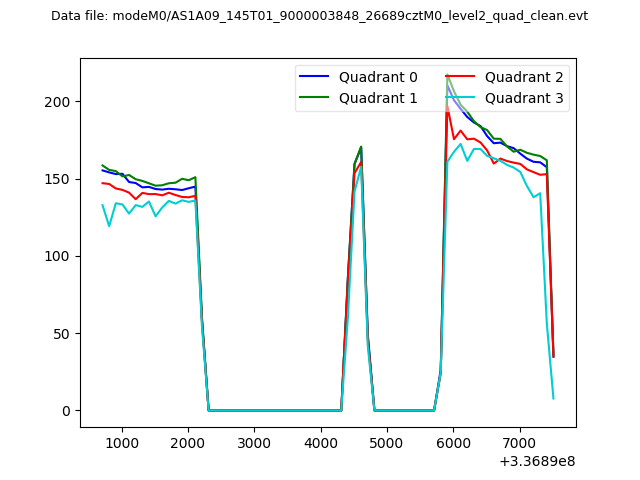 |
|
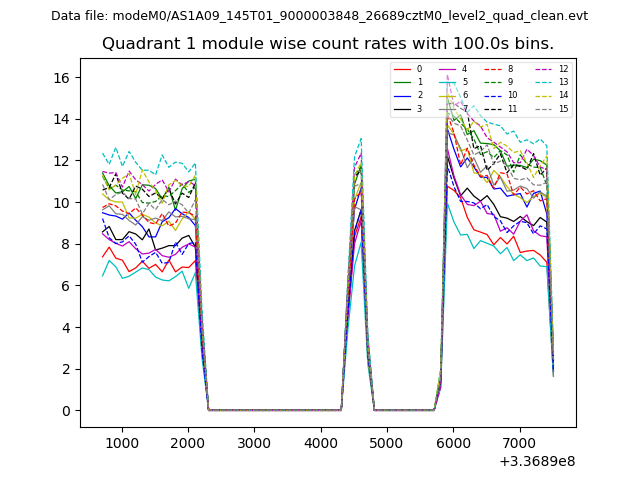
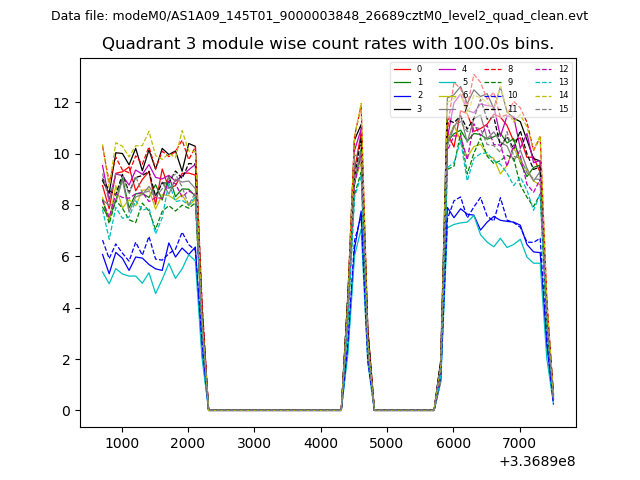
| Module-wise count rates for Quadrant A Data is divided into 100 sec bins |
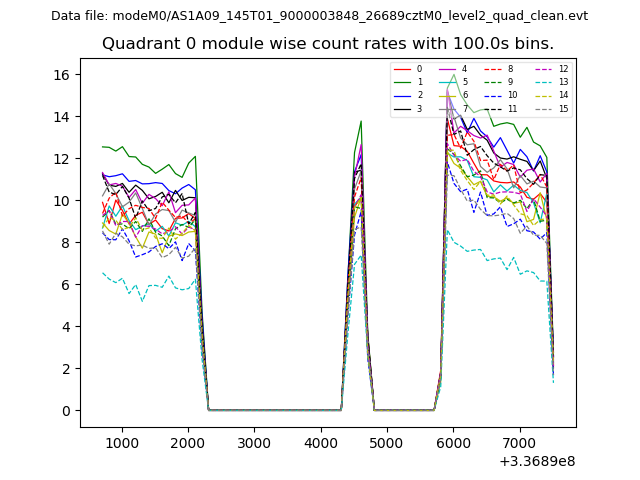 |
 |
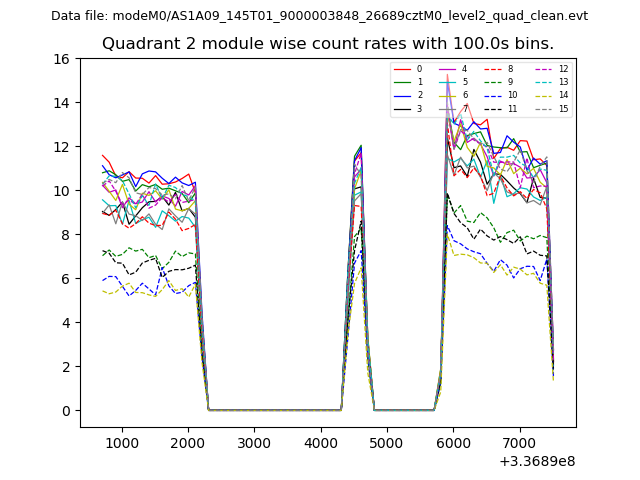
| Module-wise count rates for Quadrant B Data is divided into 100 sec bins |
 |
 |
| Module-wise count rates for Quadrant C Data is divided into 100 sec bins |
 |
 |
| Module-wise count rates for Quadrant D Data is divided into 100 sec bins |
 |
 |
| Parameter | Plot |
|---|---|
| CZT HV Monitor | 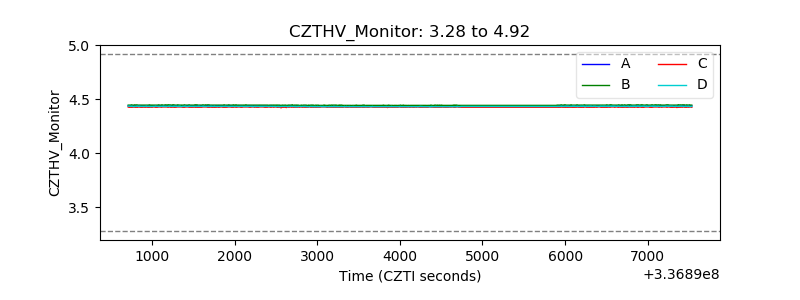 |
| D_VDD | 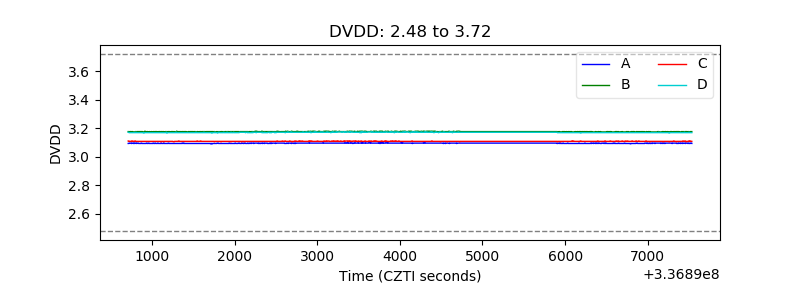 |
| Temperature 1 | 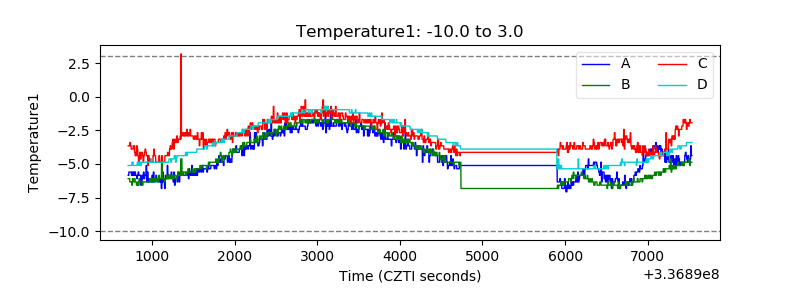 |
| Veto HV Monitor | 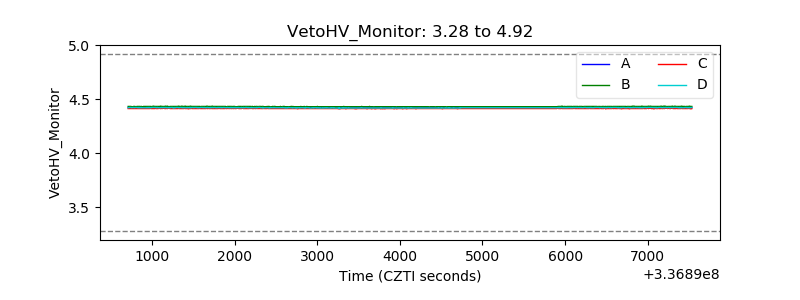 |
| Veto LLD | 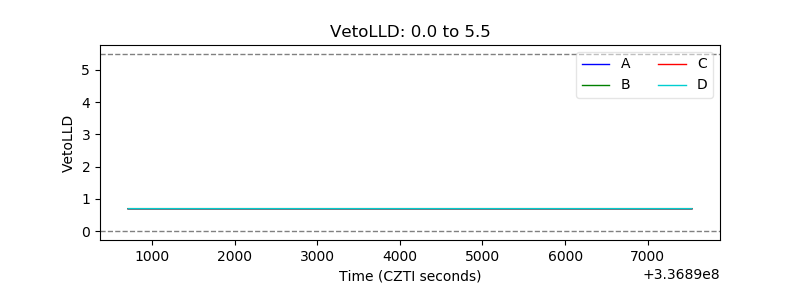 |
| Alpha Counter | 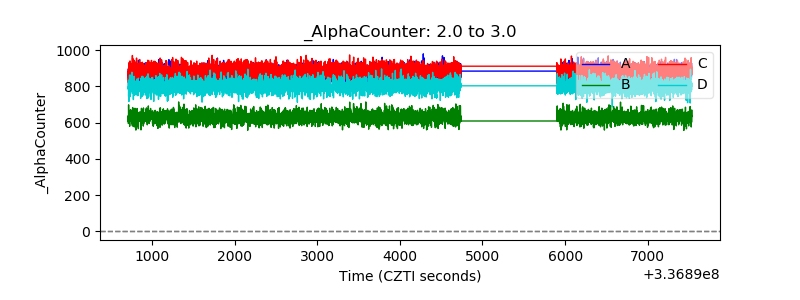 |
| _CPM_Rate | 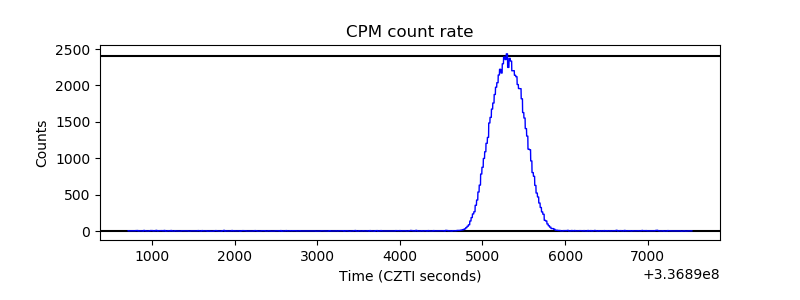 |
| CZT Counter | 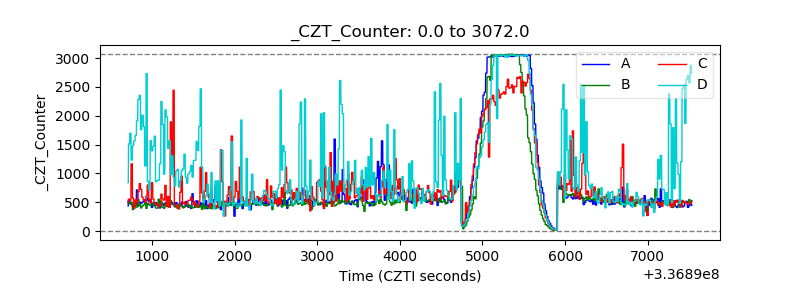 |
| +2.5 Volts monitor | 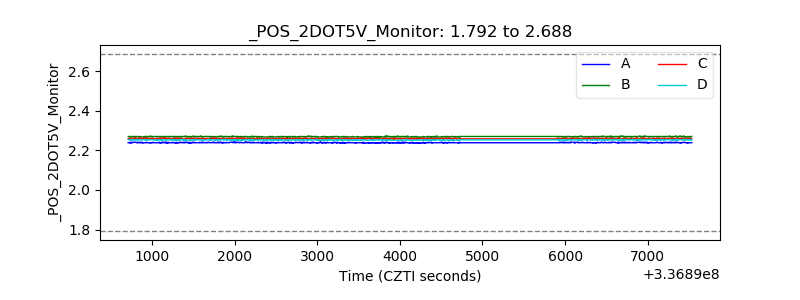 |
| +5 Volts monitor | 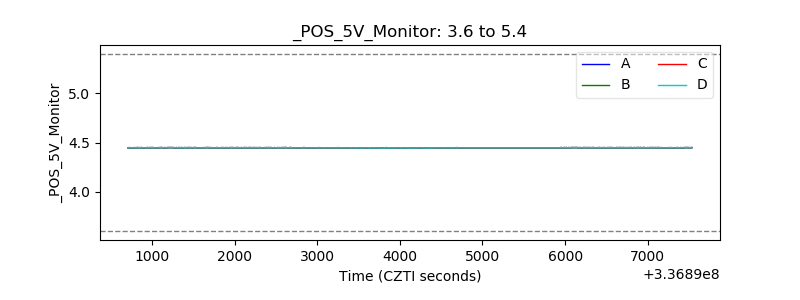 |
| _ROLL_ROT | 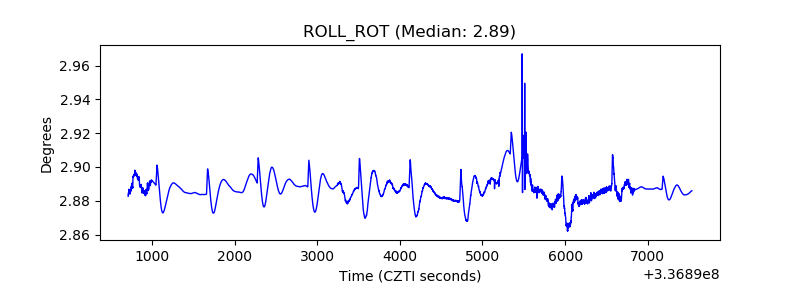 |
| _Roll_DEC | 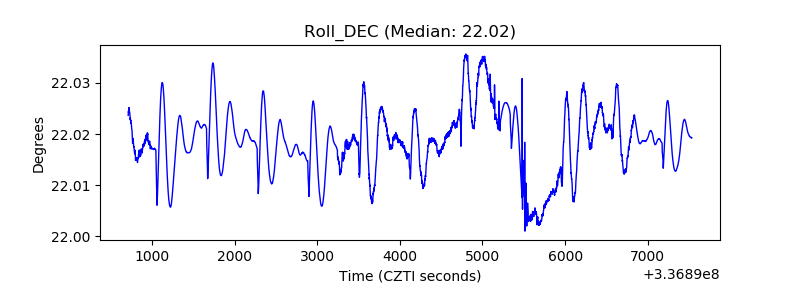 |
| _Roll_RA | 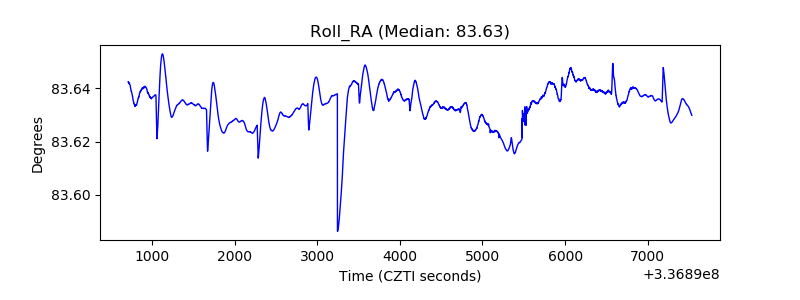 |
| Veto Counter | 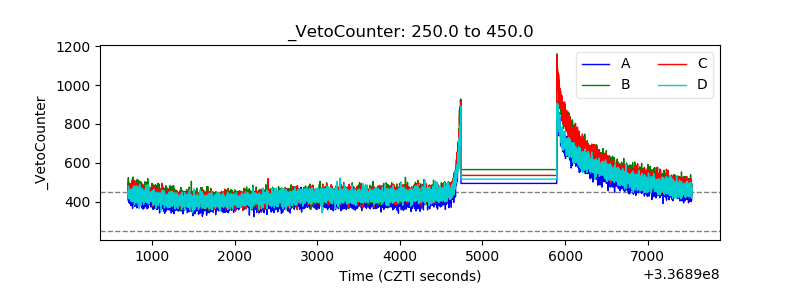 |