| Param | Original file | Final file |
|---|---|---|
| Filename | modeM0/AS1A09_145T01_9000003848_26690cztM0_level2.evt | modeM0/AS1A09_145T01_9000003848_26690cztM0_level2_quad_clean.evt |
| Size (bytes) | 625,855,680 | 93,337,920 |
| Size | 596.9 MB | 89.0 MB |
| Events in quadrant A | 3,141,421 | 640,518 |
| Events in quadrant B | 3,114,012 | 648,722 |
| Events in quadrant C | 3,397,068 | 605,081 |
| Events in quadrant D | 8,901,152 | 519,154 |
| Mode M0 | |||
|---|---|---|---|
| Quadrant | BADHDUFLAG | Total packets | Discarded packets |
| A | 0 | 12648 | 0 |
| B | 0 | 12604 | 0 |
| C | 0 | 13612 | 0 |
| D | 0 | 30453 | 0 |
| Mode M9 | |||
|---|---|---|---|
| Quadrant | BADHDUFLAG | Total packets | Discarded packets |
| A | 0 | 12 | 0 |
| B | 0 | 12 | 0 |
| C | 0 | 12 | 0 |
| D | 0 | 12 | 0 |
| Quadrant | Total seconds | Saturated seconds | Saturation percentage |
|---|---|---|---|
| A | 5907 | 36 | 0.609446% |
| B | 5908 | 53 | 0.897089% |
| C | 5908 | 134 | 2.268111% |
| D | 5907 | 2594 | 43.914000% |
Noise dominated data is calculated using 1-second bins in cleaned event files. If a bin has >2000 counts, and if more than 50% of those come from <1% of pixels, then it is considered to be noise-dominated and hence unusable.
| Quadrant | # 1 sec bins | Bins with >0 counts | Bins with >2000 counts | High rate bins dominated by noise | Noise dominated (total time) | Noise dominated (detector-on time) | Marked lightcurve |
|---|---|---|---|---|---|---|---|
| A | 7157 | 5908 | 1 | 1 | 0.01% | 0.02% | 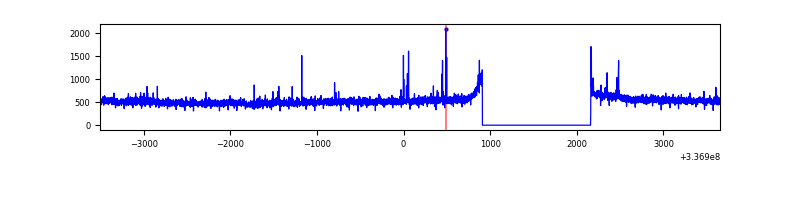 |
| B | 7158 | 5909 | 2 | 2 | 0.03% | 0.03% | 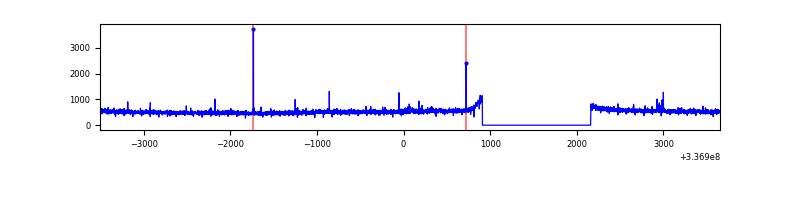 |
| C | 7158 | 5909 | 46 | 46 | 0.64% | 0.78% | 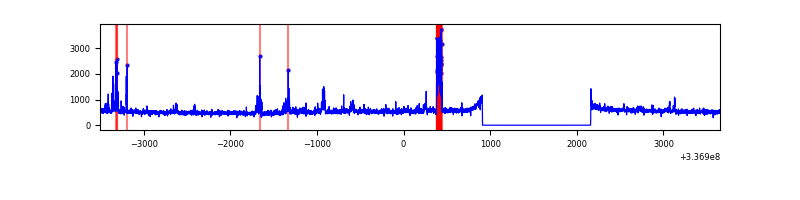 |
| D | 7157 | 5907 | 2169 | 2169 | 30.31% | 36.72% | 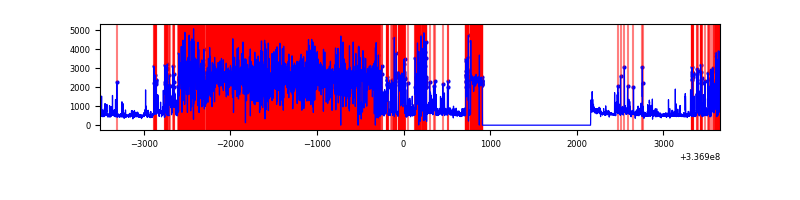 |
Top three noisy pixels from each quadrant. If the there are fewer than three noisy pixels in the level2.evt file, extra rows are filled as -1
| Pixel properties | Quadrant properties | ||||||
|---|---|---|---|---|---|---|---|
| Quadrant | DetID | PixID | Counts | Sigma | Mean | Median | Sigma |
| A | 0 | 13 | 53470 | 331.5 | 801 | 791 | 158.9 |
| A | 13 | 254 | 9549 | 55.11 | 801 | 791 | 158.9 |
| A | 0 | 226 | 6983 | 38.97 | 801 | 791 | 158.9 |
| B | 12 | 111 | 17031 | 109.32 | 789 | 773 | 148.7 |
| B | 11 | 111 | 15194 | 96.97 | 789 | 773 | 148.7 |
| B | 14 | 111 | 13317 | 84.35 | 789 | 773 | 148.7 |
| C | 3 | 233 | 237256 | 1344.38 | 753 | 761 | 175.9 |
| C | 14 | 238 | 122627 | 692.76 | 753 | 761 | 175.9 |
| C | 1 | 0 | 96966 | 546.89 | 753 | 761 | 175.9 |
| D | 7 | 80 | 5582535 | 35177.16 | 588 | 579 | 158.7 |
| D | 1 | 52 | 973170 | 6129.21 | 588 | 579 | 158.7 |
| D | 2 | 250 | 82984 | 519.31 | 588 | 579 | 158.7 |
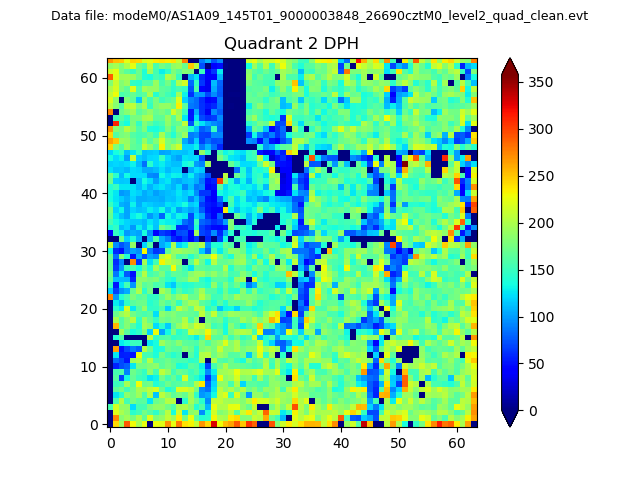
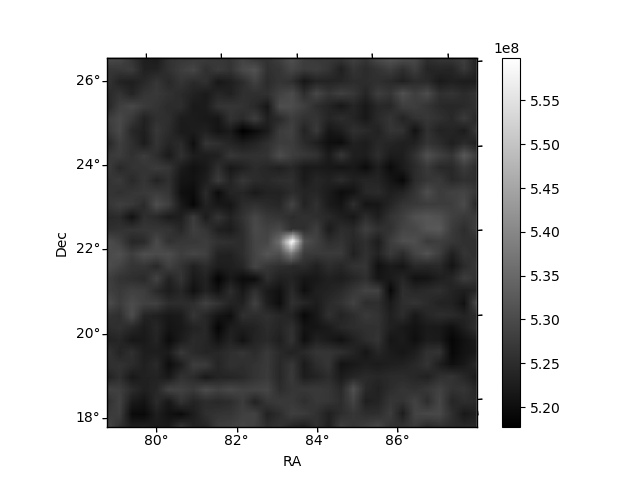
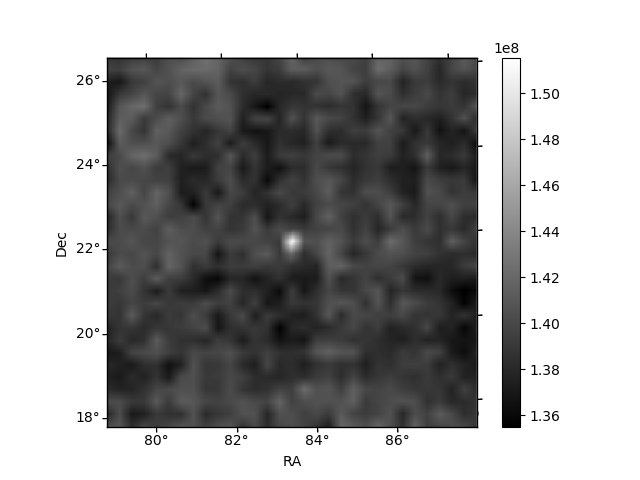
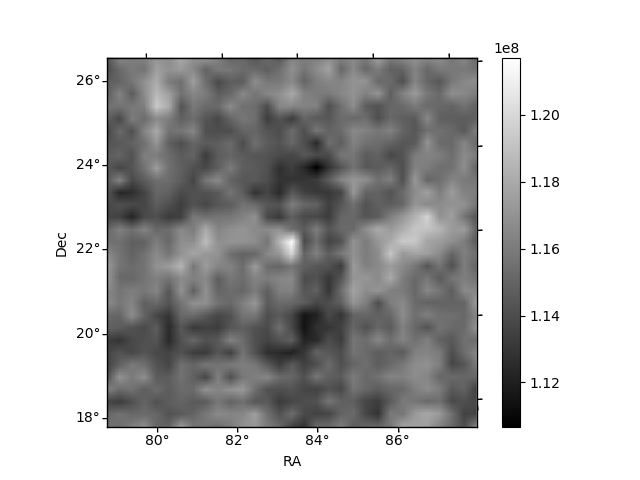
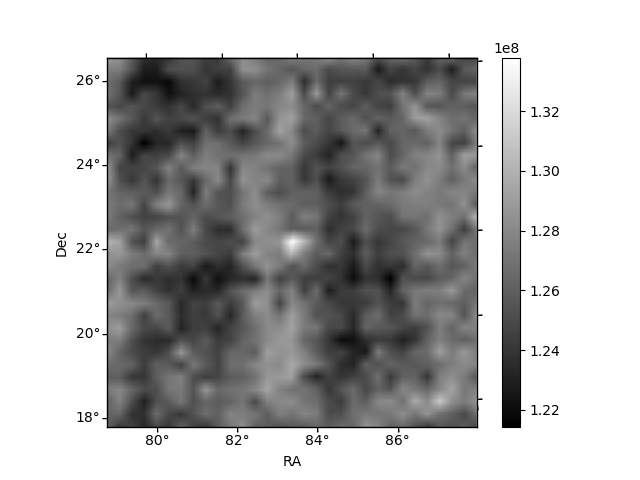
Histogram calculated using DETX and DETY for each event in the final _common_clean file
| Quadrant A | 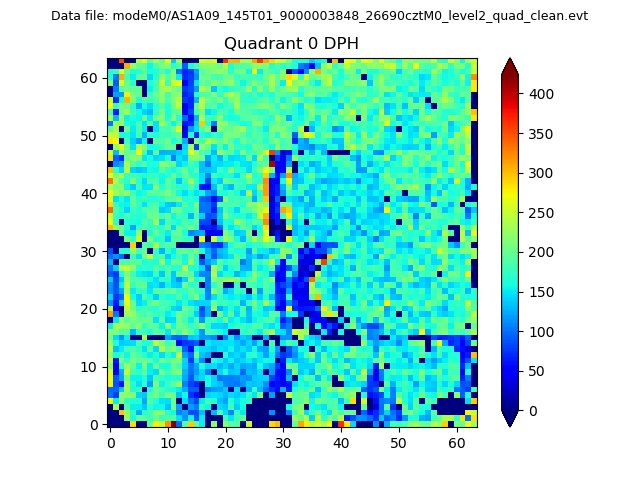 |
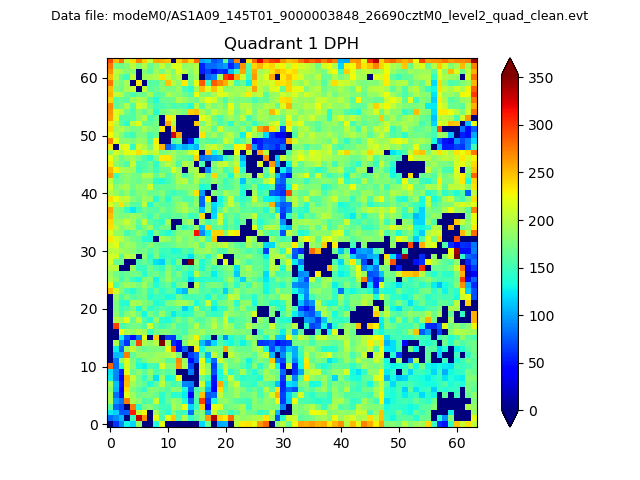 |
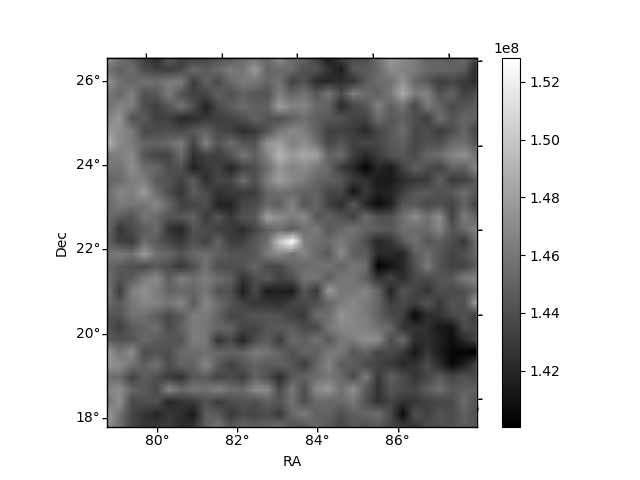
Quadrant B |
|---|---|---|---|
| Quadrant D | 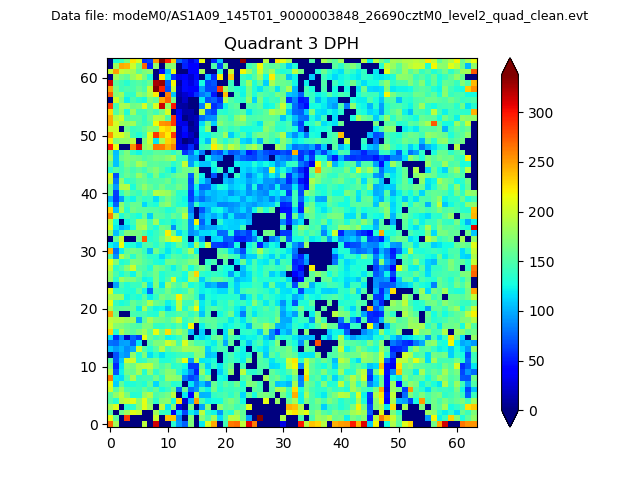 |
 |
Quadrant C |
| Plot type | Count rate plots | Images |
|---|---|---|
| Comparison with Poisson distribution Blue bars denote a histogram of data divided into 1 sec bins. Red curve is a Poisson curve with rate = median count rate of data. |
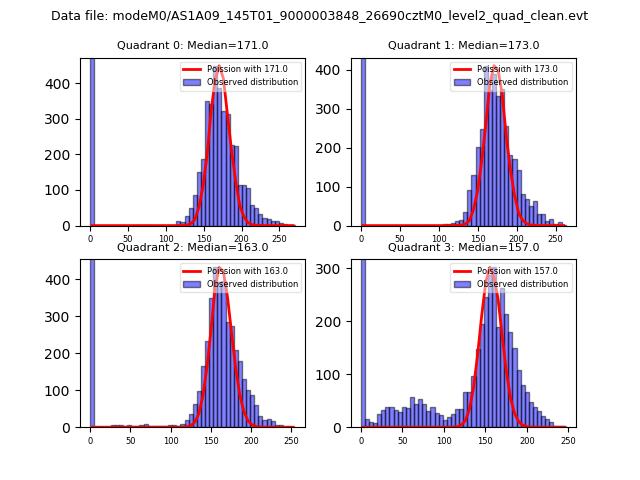 |
 |
| Quadrant-wise count rates Data is divided into 100 sec bins |
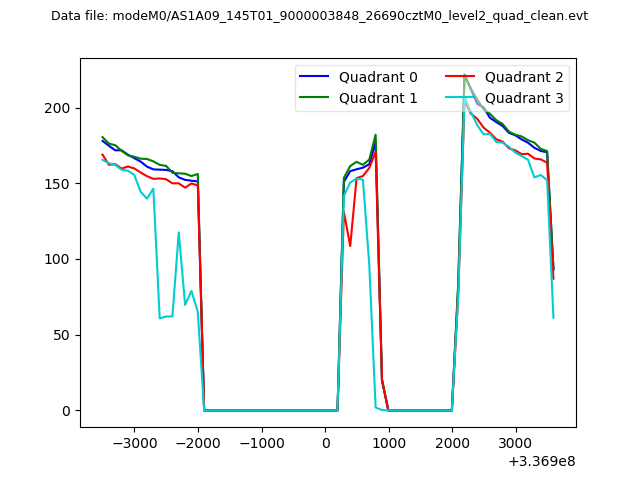 |
|
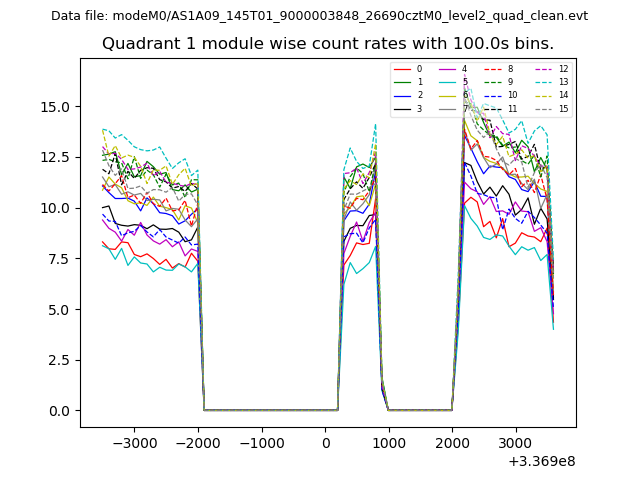
| Module-wise count rates for Quadrant A Data is divided into 100 sec bins |
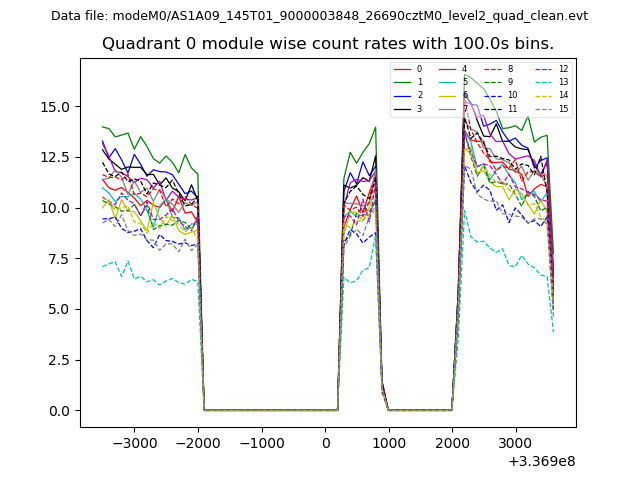 |
 |
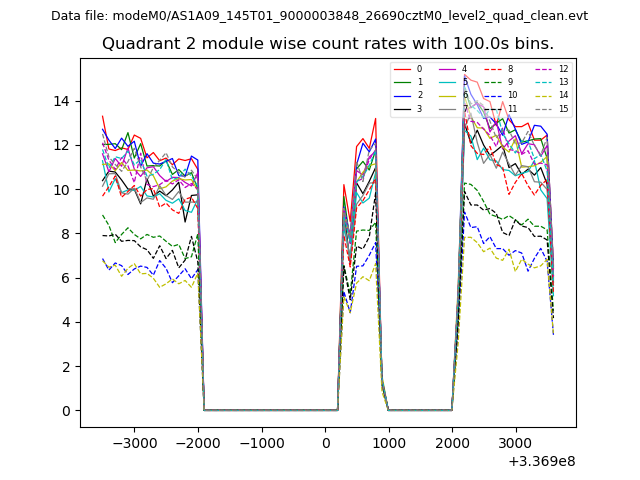
| Module-wise count rates for Quadrant B Data is divided into 100 sec bins |
 |
 |
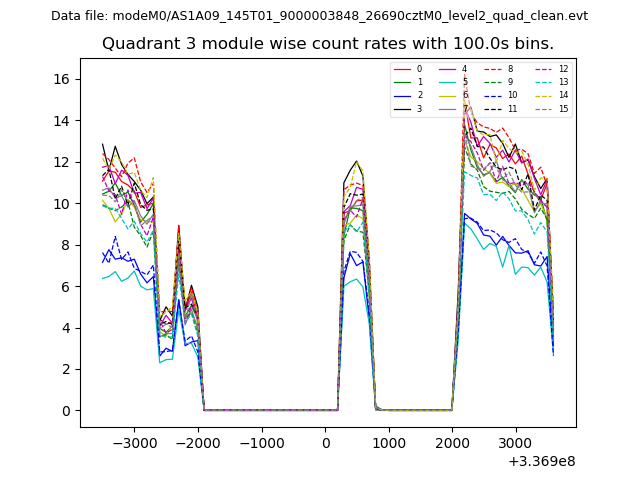
| Module-wise count rates for Quadrant C Data is divided into 100 sec bins |
 |
 |
| Module-wise count rates for Quadrant D Data is divided into 100 sec bins |
 |
 |
| Parameter | Plot |
|---|---|
| CZT HV Monitor | 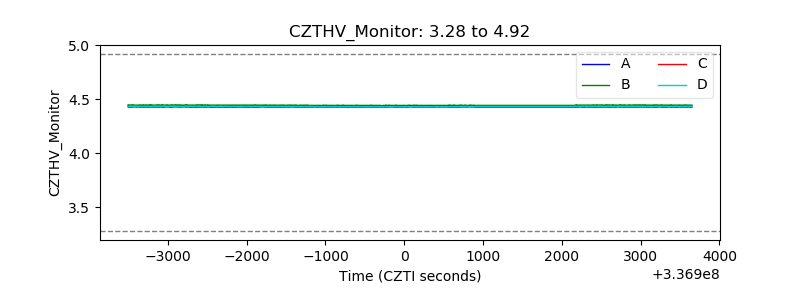 |
| D_VDD | 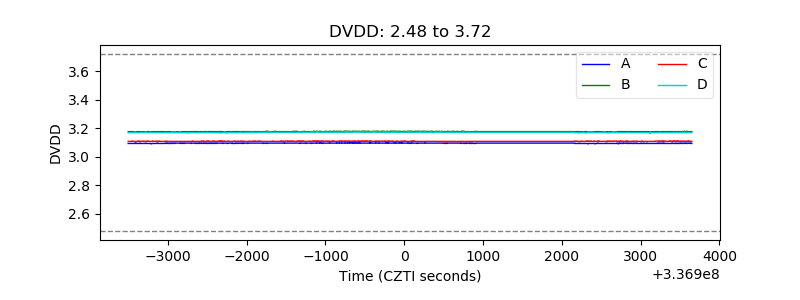 |
| Temperature 1 | 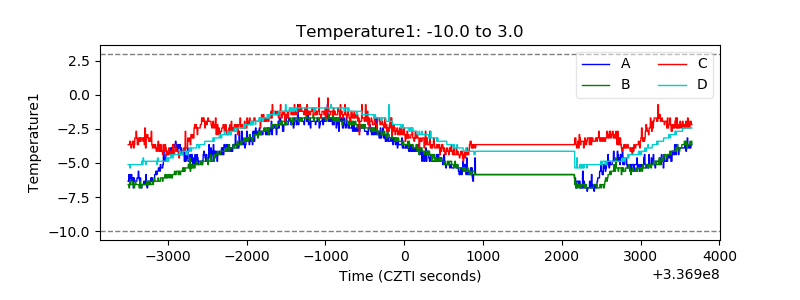 |
| Veto HV Monitor | 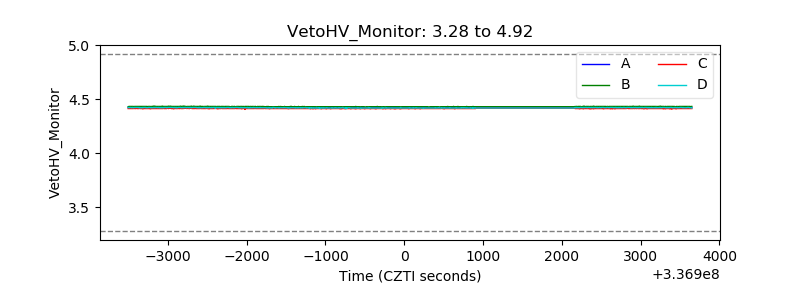 |
| Veto LLD | 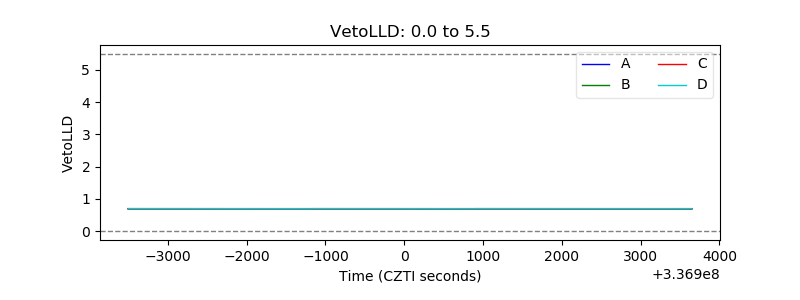 |
| Alpha Counter | 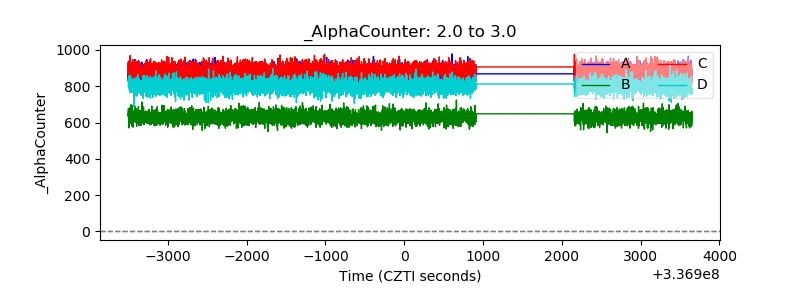 |
| _CPM_Rate | 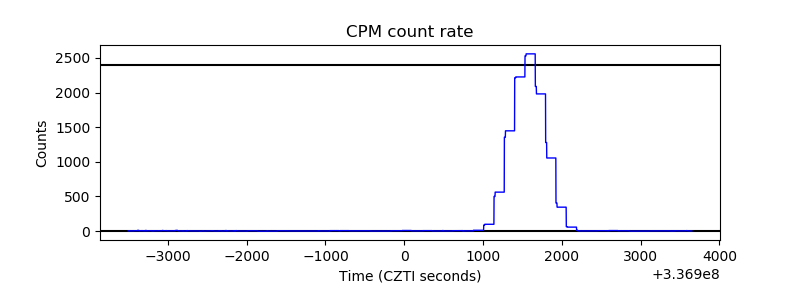 |
| CZT Counter | 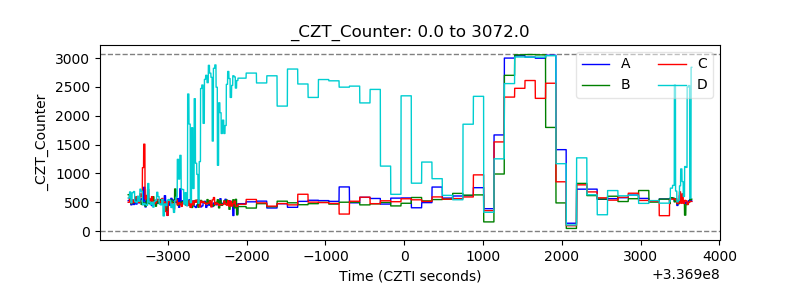 |
| +2.5 Volts monitor | 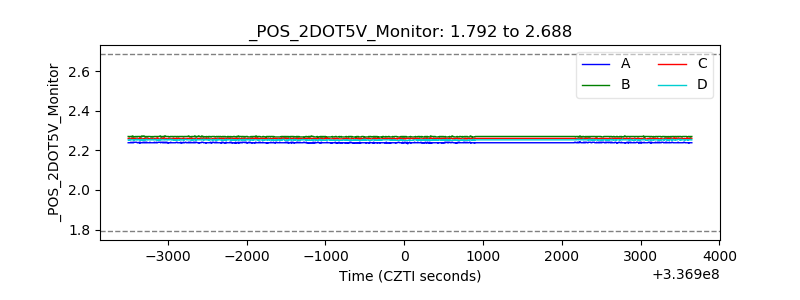 |
| +5 Volts monitor | 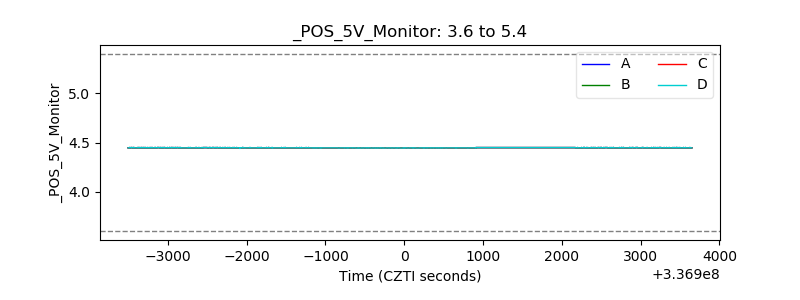 |
| _ROLL_ROT | 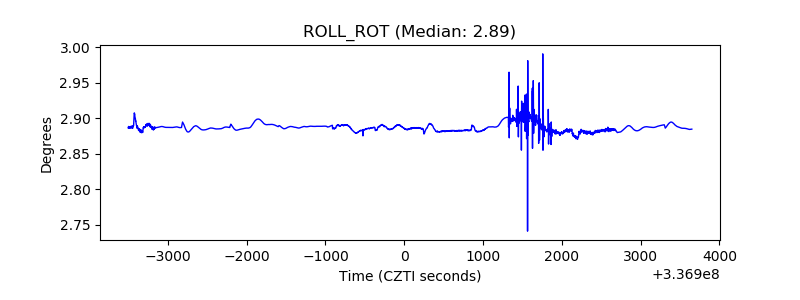 |
| _Roll_DEC | 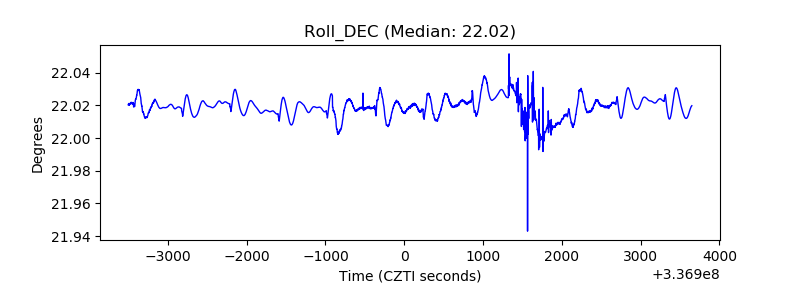 |
| _Roll_RA | 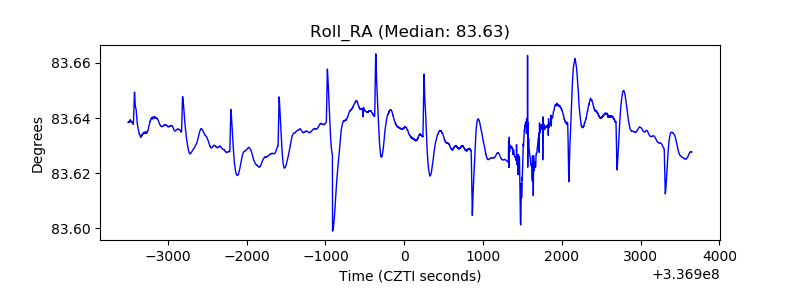 |
| Veto Counter | 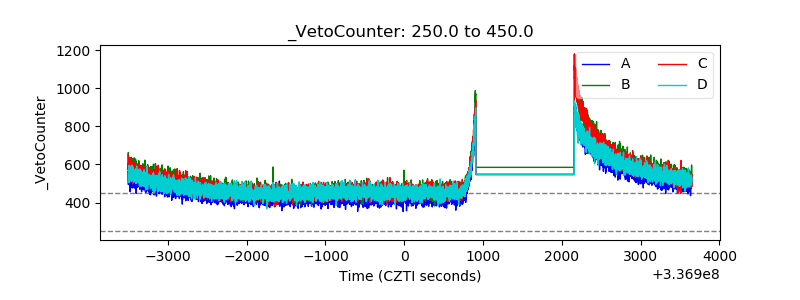 |