| Param | Original file | Final file |
|---|---|---|
| Filename | modeM0/AS1A09_145T01_9000003848_26691cztM0_level2.evt | modeM0/AS1A09_145T01_9000003848_26691cztM0_level2_quad_clean.evt |
| Size (bytes) | 483,969,600 | 88,303,680 |
| Size | 461.5 MB | 84.2 MB |
| Events in quadrant A | 3,179,095 | 591,696 |
| Events in quadrant B | 3,025,743 | 596,370 |
| Events in quadrant C | 3,215,128 | 562,120 |
| Events in quadrant D | 4,863,523 | 538,365 |
| Mode M0 | |||
|---|---|---|---|
| Quadrant | BADHDUFLAG | Total packets | Discarded packets |
| A | 0 | 12593 | 0 |
| B | 0 | 12088 | 0 |
| C | 0 | 13079 | 0 |
| D | 0 | 18109 | 0 |
| Mode M9 | |||
|---|---|---|---|
| Quadrant | BADHDUFLAG | Total packets | Discarded packets |
| A | 0 | 13 | 0 |
| B | 0 | 13 | 0 |
| C | 0 | 13 | 0 |
| D | 0 | 13 | 0 |
| Quadrant | Total seconds | Saturated seconds | Saturation percentage |
|---|---|---|---|
| A | 5511 | 87 | 1.578661% |
| B | 5512 | 65 | 1.179245% |
| C | 5512 | 95 | 1.723512% |
| D | 5511 | 349 | 6.332789% |
Noise dominated data is calculated using 1-second bins in cleaned event files. If a bin has >2000 counts, and if more than 50% of those come from <1% of pixels, then it is considered to be noise-dominated and hence unusable.
| Quadrant | # 1 sec bins | Bins with >0 counts | Bins with >2000 counts | High rate bins dominated by noise | Noise dominated (total time) | Noise dominated (detector-on time) | Marked lightcurve |
|---|---|---|---|---|---|---|---|
| A | 6811 | 5512 | 12 | 12 | 0.18% | 0.22% | 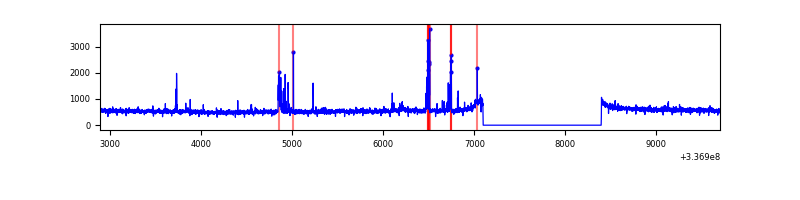 |
| B | 6812 | 5513 | 0 | 0 | 0.00% | 0.00% | 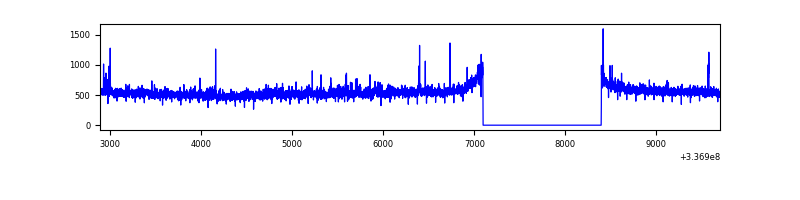 |
| C | 6812 | 5513 | 3 | 3 | 0.04% | 0.05% | 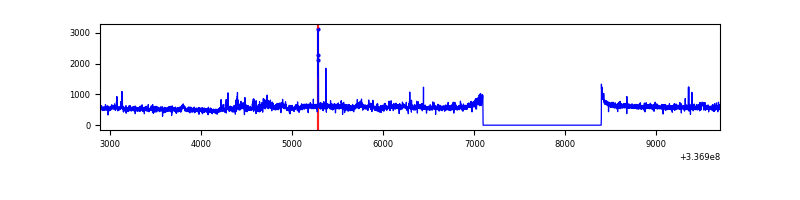 |
| D | 6811 | 5512 | 255 | 255 | 3.74% | 4.63% | 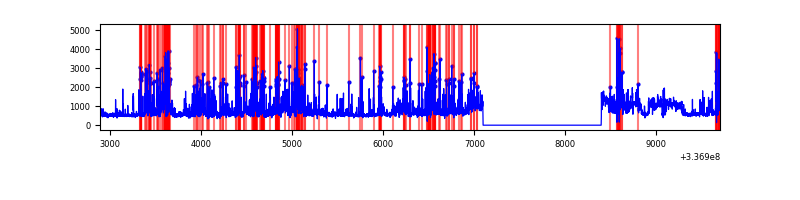 |
Top three noisy pixels from each quadrant. If the there are fewer than three noisy pixels in the level2.evt file, extra rows are filled as -1
| Pixel properties | Quadrant properties | ||||||
|---|---|---|---|---|---|---|---|
| Quadrant | DetID | PixID | Counts | Sigma | Mean | Median | Sigma |
| A | 0 | 13 | 194094 | 1245.27 | 775 | 763 | 155.3 |
| A | 13 | 254 | 8934 | 52.63 | 775 | 763 | 155.3 |
| A | 0 | 226 | 6696 | 38.22 | 775 | 763 | 155.3 |
| B | 10 | 251 | 17912 | 120.99 | 757 | 742 | 141.9 |
| B | 12 | 111 | 16133 | 108.45 | 757 | 742 | 141.9 |
| B | 11 | 111 | 14155 | 94.51 | 757 | 742 | 141.9 |
| C | 3 | 233 | 151642 | 890.4 | 725 | 732 | 169.5 |
| C | 14 | 238 | 118736 | 696.25 | 725 | 732 | 169.5 |
| C | 5 | 37 | 96520 | 565.17 | 725 | 732 | 169.5 |
| D | 1 | 52 | 1809806 | 9623.12 | 730 | 714 | 188.0 |
| D | 2 | 250 | 149049 | 789.04 | 730 | 714 | 188.0 |
| D | 7 | 80 | 96707 | 510.62 | 730 | 714 | 188.0 |
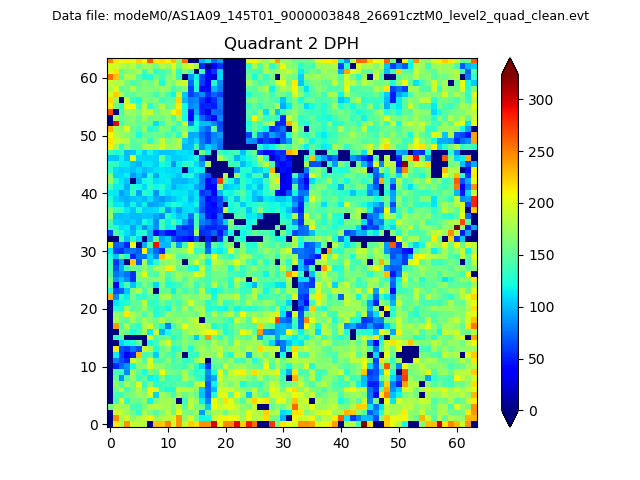
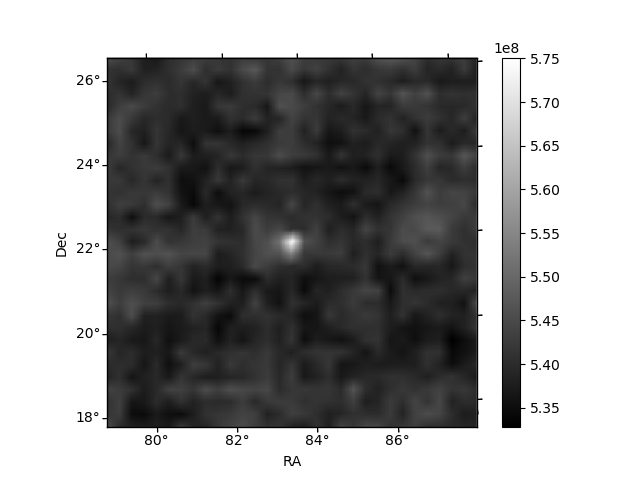
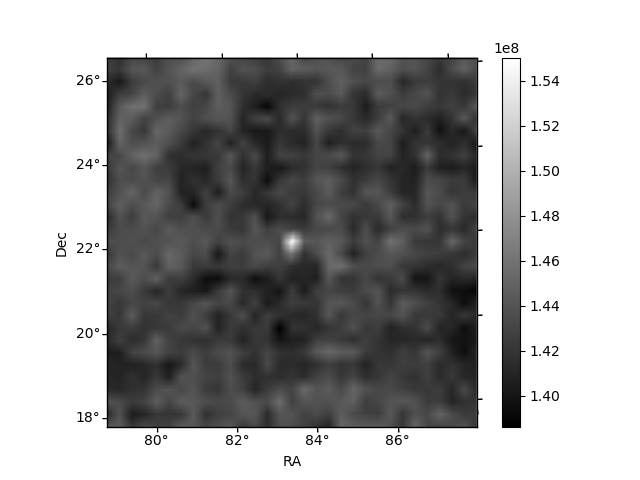
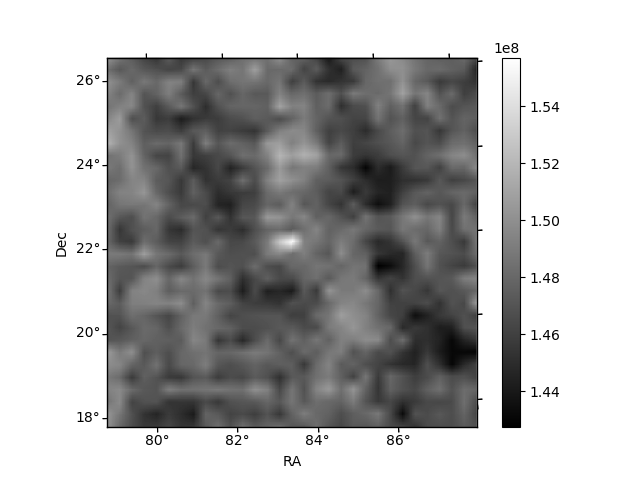
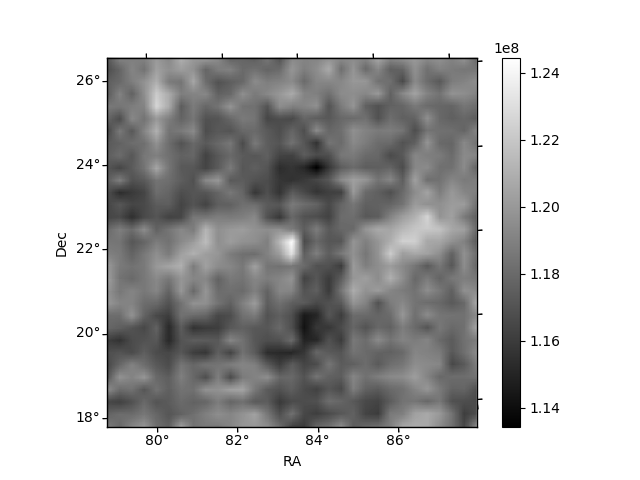
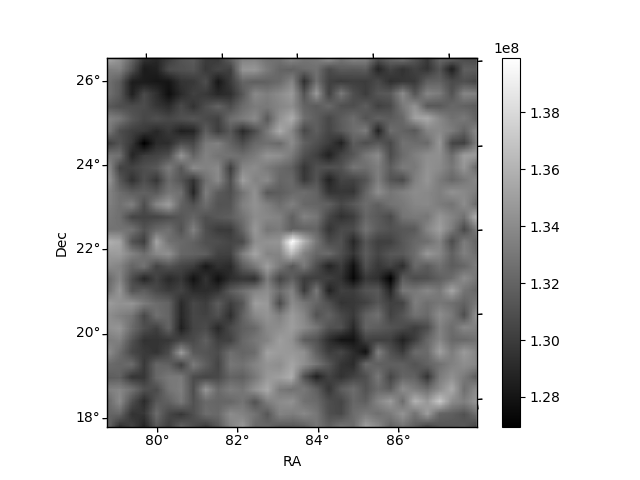
Histogram calculated using DETX and DETY for each event in the final _common_clean file
| Quadrant A | 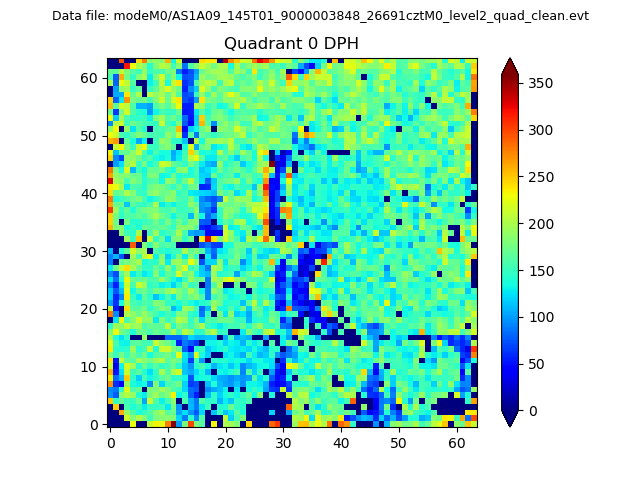 |
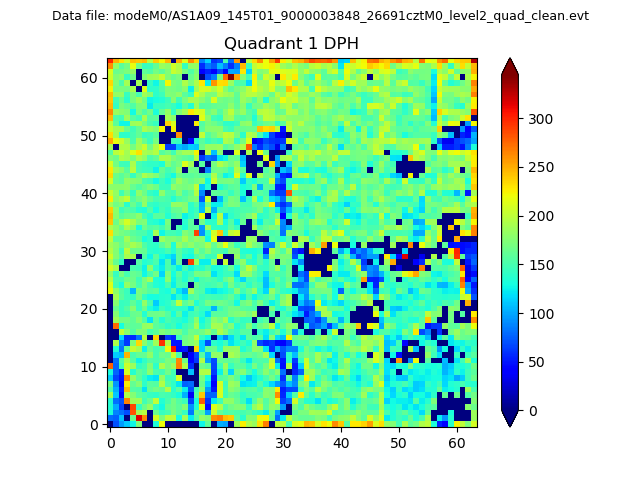 |
Quadrant B |
|---|---|---|---|
| Quadrant D | 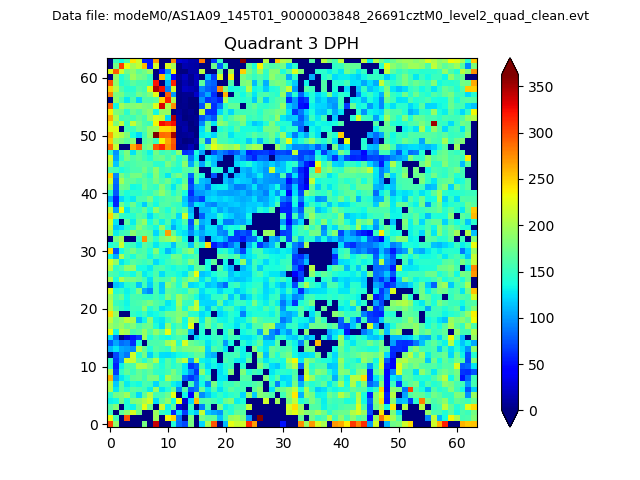 |
 |
Quadrant C |
| Plot type | Count rate plots | Images |
|---|---|---|
| Comparison with Poisson distribution Blue bars denote a histogram of data divided into 1 sec bins. Red curve is a Poisson curve with rate = median count rate of data. |
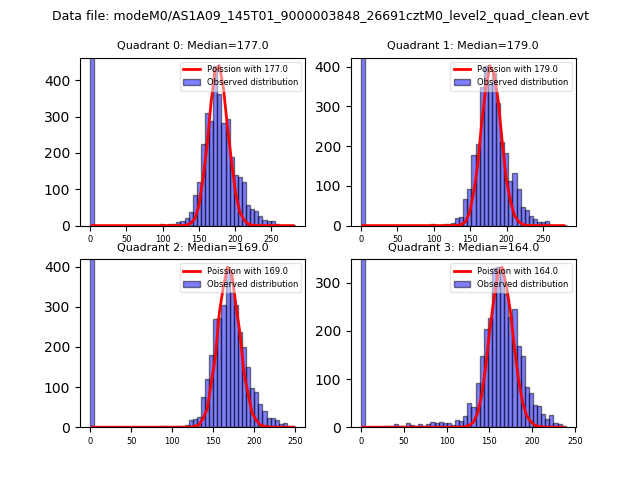 |
 |
| Quadrant-wise count rates Data is divided into 100 sec bins |
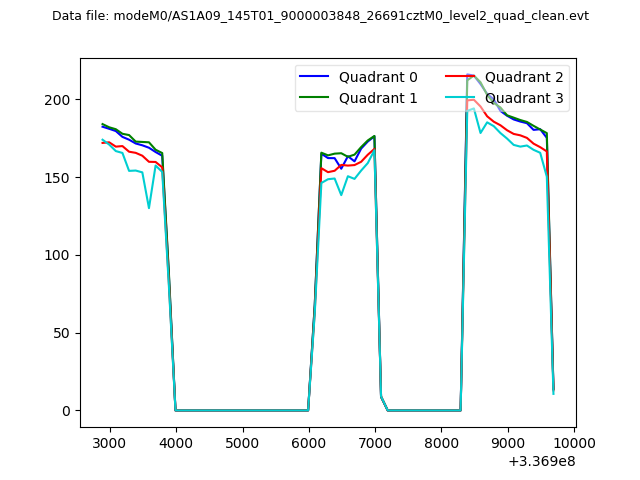 |
|
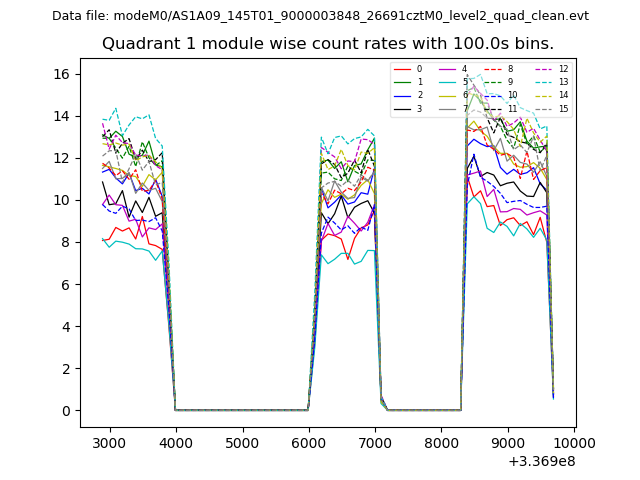
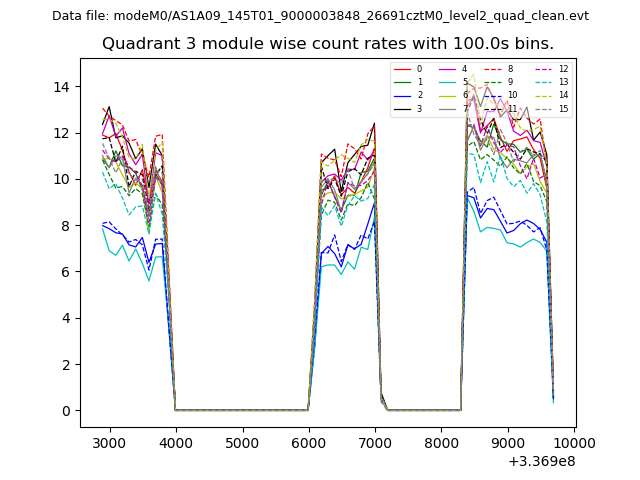
| Module-wise count rates for Quadrant A Data is divided into 100 sec bins |
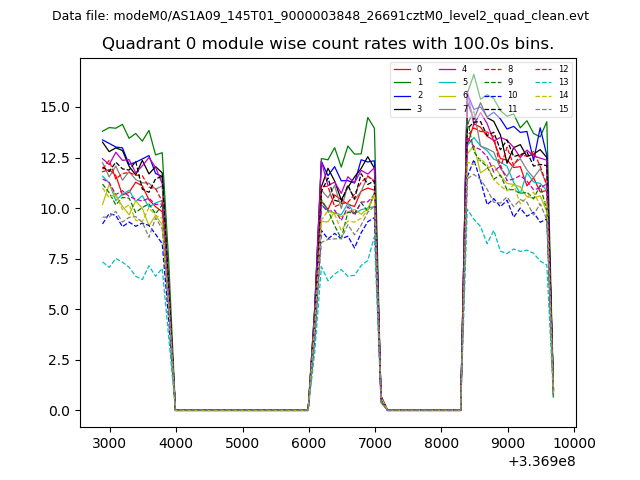 |
 |
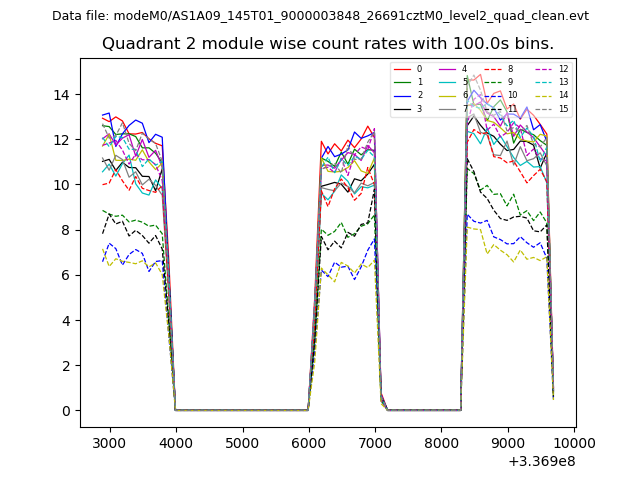
| Module-wise count rates for Quadrant B Data is divided into 100 sec bins |
 |
 |
| Module-wise count rates for Quadrant C Data is divided into 100 sec bins |
 |
 |
| Module-wise count rates for Quadrant D Data is divided into 100 sec bins |
 |
 |
| Parameter | Plot |
|---|---|
| CZT HV Monitor | 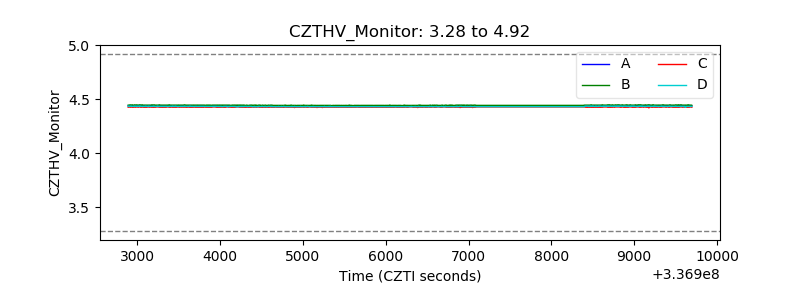 |
| D_VDD | 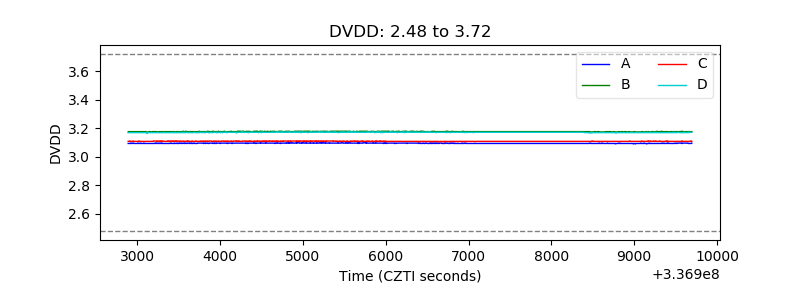 |
| Temperature 1 | 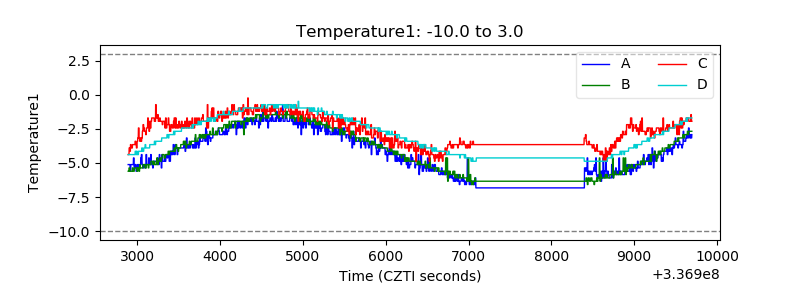 |
| Veto HV Monitor | 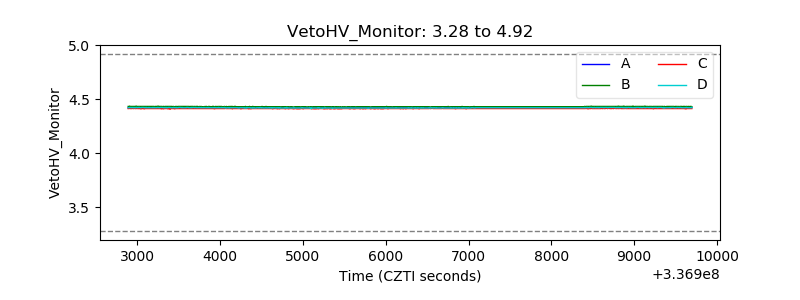 |
| Veto LLD | 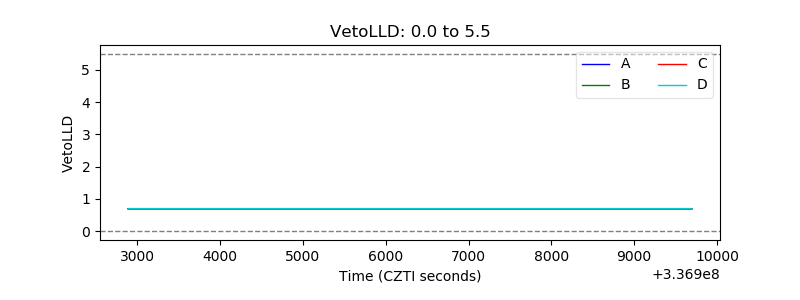 |
| Alpha Counter | 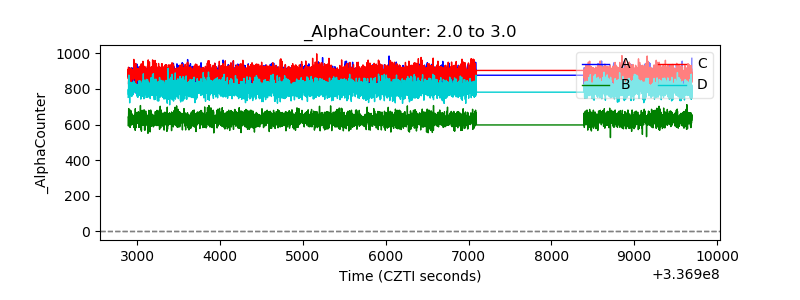 |
| _CPM_Rate | 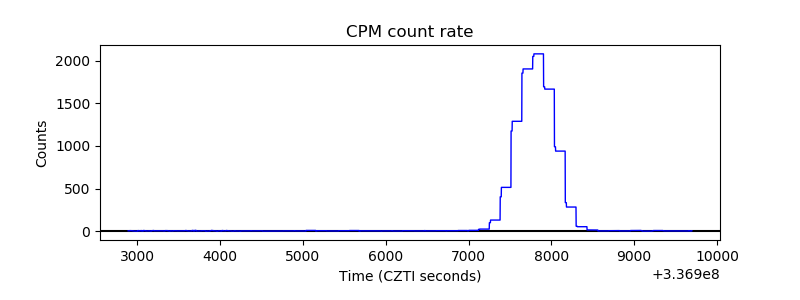 |
| CZT Counter | 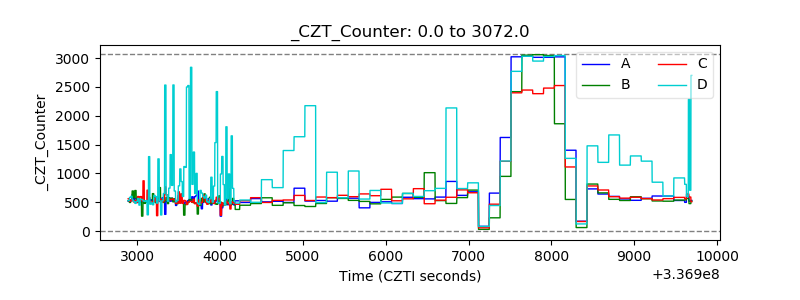 |
| +2.5 Volts monitor |  |
| +5 Volts monitor | 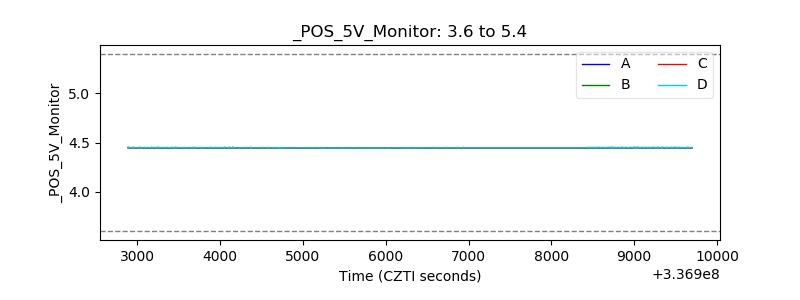 |
| _ROLL_ROT | 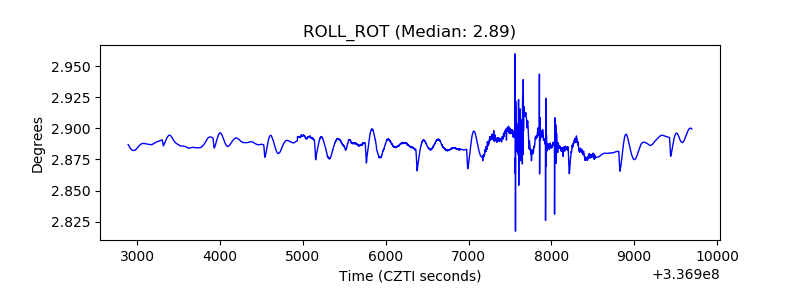 |
| _Roll_DEC | 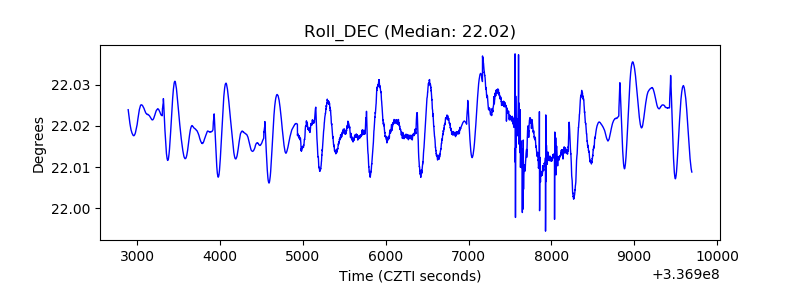 |
| _Roll_RA | 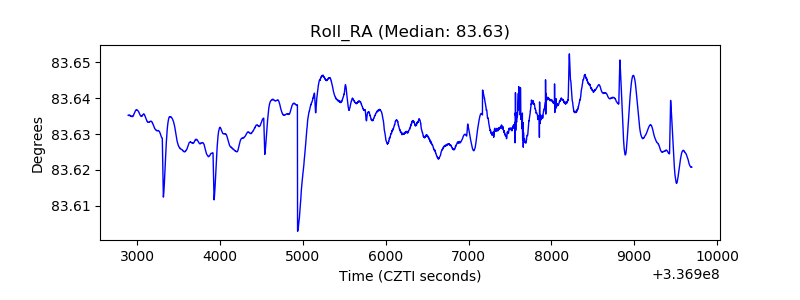 |
| Veto Counter | 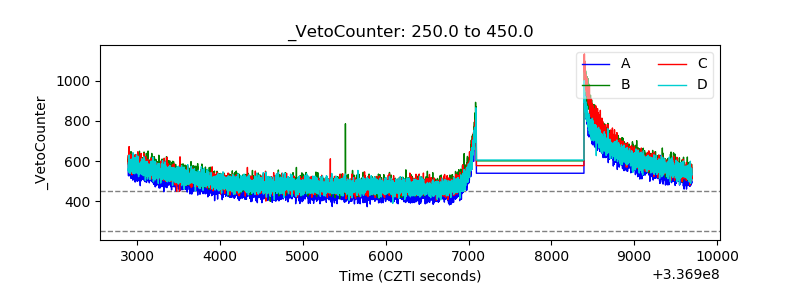 |