| Param | Original file | Final file |
|---|---|---|
| Filename | modeM0/AS1A09_145T01_9000003848_26692cztM0_level2.evt | modeM0/AS1A09_145T01_9000003848_26692cztM0_level2_quad_clean.evt |
| Size (bytes) | 545,947,200 | 78,946,560 |
| Size | 520.7 MB | 75.3 MB |
| Events in quadrant A | 3,049,881 | 526,671 |
| Events in quadrant B | 3,172,387 | 528,554 |
| Events in quadrant C | 3,170,618 | 502,274 |
| Events in quadrant D | 6,769,317 | 448,321 |
| Mode M0 | |||
|---|---|---|---|
| Quadrant | BADHDUFLAG | Total packets | Discarded packets |
| A | 0 | 12127 | 0 |
| B | 0 | 12694 | 0 |
| C | 0 | 12628 | 0 |
| D | 0 | 23927 | 0 |
| Mode M9 | |||
|---|---|---|---|
| Quadrant | BADHDUFLAG | Total packets | Discarded packets |
| A | 0 | 13 | 0 |
| B | 0 | 13 | 0 |
| C | 0 | 13 | 0 |
| D | 0 | 13 | 0 |
| Quadrant | Total seconds | Saturated seconds | Saturation percentage |
|---|---|---|---|
| A | 5493 | 51 | 0.928454% |
| B | 5493 | 65 | 1.183324% |
| C | 5493 | 80 | 1.456399% |
| D | 5494 | 938 | 17.073171% |
Noise dominated data is calculated using 1-second bins in cleaned event files. If a bin has >2000 counts, and if more than 50% of those come from <1% of pixels, then it is considered to be noise-dominated and hence unusable.
| Quadrant | # 1 sec bins | Bins with >0 counts | Bins with >2000 counts | High rate bins dominated by noise | Noise dominated (total time) | Noise dominated (detector-on time) | Marked lightcurve |
|---|---|---|---|---|---|---|---|
| A | 6793 | 5494 | 2 | 2 | 0.03% | 0.04% | 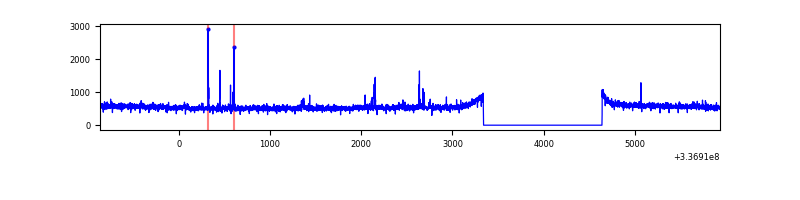 |
| B | 6793 | 5494 | 4 | 4 | 0.06% | 0.07% | 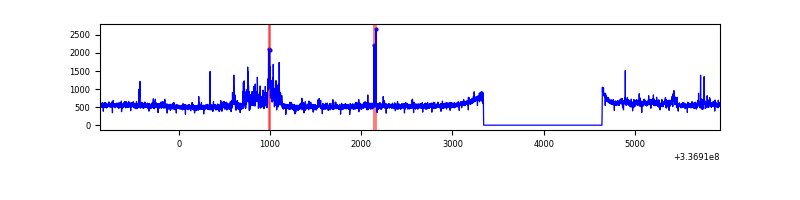 |
| C | 6793 | 5494 | 3 | 3 | 0.04% | 0.05% | 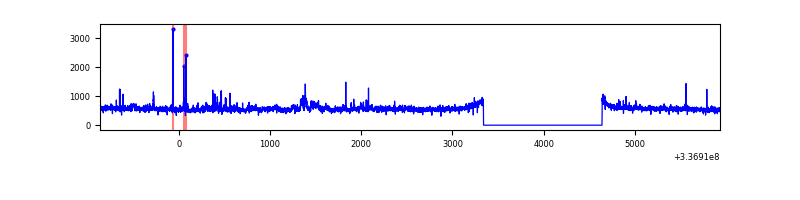 |
| D | 6794 | 5495 | 832 | 832 | 12.25% | 15.14% | 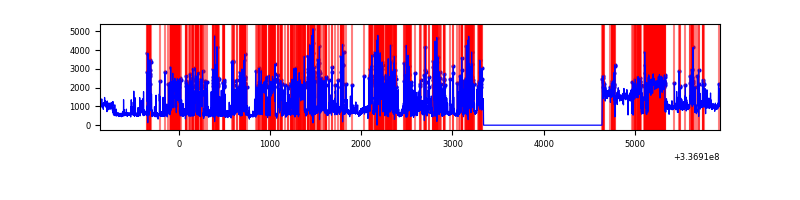 |
Top three noisy pixels from each quadrant. If the there are fewer than three noisy pixels in the level2.evt file, extra rows are filled as -1
| Pixel properties | Quadrant properties | ||||||
|---|---|---|---|---|---|---|---|
| Quadrant | DetID | PixID | Counts | Sigma | Mean | Median | Sigma |
| A | 0 | 13 | 63114 | 403.12 | 773 | 763 | 154.7 |
| A | 13 | 254 | 9405 | 55.87 | 773 | 763 | 154.7 |
| A | 5 | 168 | 8269 | 48.53 | 773 | 763 | 154.7 |
| B | 15 | 33 | 151635 | 1068.8 | 753 | 738 | 141.2 |
| B | 0 | 189 | 48093 | 335.41 | 753 | 738 | 141.2 |
| B | 12 | 111 | 16023 | 108.26 | 753 | 738 | 141.2 |
| C | 3 | 233 | 174759 | 1038.92 | 723 | 729 | 167.5 |
| C | 14 | 238 | 119805 | 710.86 | 723 | 729 | 167.5 |
| C | 2 | 16 | 45295 | 266.05 | 723 | 729 | 167.5 |
| D | 1 | 52 | 3025054 | 17520.64 | 705 | 686 | 172.6 |
| D | 7 | 80 | 963989 | 5580.57 | 705 | 686 | 172.6 |
| D | 2 | 250 | 61384 | 351.63 | 705 | 686 | 172.6 |
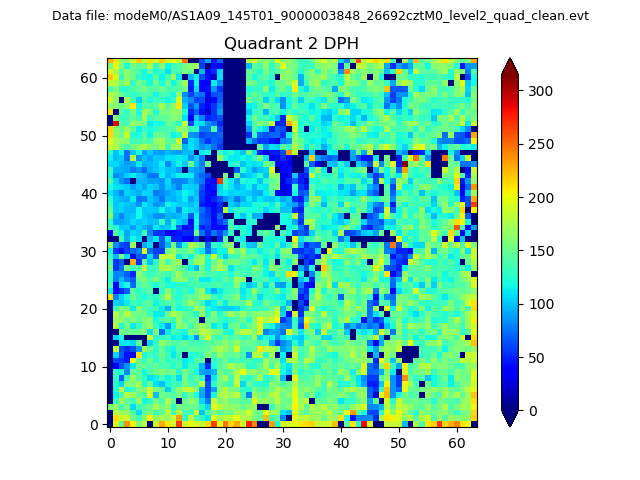
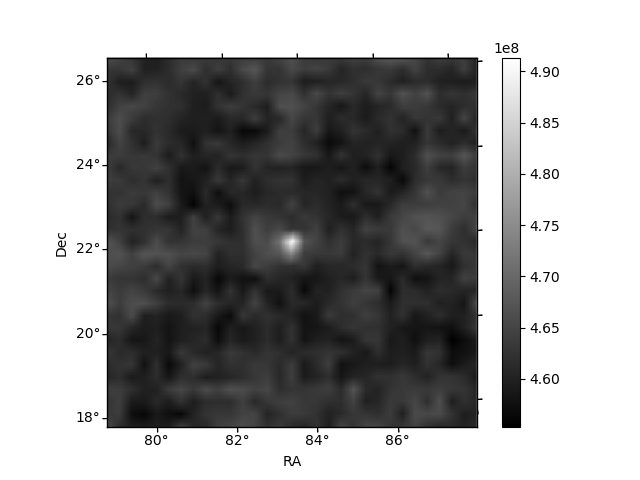
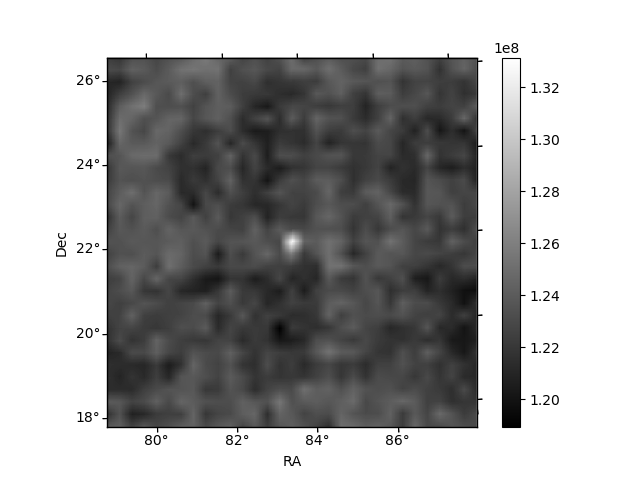
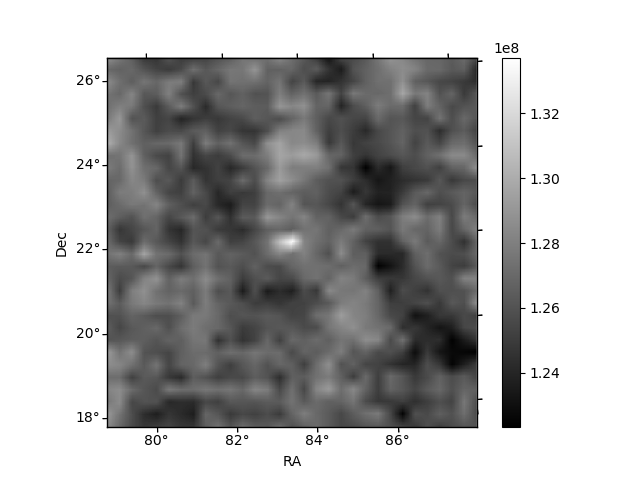
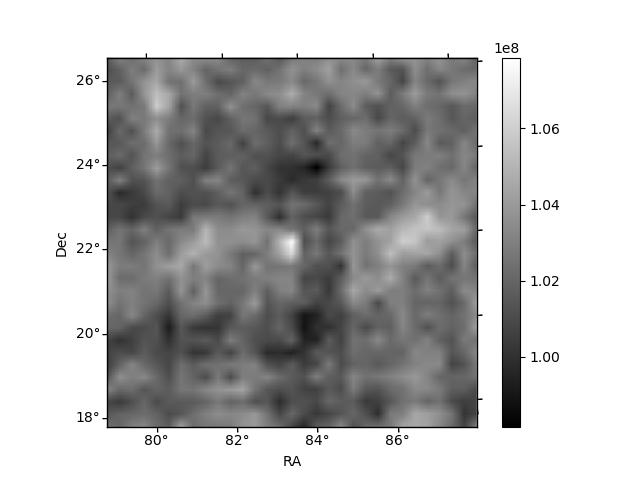
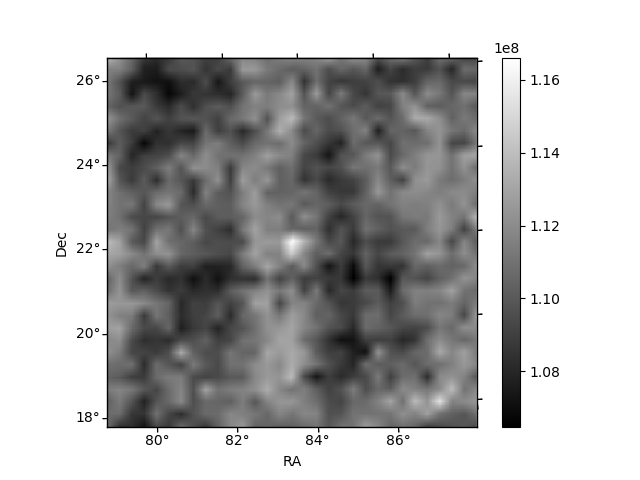
Histogram calculated using DETX and DETY for each event in the final _common_clean file
| Quadrant A | 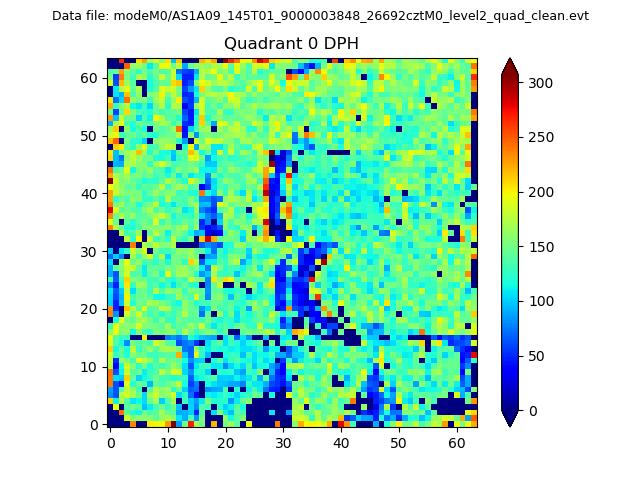 |
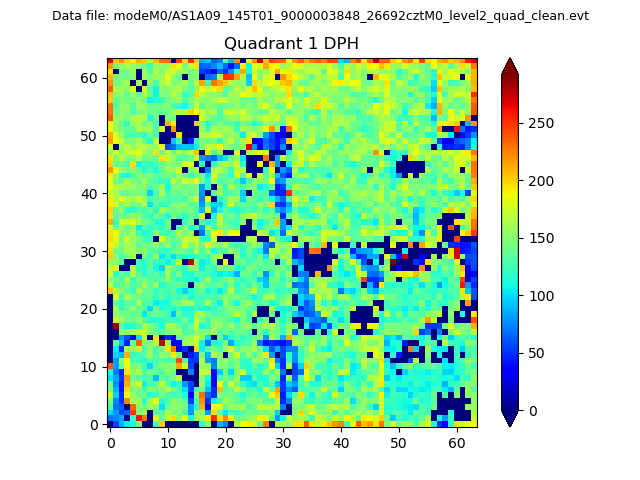 |
Quadrant B |
|---|---|---|---|
| Quadrant D | 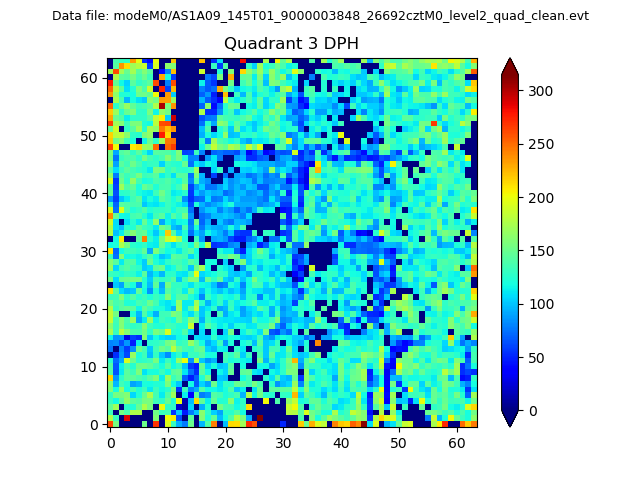 |
 |
Quadrant C |
| Plot type | Count rate plots | Images |
|---|---|---|
| Comparison with Poisson distribution Blue bars denote a histogram of data divided into 1 sec bins. Red curve is a Poisson curve with rate = median count rate of data. |
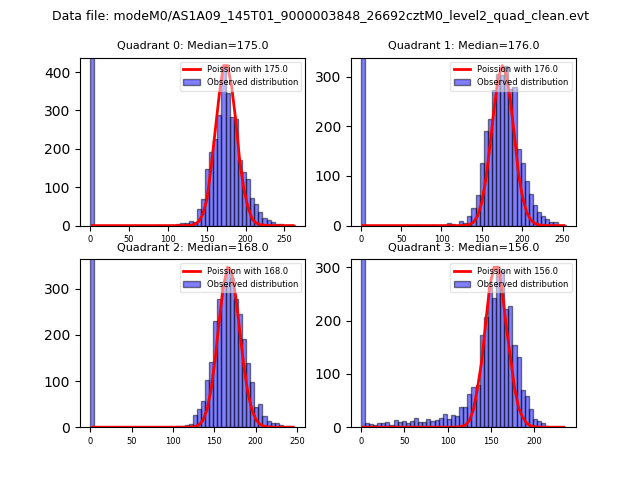 |
 |
| Quadrant-wise count rates Data is divided into 100 sec bins |
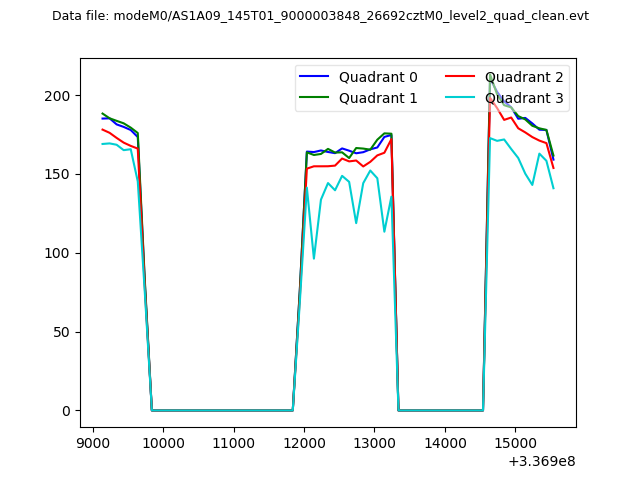 |
|
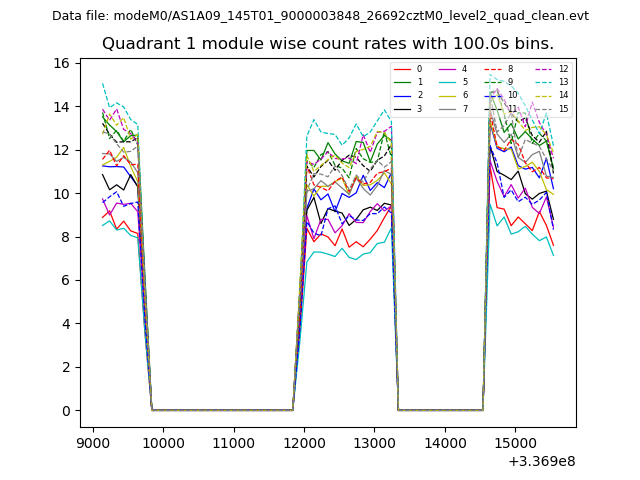
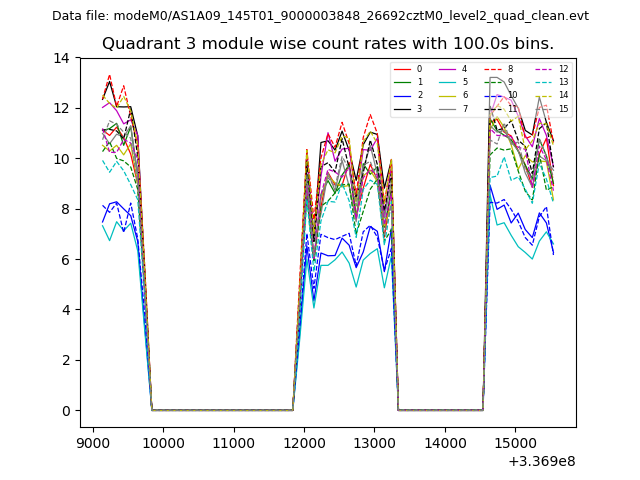
| Module-wise count rates for Quadrant A Data is divided into 100 sec bins |
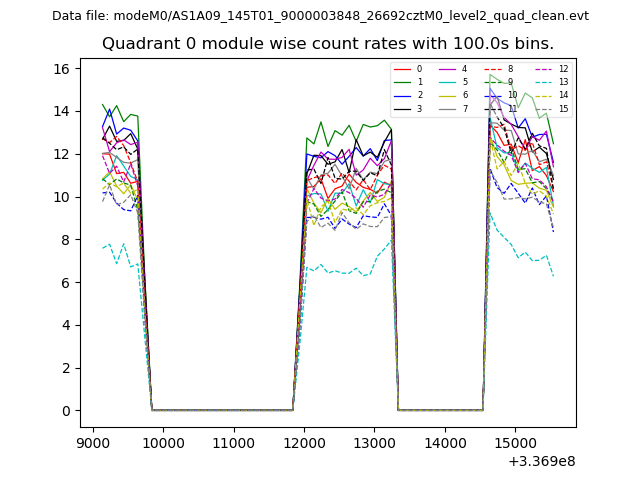 |
 |
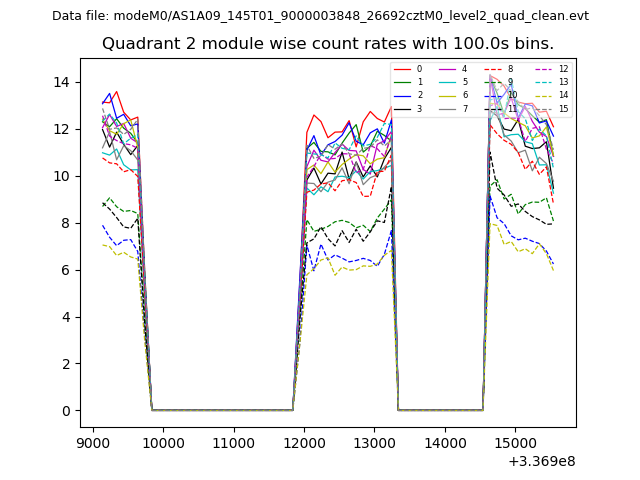
| Module-wise count rates for Quadrant B Data is divided into 100 sec bins |
 |
 |
| Module-wise count rates for Quadrant C Data is divided into 100 sec bins |
 |
 |
| Module-wise count rates for Quadrant D Data is divided into 100 sec bins |
 |
 |
| Parameter | Plot |
|---|---|
| CZT HV Monitor | 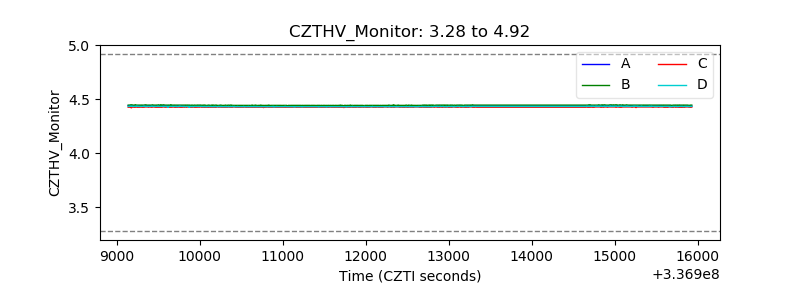 |
| D_VDD | 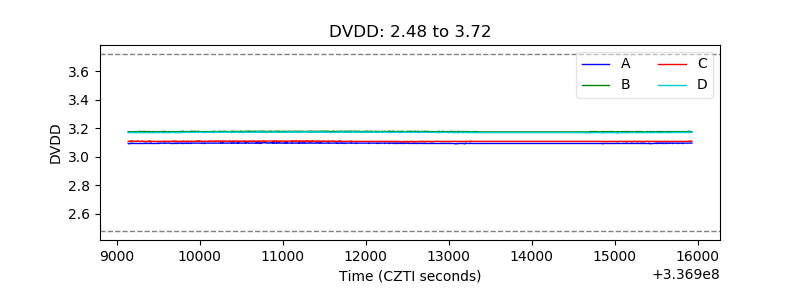 |
| Temperature 1 | 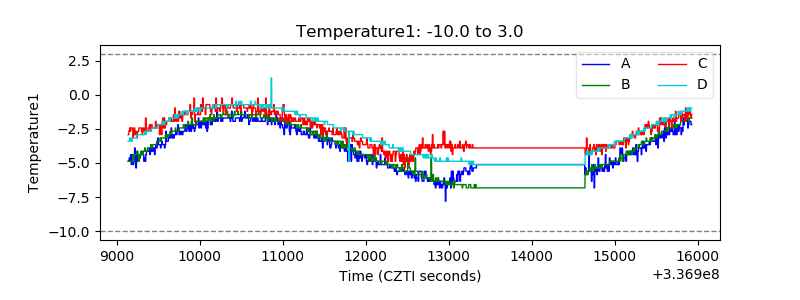 |
| Veto HV Monitor | 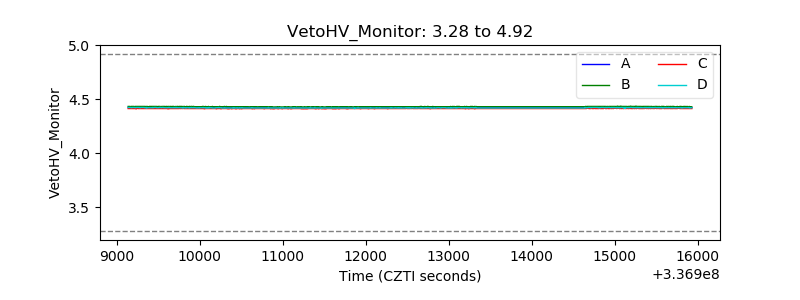 |
| Veto LLD | 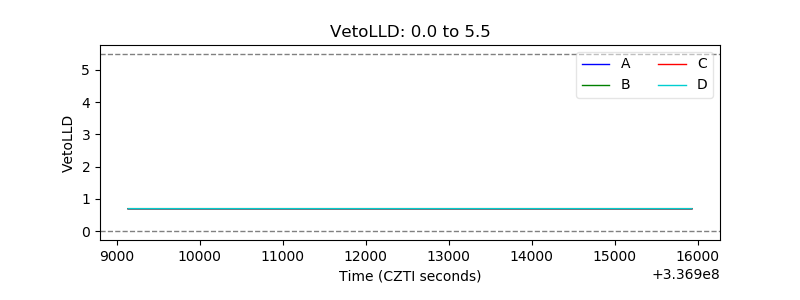 |
| Alpha Counter | 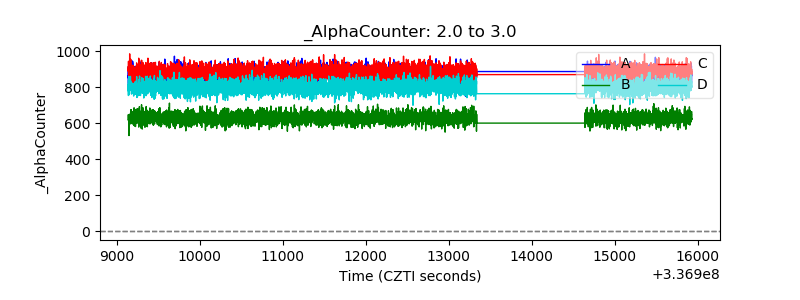 |
| _CPM_Rate | 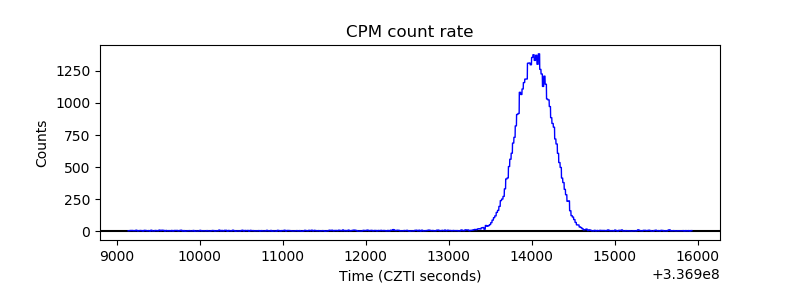 |
| CZT Counter | 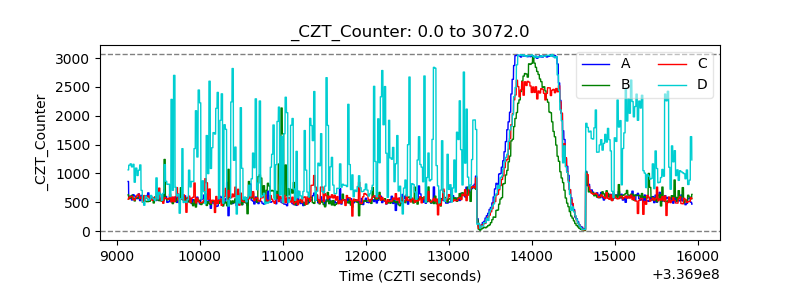 |
| +2.5 Volts monitor |  |
| +5 Volts monitor |  |
| _ROLL_ROT | 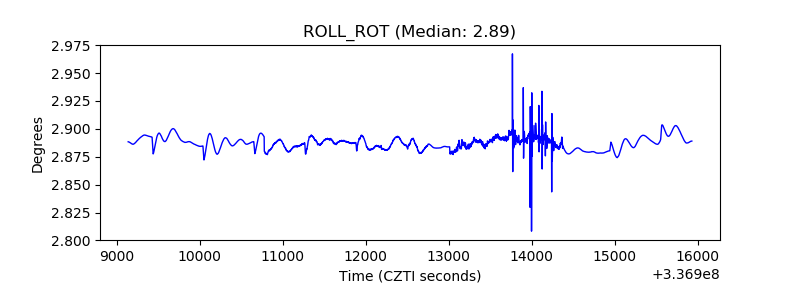 |
| _Roll_DEC | 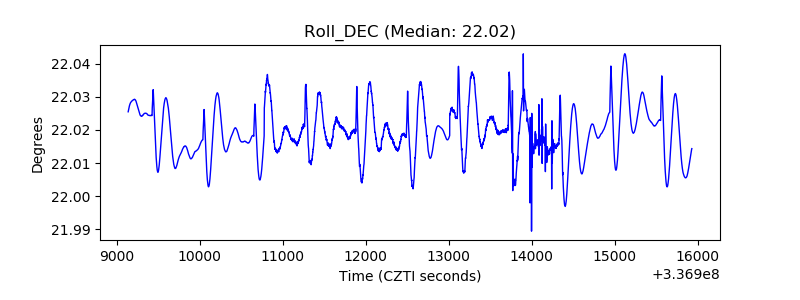 |
| _Roll_RA | 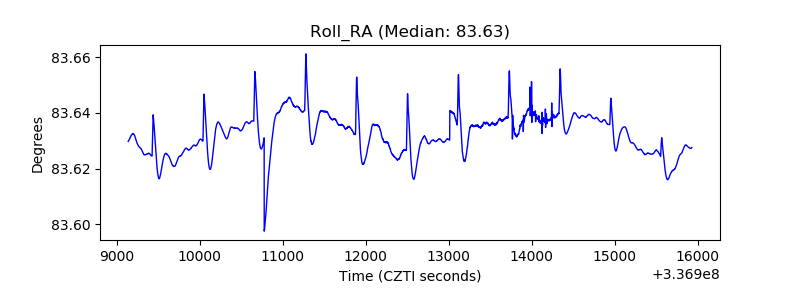 |
| Veto Counter | 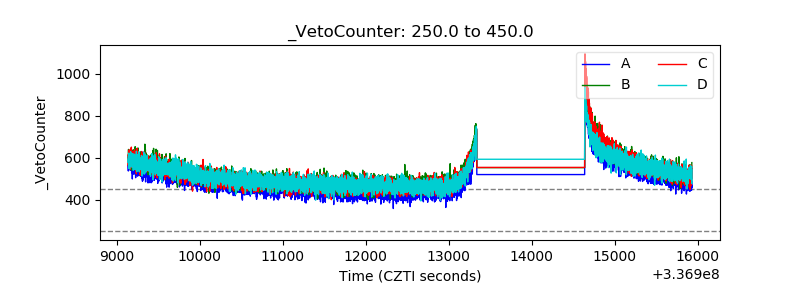 |