| Param | Original file | Final file |
|---|---|---|
| Filename | modeM0/AS1A09_145T01_9000003848_26693cztM0_level2.evt | modeM0/AS1A09_145T01_9000003848_26693cztM0_level2_quad_clean.evt |
| Size (bytes) | 638,671,680 | 84,931,200 |
| Size | 609.1 MB | 81.0 MB |
| Events in quadrant A | 3,371,226 | 559,283 |
| Events in quadrant B | 3,684,736 | 560,685 |
| Events in quadrant C | 3,796,051 | 537,198 |
| Events in quadrant D | 8,067,566 | 478,112 |
| Mode M0 | |||
|---|---|---|---|
| Quadrant | BADHDUFLAG | Total packets | Discarded packets |
| A | 0 | 13530 | 0 |
| B | 0 | 14789 | 0 |
| C | 0 | 15052 | 0 |
| D | 0 | 28446 | 0 |
| Mode M9 | |||
|---|---|---|---|
| Quadrant | BADHDUFLAG | Total packets | Discarded packets |
| A | 0 | 12 | 0 |
| B | 0 | 12 | 0 |
| C | 0 | 12 | 0 |
| D | 0 | 12 | 0 |
| Quadrant | Total seconds | Saturated seconds | Saturation percentage |
|---|---|---|---|
| A | 6255 | 110 | 1.758593% |
| B | 6256 | 128 | 2.046036% |
| C | 6256 | 163 | 2.605499% |
| D | 6256 | 1305 | 20.859974% |
Noise dominated data is calculated using 1-second bins in cleaned event files. If a bin has >2000 counts, and if more than 50% of those come from <1% of pixels, then it is considered to be noise-dominated and hence unusable.
| Quadrant | # 1 sec bins | Bins with >0 counts | Bins with >2000 counts | High rate bins dominated by noise | Noise dominated (total time) | Noise dominated (detector-on time) | Marked lightcurve |
|---|---|---|---|---|---|---|---|
| A | 7415 | 6257 | 2 | 2 | 0.03% | 0.03% | 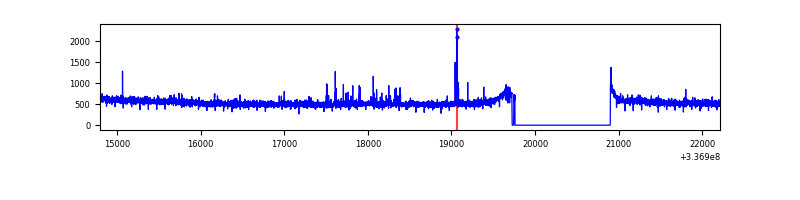 |
| B | 7416 | 6258 | 6 | 6 | 0.08% | 0.10% | 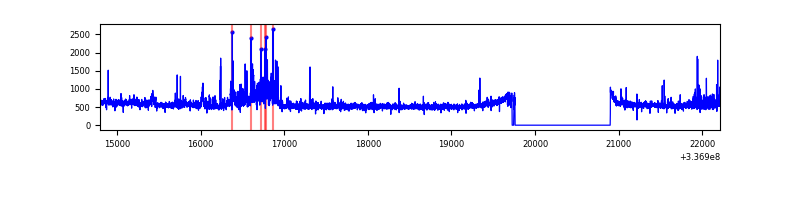 |
| C | 7416 | 6258 | 15 | 15 | 0.20% | 0.24% | 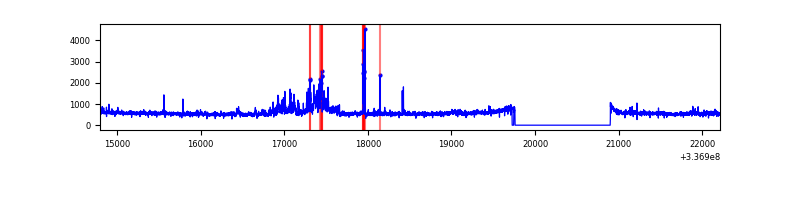 |
| D | 7416 | 6257 | 982 | 982 | 13.24% | 15.69% | 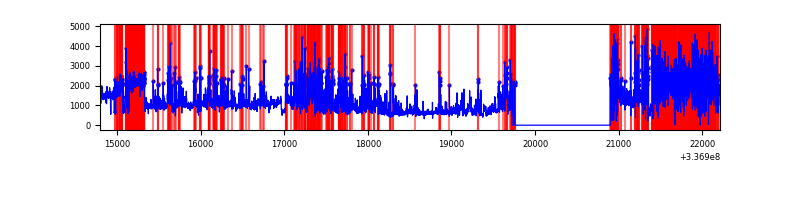 |
Top three noisy pixels from each quadrant. If the there are fewer than three noisy pixels in the level2.evt file, extra rows are filled as -1
| Pixel properties | Quadrant properties | ||||||
|---|---|---|---|---|---|---|---|
| Quadrant | DetID | PixID | Counts | Sigma | Mean | Median | Sigma |
| A | 0 | 13 | 50734 | 290.02 | 861 | 848 | 172.0 |
| A | 13 | 254 | 11331 | 60.94 | 861 | 848 | 172.0 |
| A | 0 | 226 | 7309 | 37.56 | 861 | 848 | 172.0 |
| B | 15 | 33 | 178234 | 1116.42 | 841 | 824 | 158.9 |
| B | 0 | 189 | 125434 | 784.16 | 841 | 824 | 158.9 |
| B | 15 | 32 | 34567 | 212.34 | 841 | 824 | 158.9 |
| C | 3 | 233 | 440352 | 2340.95 | 811 | 820 | 187.8 |
| C | 14 | 238 | 133080 | 704.42 | 811 | 820 | 187.8 |
| C | 15 | 208 | 44043 | 230.21 | 811 | 820 | 187.8 |
| D | 7 | 80 | 3665641 | 19886.4 | 757 | 737 | 184.3 |
| D | 1 | 52 | 1440030 | 7809.85 | 757 | 737 | 184.3 |
| D | 2 | 250 | 57764 | 309.44 | 757 | 737 | 184.3 |
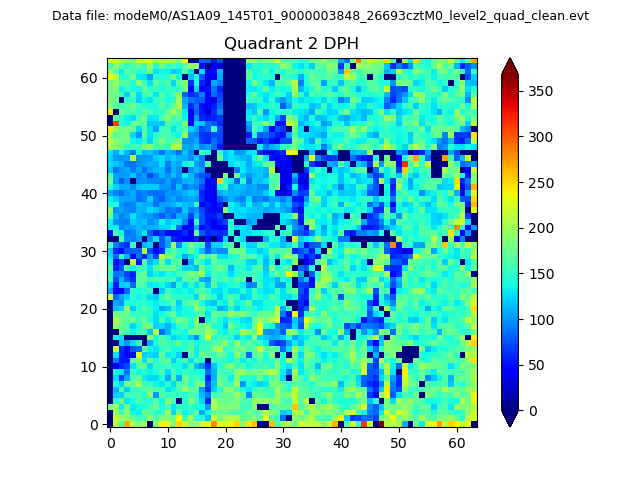
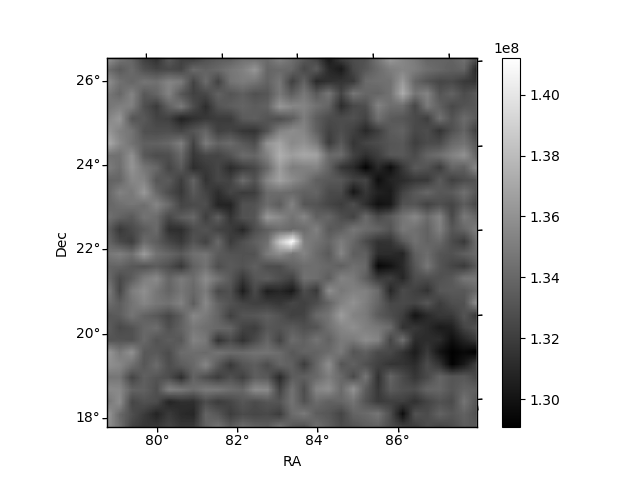
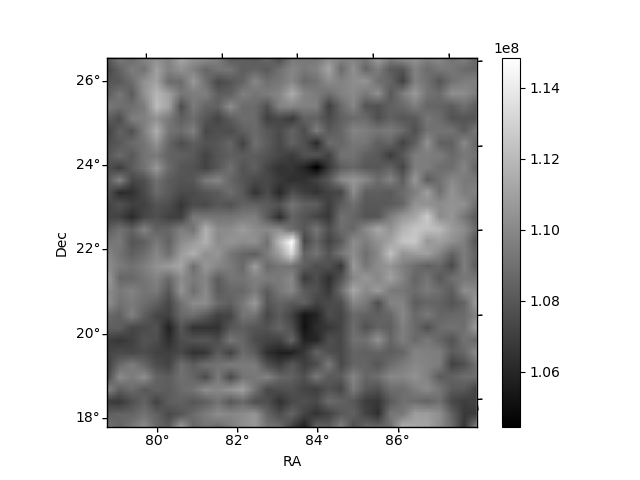
Histogram calculated using DETX and DETY for each event in the final _common_clean file
| Quadrant A | 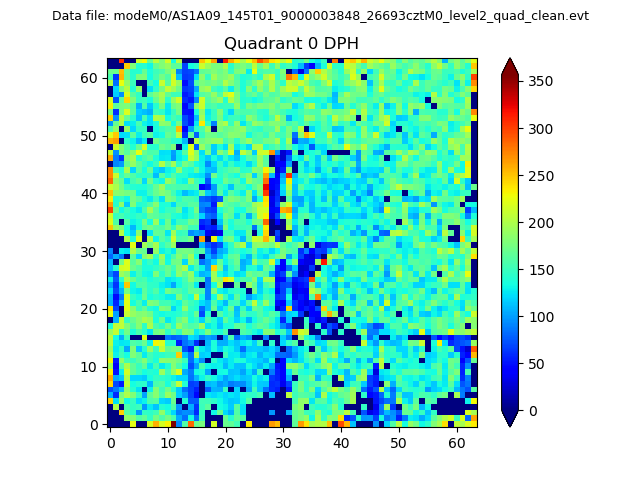 |
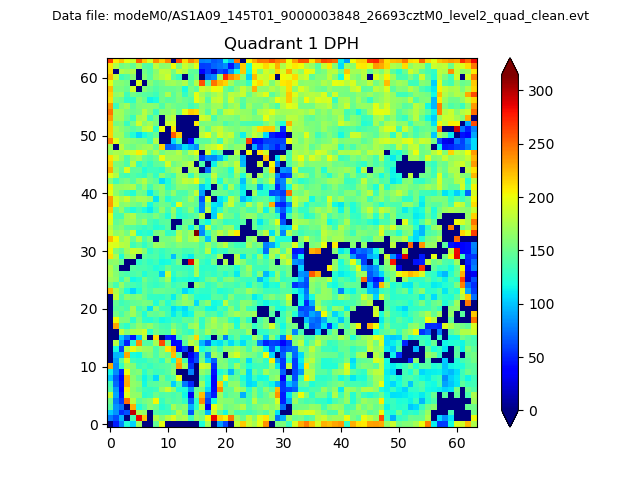 |
Quadrant B |
|---|---|---|---|
| Quadrant D | 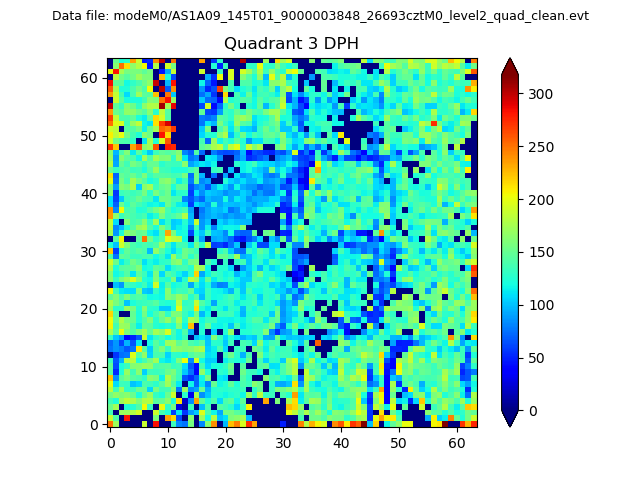 |
 |
Quadrant C |
| Plot type | Count rate plots | Images |
|---|---|---|
| Comparison with Poisson distribution Blue bars denote a histogram of data divided into 1 sec bins. Red curve is a Poisson curve with rate = median count rate of data. |
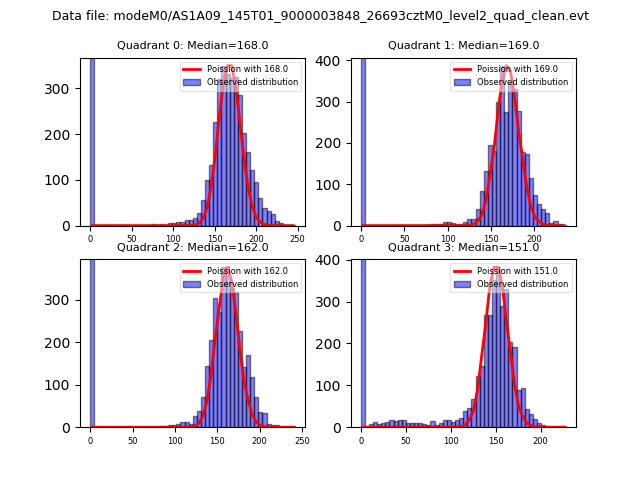 |
 |
| Quadrant-wise count rates Data is divided into 100 sec bins |
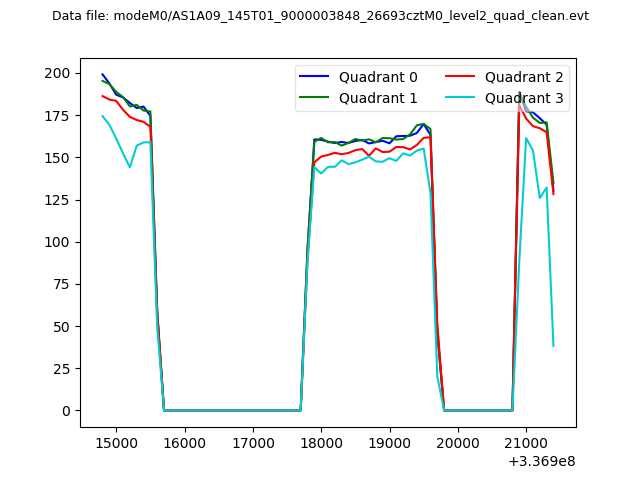 |
|
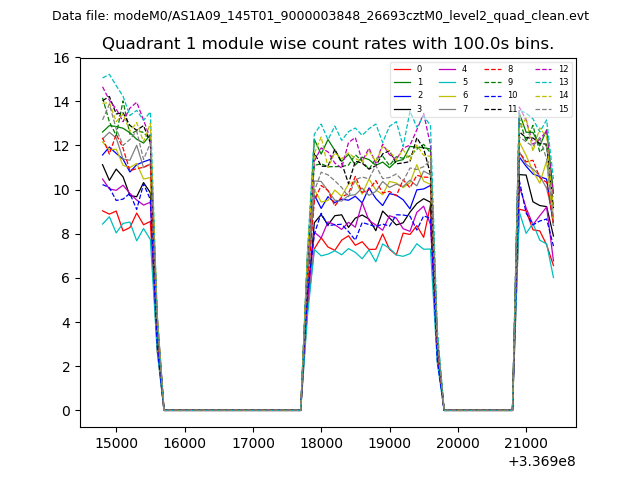
| Module-wise count rates for Quadrant A Data is divided into 100 sec bins |
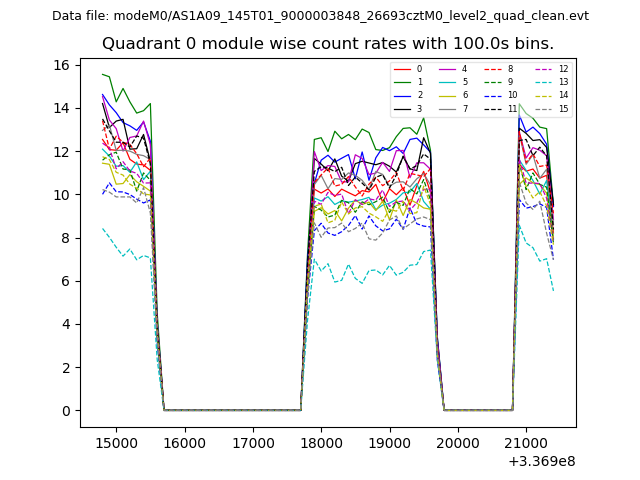 |
 |
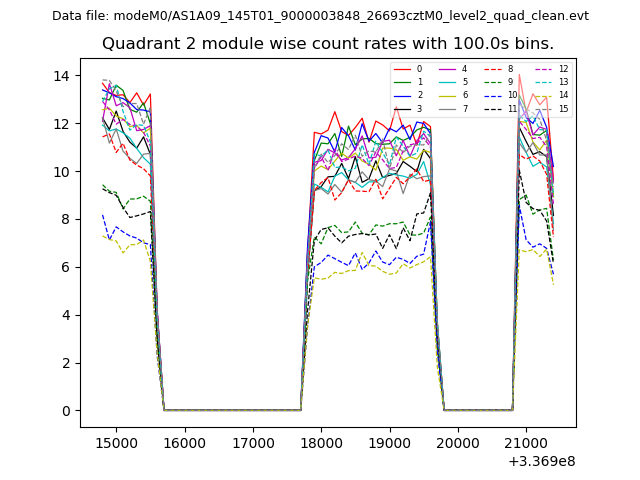
| Module-wise count rates for Quadrant B Data is divided into 100 sec bins |
 |
 |
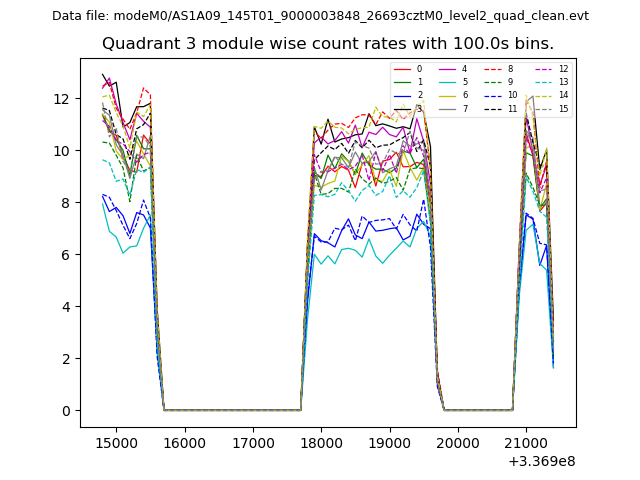
| Module-wise count rates for Quadrant C Data is divided into 100 sec bins |
 |
 |
| Module-wise count rates for Quadrant D Data is divided into 100 sec bins |
 |
 |
| Parameter | Plot |
|---|---|
| CZT HV Monitor | 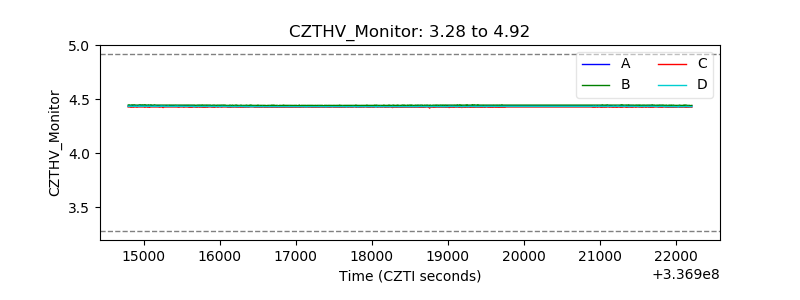 |
| D_VDD | 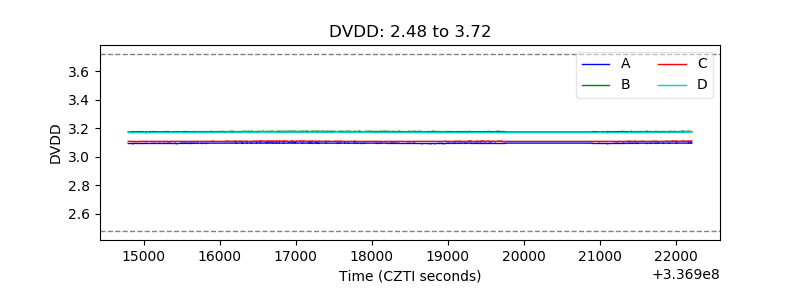 |
| Temperature 1 | 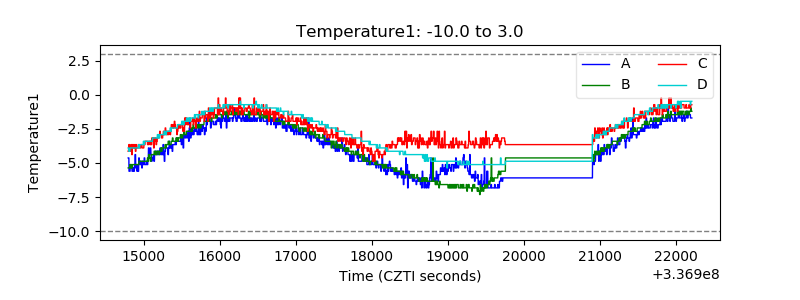 |
| Veto HV Monitor | 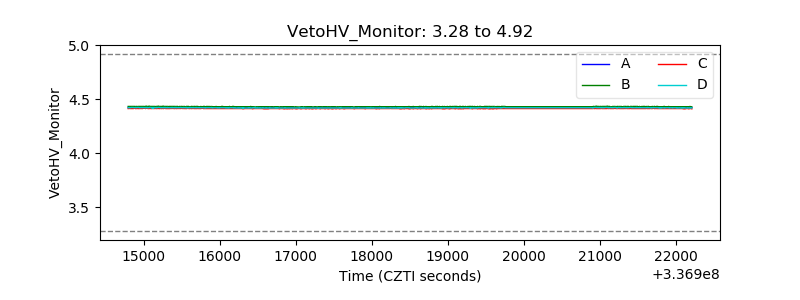 |
| Veto LLD | 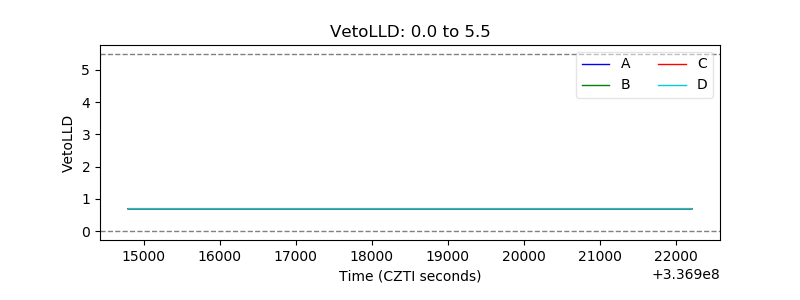 |
| Alpha Counter | 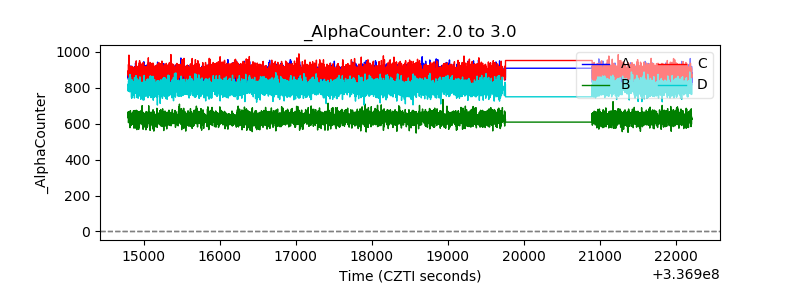 |
| _CPM_Rate | 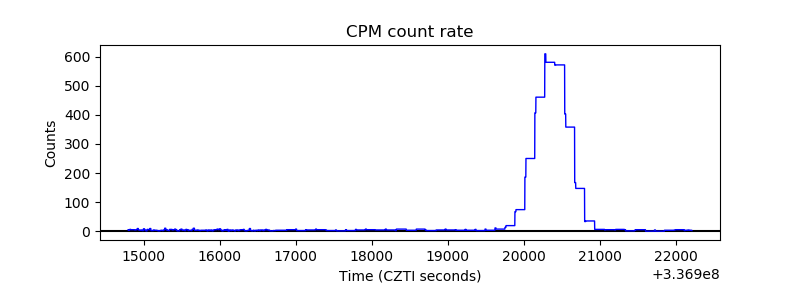 |
| CZT Counter | 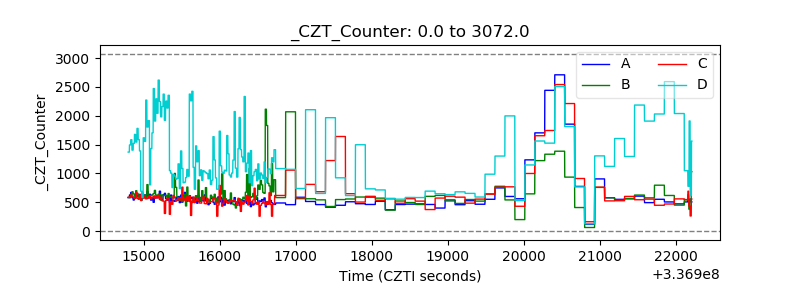 |
| +2.5 Volts monitor | 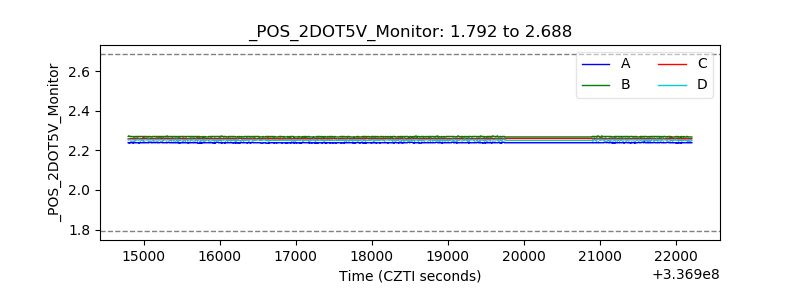 |
| +5 Volts monitor | 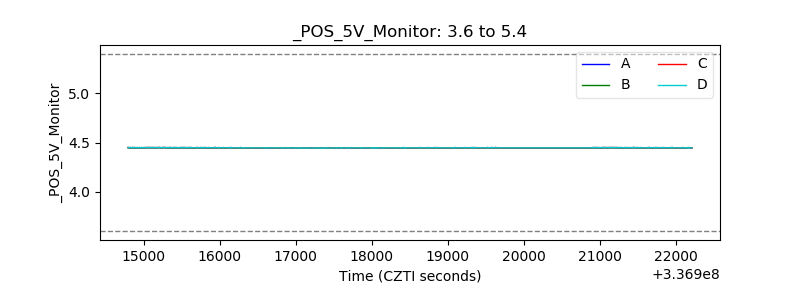 |
| _ROLL_ROT | 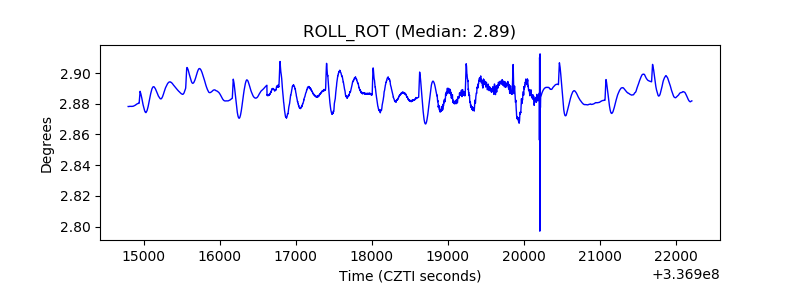 |
| _Roll_DEC | 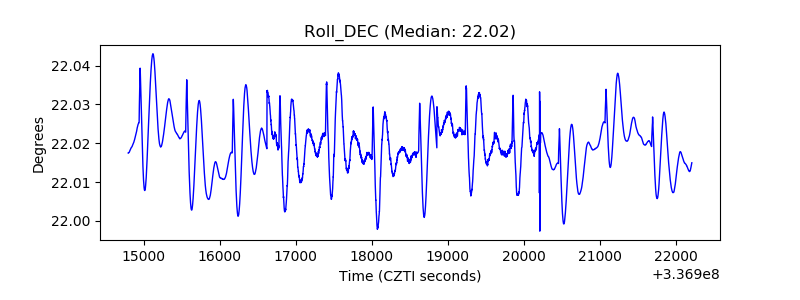 |
| _Roll_RA | 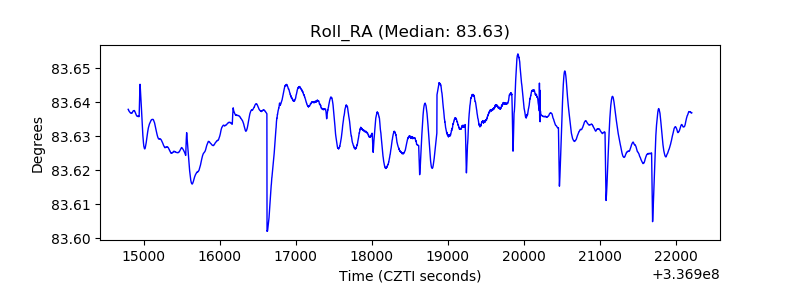 |
| Veto Counter | 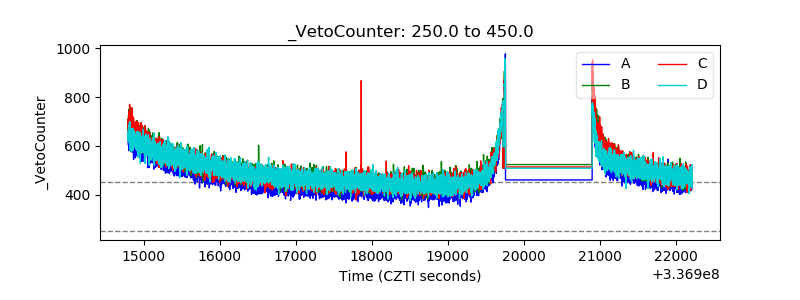 |