| Param | Original file | Final file |
|---|---|---|
| Filename | modeM0/AS1A09_145T01_9000003848_26694cztM0_level2.evt | modeM0/AS1A09_145T01_9000003848_26694cztM0_level2_quad_clean.evt |
| Size (bytes) | 594,512,640 | 76,939,200 |
| Size | 567.0 MB | 73.4 MB |
| Events in quadrant A | 3,535,043 | 479,643 |
| Events in quadrant B | 3,728,733 | 484,602 |
| Events in quadrant C | 3,538,048 | 461,878 |
| Events in quadrant D | 6,750,779 | 438,330 |
| Mode M0 | |||
|---|---|---|---|
| Quadrant | BADHDUFLAG | Total packets | Discarded packets |
| A | 0 | 14246 | 0 |
| B | 0 | 14927 | 0 |
| C | 0 | 14260 | 0 |
| D | 0 | 24377 | 0 |
| Mode M9 | |||
|---|---|---|---|
| Quadrant | BADHDUFLAG | Total packets | Discarded packets |
| A | 0 | 9 | 0 |
| B | 0 | 9 | 0 |
| C | 0 | 9 | 0 |
| D | 0 | 9 | 0 |
| Quadrant | Total seconds | Saturated seconds | Saturation percentage |
|---|---|---|---|
| A | 6671 | 67 | 1.004347% |
| B | 6672 | 111 | 1.663669% |
| C | 6672 | 89 | 1.333933% |
| D | 6672 | 1312 | 19.664269% |
Noise dominated data is calculated using 1-second bins in cleaned event files. If a bin has >2000 counts, and if more than 50% of those come from <1% of pixels, then it is considered to be noise-dominated and hence unusable.
| Quadrant | # 1 sec bins | Bins with >0 counts | Bins with >2000 counts | High rate bins dominated by noise | Noise dominated (total time) | Noise dominated (detector-on time) | Marked lightcurve |
|---|---|---|---|---|---|---|---|
| A | 7601 | 6672 | 18 | 18 | 0.24% | 0.27% | 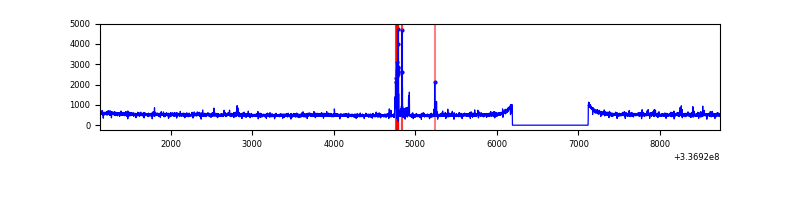 |
| B | 7602 | 6673 | 17 | 17 | 0.22% | 0.25% | 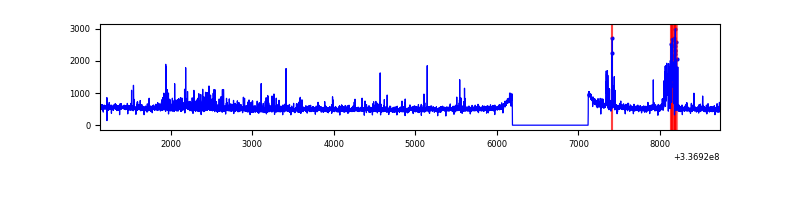 |
| C | 7602 | 6673 | 0 | 0 | 0.00% | 0.00% | 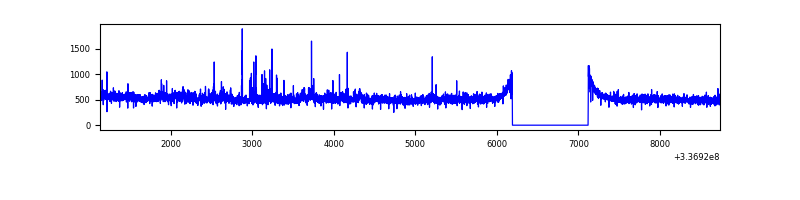 |
| D | 7602 | 6673 | 886 | 886 | 11.65% | 13.28% | 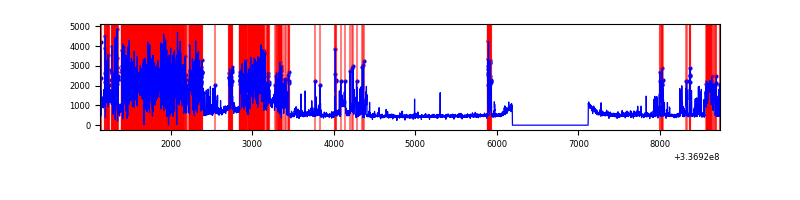 |
Top three noisy pixels from each quadrant. If the there are fewer than three noisy pixels in the level2.evt file, extra rows are filled as -1
| Pixel properties | Quadrant properties | ||||||
|---|---|---|---|---|---|---|---|
| Quadrant | DetID | PixID | Counts | Sigma | Mean | Median | Sigma |
| A | 0 | 13 | 153192 | 862.52 | 876 | 861 | 176.6 |
| A | 13 | 254 | 11543 | 60.48 | 876 | 861 | 176.6 |
| A | 3 | 137 | 7860 | 39.63 | 876 | 861 | 176.6 |
| B | 15 | 33 | 123460 | 748.89 | 863 | 842 | 163.7 |
| B | 0 | 189 | 114453 | 693.88 | 863 | 842 | 163.7 |
| B | 10 | 251 | 43902 | 262.99 | 863 | 842 | 163.7 |
| C | 14 | 238 | 136009 | 692.81 | 832 | 840 | 195.1 |
| C | 3 | 233 | 90544 | 459.78 | 832 | 840 | 195.1 |
| C | 6 | 80 | 32297 | 161.23 | 832 | 840 | 195.1 |
| D | 7 | 80 | 2313896 | 11937.3 | 783 | 762 | 193.8 |
| D | 1 | 52 | 1392394 | 7181.74 | 783 | 762 | 193.8 |
| D | 2 | 250 | 42513 | 215.46 | 783 | 762 | 193.8 |
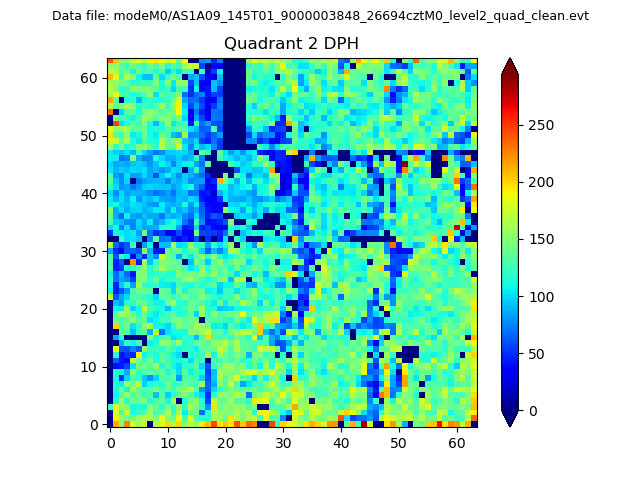
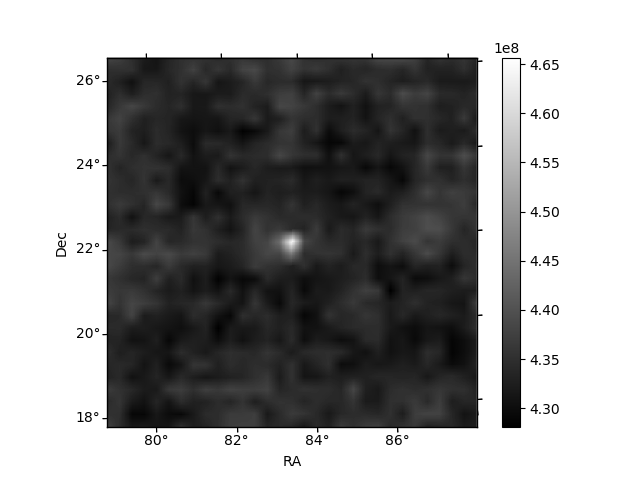
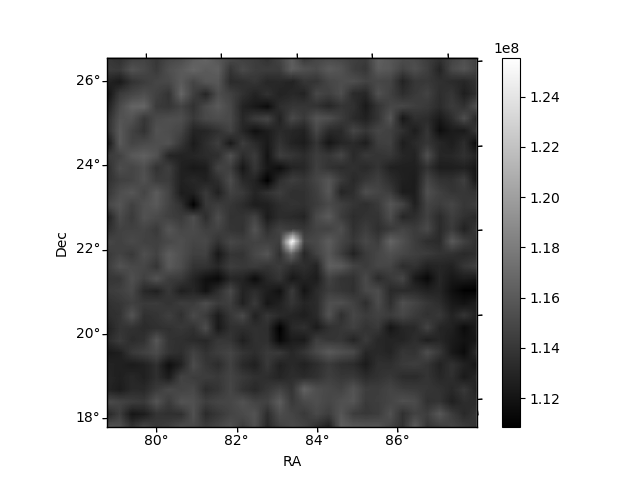
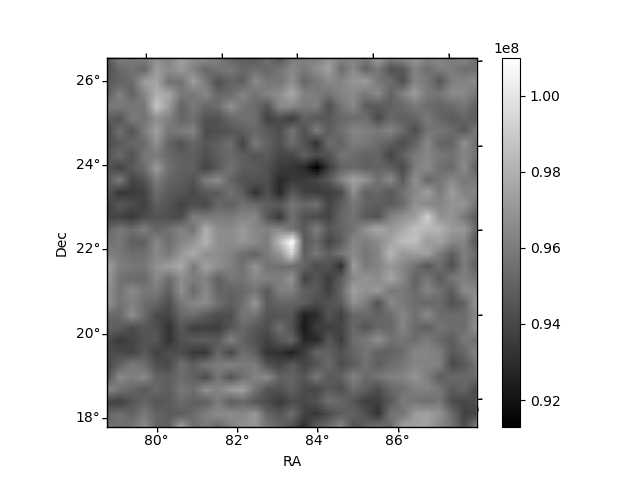
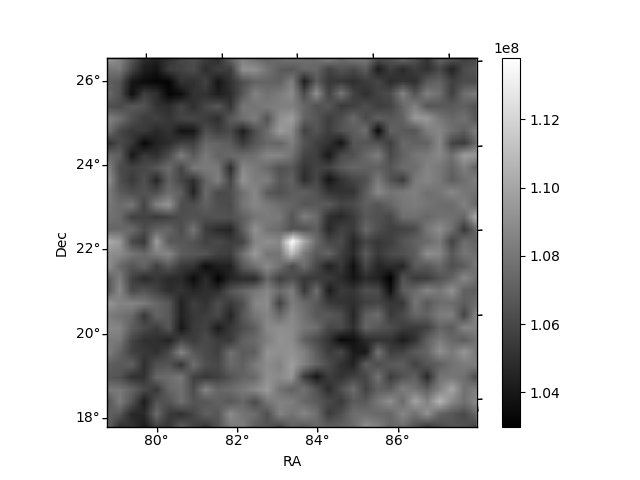
Histogram calculated using DETX and DETY for each event in the final _common_clean file
| Quadrant A | 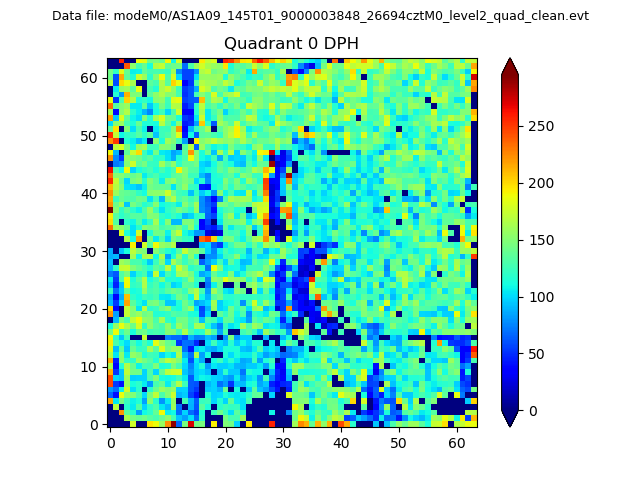 |
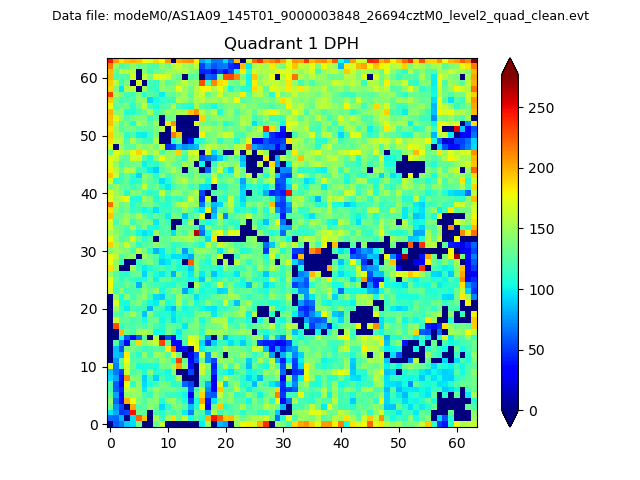 |
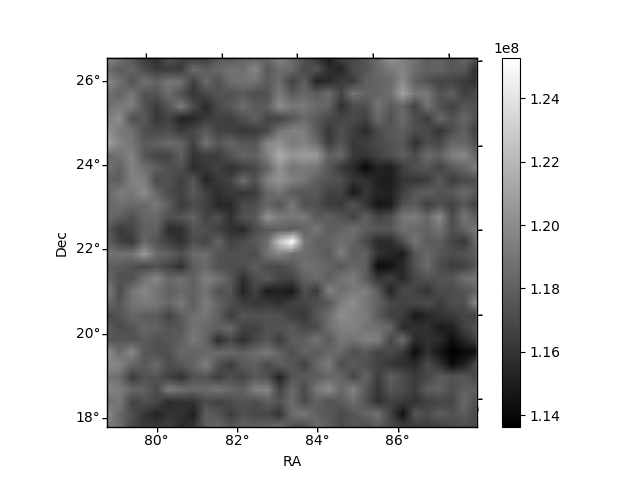
Quadrant B |
|---|---|---|---|
| Quadrant D | 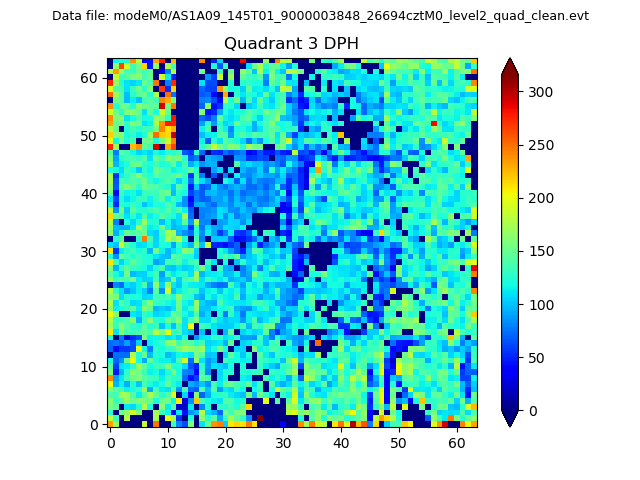 |
 |
Quadrant C |
| Plot type | Count rate plots | Images |
|---|---|---|
| Comparison with Poisson distribution Blue bars denote a histogram of data divided into 1 sec bins. Red curve is a Poisson curve with rate = median count rate of data. |
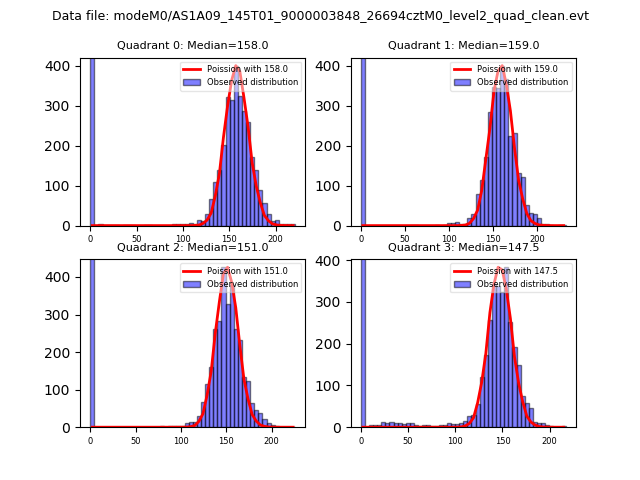 |
 |
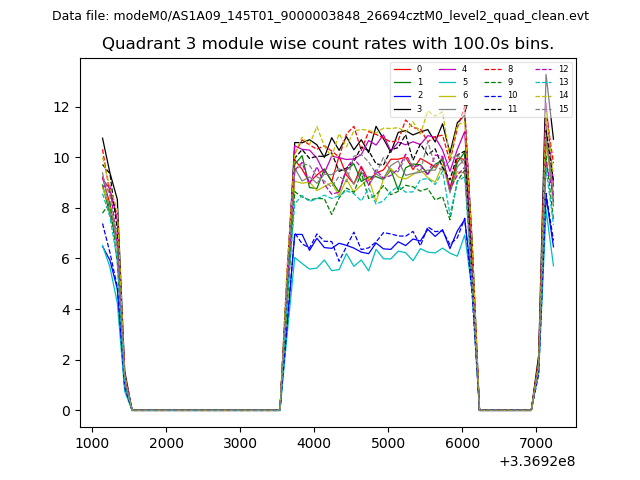
| Quadrant-wise count rates Data is divided into 100 sec bins |
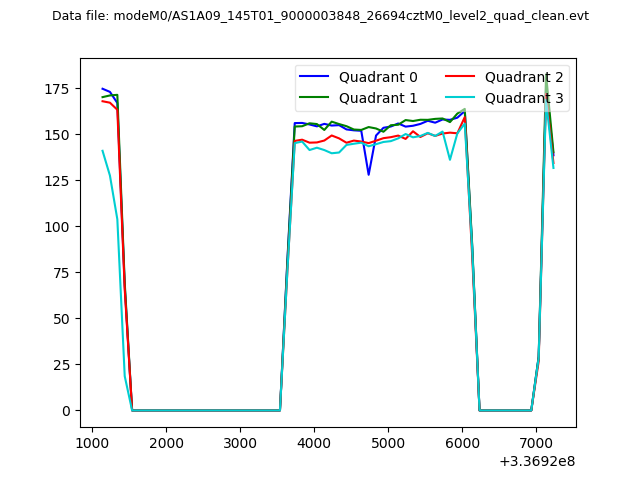 |
|
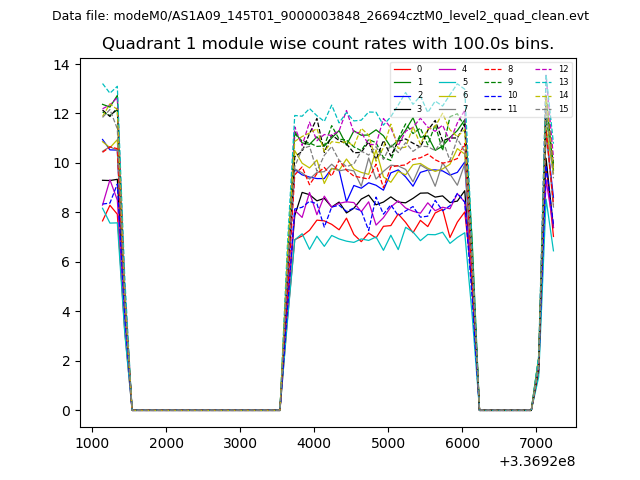
| Module-wise count rates for Quadrant A Data is divided into 100 sec bins |
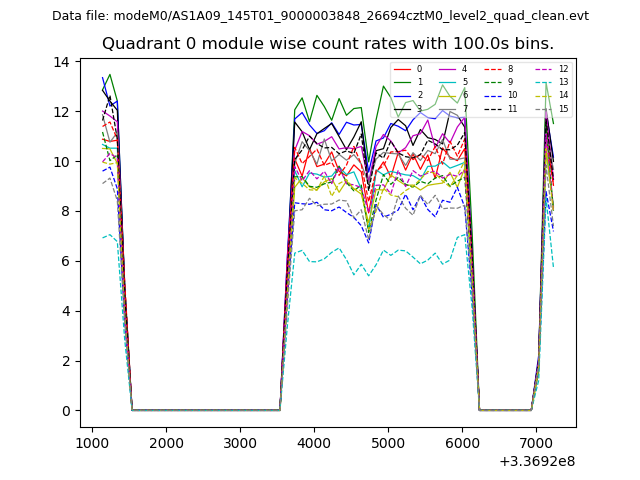 |
 |
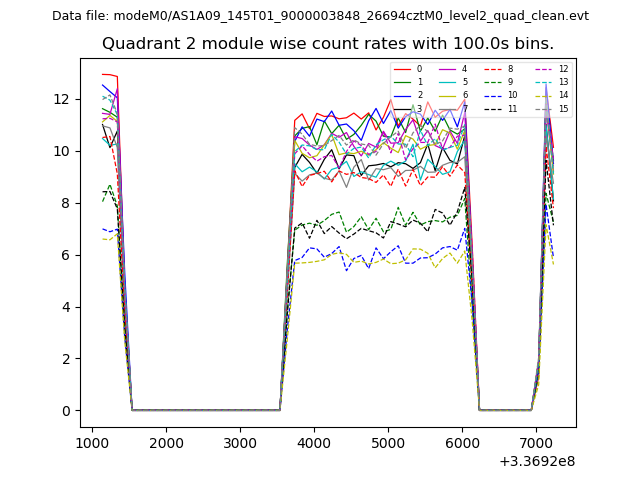
| Module-wise count rates for Quadrant B Data is divided into 100 sec bins |
 |
 |
| Module-wise count rates for Quadrant C Data is divided into 100 sec bins |
 |
 |
| Module-wise count rates for Quadrant D Data is divided into 100 sec bins |
 |
 |
| Parameter | Plot |
|---|---|
| CZT HV Monitor | 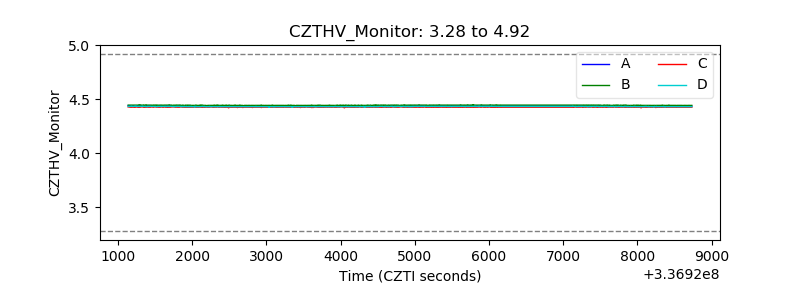 |
| D_VDD | 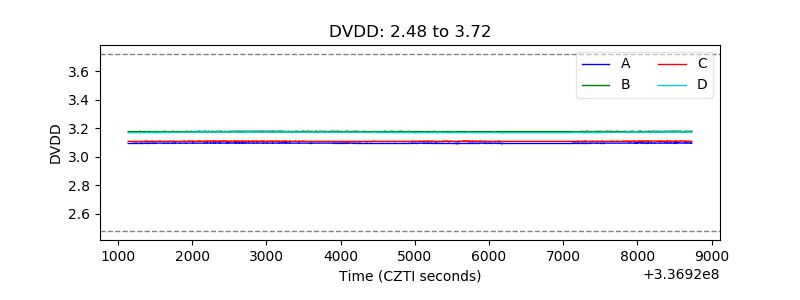 |
| Temperature 1 | 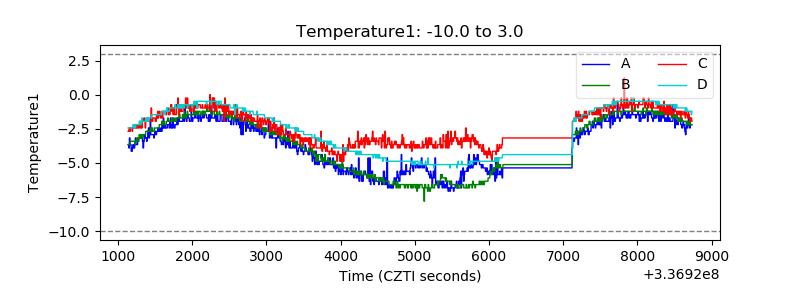 |
| Veto HV Monitor | 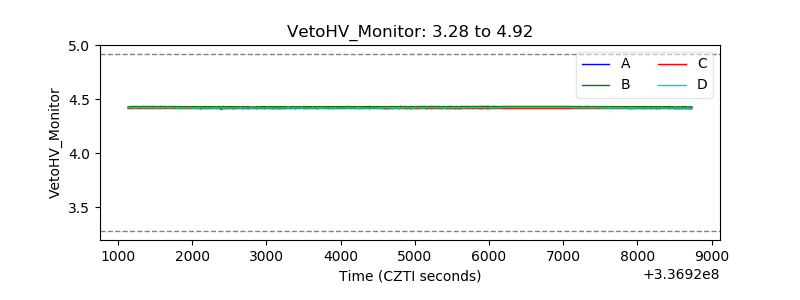 |
| Veto LLD | 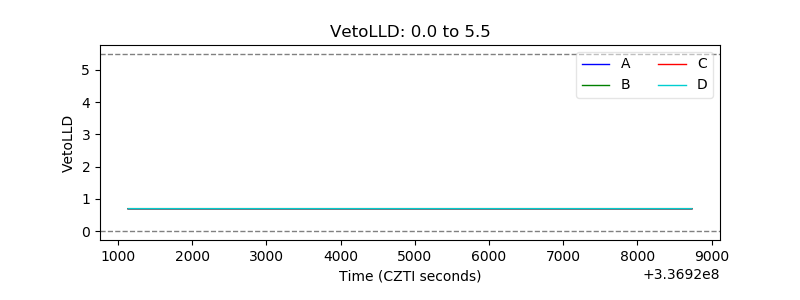 |
| Alpha Counter | 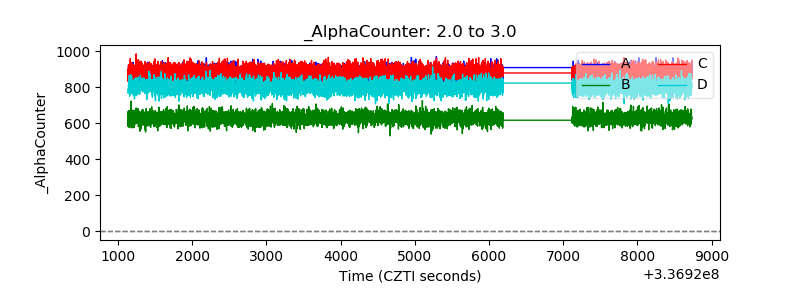 |
| _CPM_Rate | 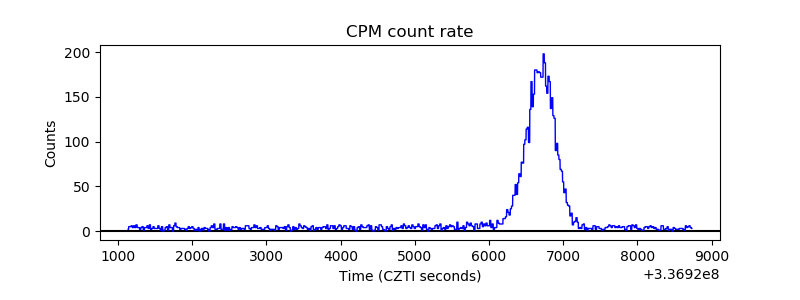 |
| CZT Counter | 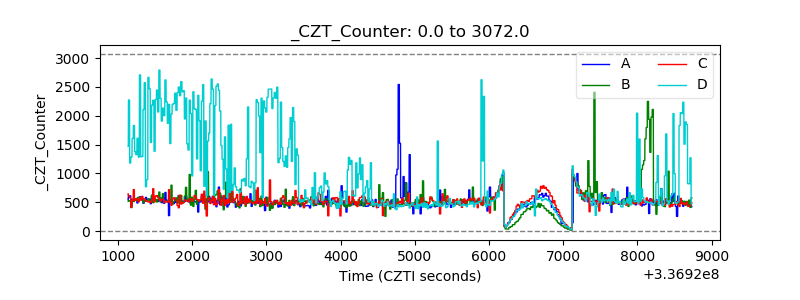 |
| +2.5 Volts monitor | 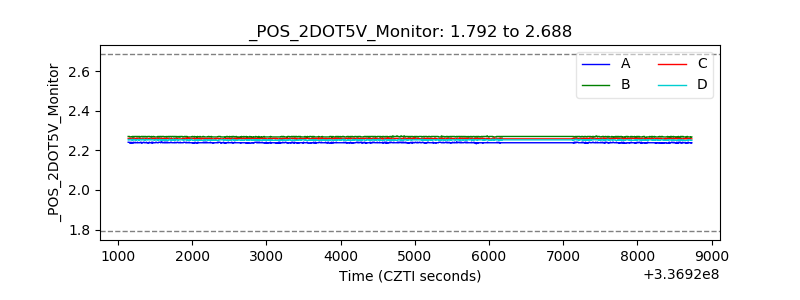 |
| +5 Volts monitor |  |
| _ROLL_ROT |  |
| _Roll_DEC | 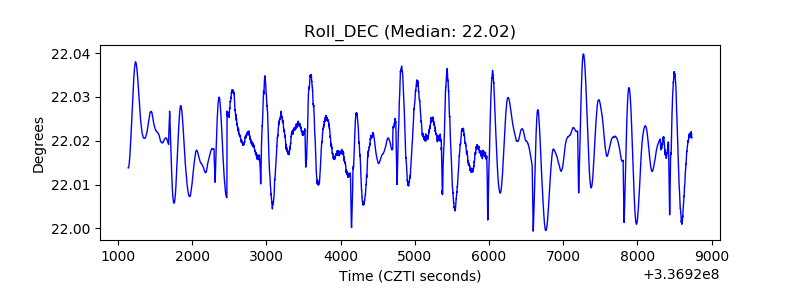 |
| _Roll_RA | 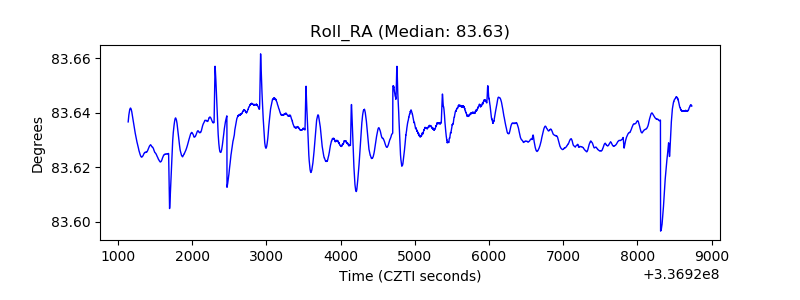 |
| Veto Counter | 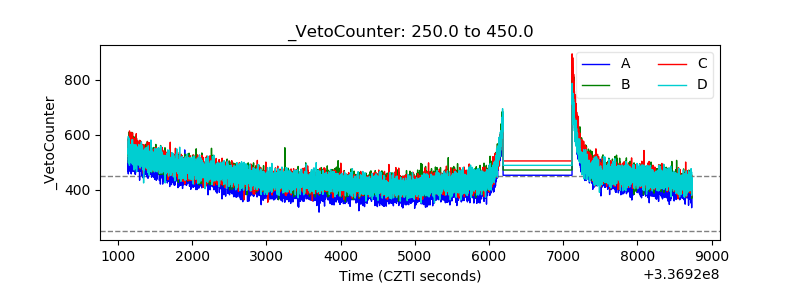 |