| Param | Original file | Final file |
|---|---|---|
| Filename | modeM0/AS1A09_145T01_9000003848_26696cztM0_level2.evt | modeM0/AS1A09_145T01_9000003848_26696cztM0_level2_quad_clean.evt |
| Size (bytes) | 1,051,911,360 | 159,770,880 |
| Size | 1003.2 MB | 152.4 MB |
| Events in quadrant A | 6,423,254 | 1,030,535 |
| Events in quadrant B | 6,740,720 | 1,032,425 |
| Events in quadrant C | 6,342,316 | 990,726 |
| Events in quadrant D | 11,502,720 | 917,141 |
| Mode M0 | |||
|---|---|---|---|
| Quadrant | BADHDUFLAG | Total packets | Discarded packets |
| A | 0 | 26559 | 0 |
| B | 0 | 27370 | 0 |
| C | 0 | 26180 | 0 |
| D | 0 | 42235 | 0 |
| Mode M9 | |||
|---|---|---|---|
| Quadrant | BADHDUFLAG | Total packets | Discarded packets |
| A | 0 | 8 | 0 |
| B | 0 | 8 | 0 |
| C | 0 | 8 | 0 |
| D | 0 | 8 | 0 |
| Quadrant | Total seconds | Saturated seconds | Saturation percentage |
|---|---|---|---|
| A | 12556 | 217 | 1.728257% |
| B | 12557 | 313 | 2.492634% |
| C | 12557 | 308 | 2.452815% |
| D | 12557 | 1712 | 13.633830% |
Noise dominated data is calculated using 1-second bins in cleaned event files. If a bin has >2000 counts, and if more than 50% of those come from <1% of pixels, then it is considered to be noise-dominated and hence unusable.
| Quadrant | # 1 sec bins | Bins with >0 counts | Bins with >2000 counts | High rate bins dominated by noise | Noise dominated (total time) | Noise dominated (detector-on time) | Marked lightcurve |
|---|---|---|---|---|---|---|---|
| A | 13326 | 12558 | 2 | 2 | 0.02% | 0.02% | 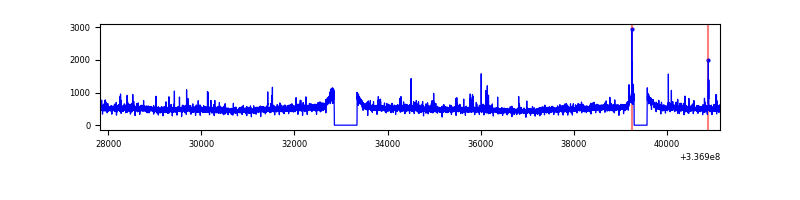 |
| B | 13327 | 12559 | 34 | 34 | 0.26% | 0.27% | 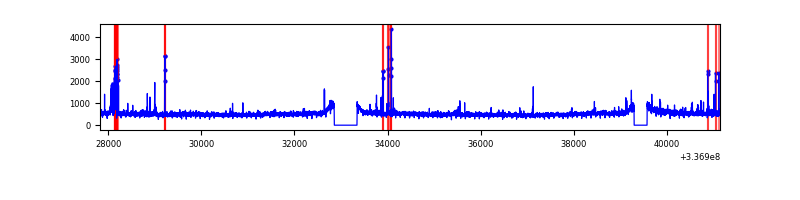 |
| C | 13327 | 12559 | 2 | 2 | 0.02% | 0.02% | 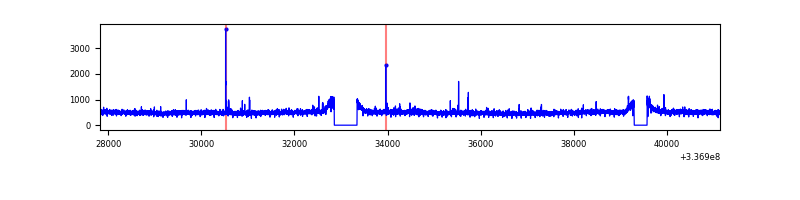 |
| D | 13327 | 12558 | 1164 | 1164 | 8.73% | 9.27% | 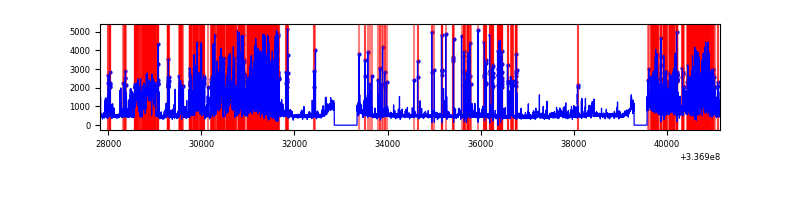 |
Top three noisy pixels from each quadrant. If the there are fewer than three noisy pixels in the level2.evt file, extra rows are filled as -1
| Pixel properties | Quadrant properties | ||||||
|---|---|---|---|---|---|---|---|
| Quadrant | DetID | PixID | Counts | Sigma | Mean | Median | Sigma |
| A | 0 | 13 | 195729 | 598.6 | 1611 | 1579 | 324.3 |
| A | 13 | 254 | 21149 | 60.34 | 1611 | 1579 | 324.3 |
| A | 3 | 137 | 14596 | 40.13 | 1611 | 1579 | 324.3 |
| B | 5 | 172 | 139747 | 452.02 | 1595 | 1559 | 305.7 |
| B | 0 | 189 | 135799 | 439.11 | 1595 | 1559 | 305.7 |
| B | 15 | 33 | 124897 | 403.45 | 1595 | 1559 | 305.7 |
| C | 14 | 238 | 244549 | 672.4 | 1539 | 1552 | 361.4 |
| C | 3 | 233 | 51980 | 139.54 | 1539 | 1552 | 361.4 |
| C | 2 | 16 | 28485 | 74.53 | 1539 | 1552 | 361.4 |
| D | 7 | 80 | 2842276 | 7741.92 | 1494 | 1454 | 366.9 |
| D | 1 | 52 | 2163087 | 5890.97 | 1494 | 1454 | 366.9 |
| D | 2 | 250 | 630768 | 1715.03 | 1494 | 1454 | 366.9 |
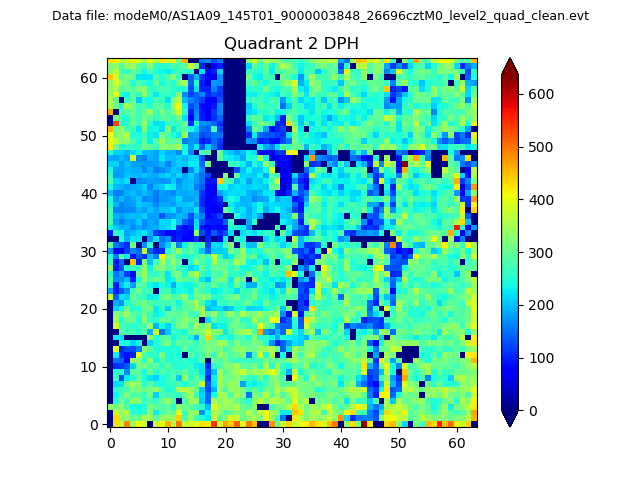
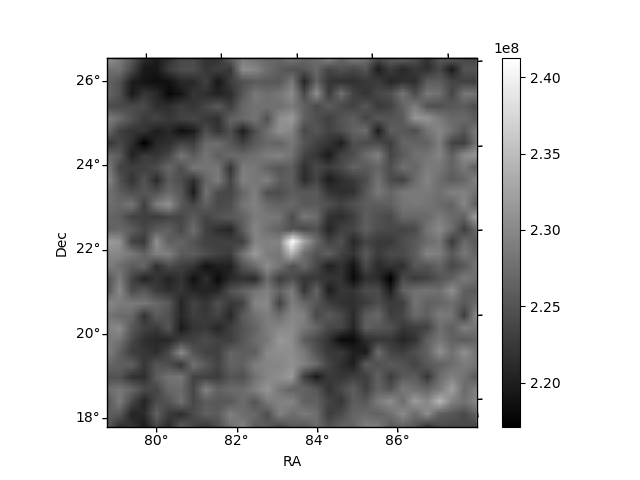
Histogram calculated using DETX and DETY for each event in the final _common_clean file
| Quadrant A | 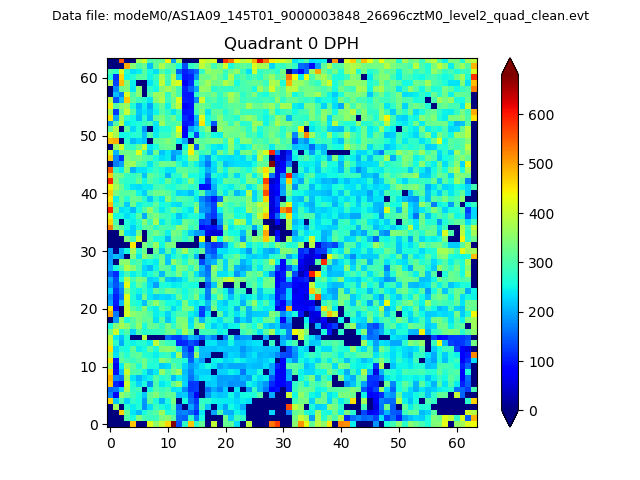 |
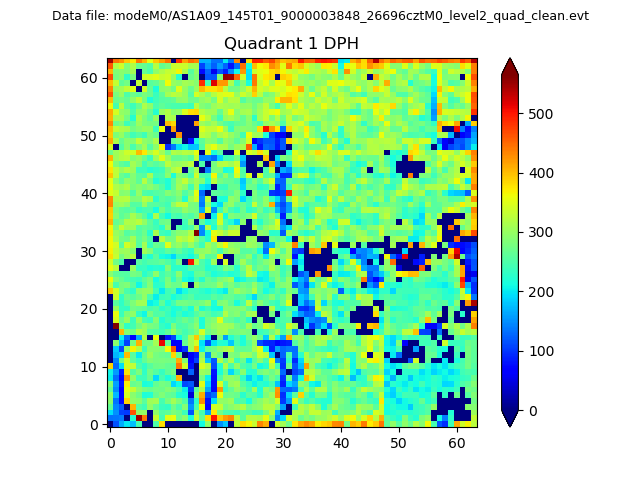 |
Quadrant B |
|---|---|---|---|
| Quadrant D | 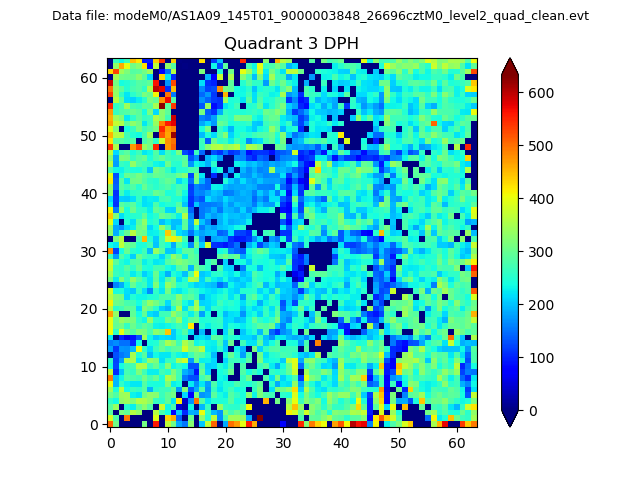 |
 |
Quadrant C |
| Plot type | Count rate plots | Images |
|---|---|---|
| Comparison with Poisson distribution Blue bars denote a histogram of data divided into 1 sec bins. Red curve is a Poisson curve with rate = median count rate of data. |
 |
 |
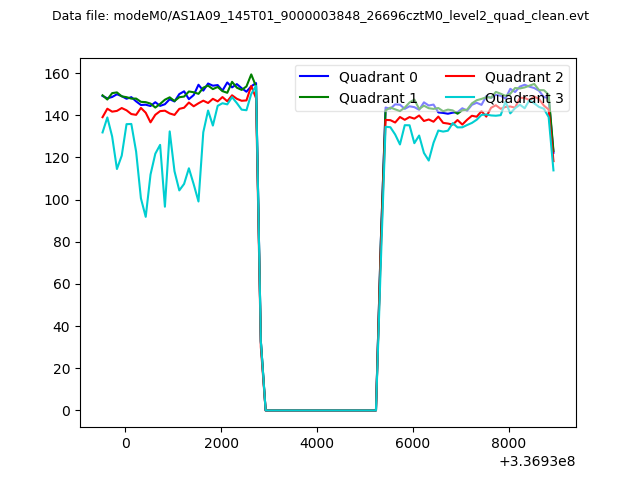
| Quadrant-wise count rates Data is divided into 100 sec bins |
 |
|
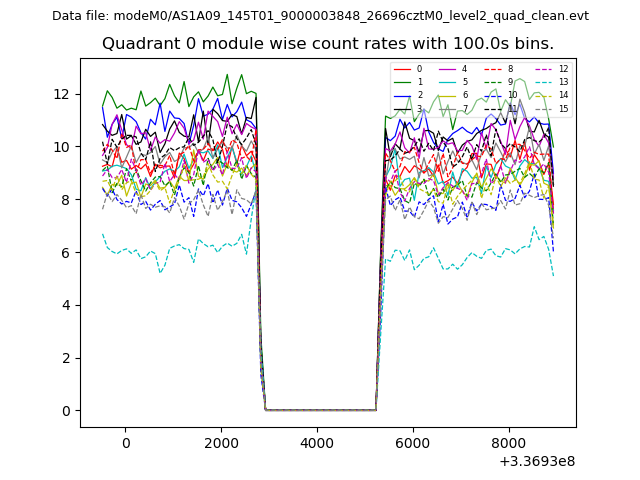
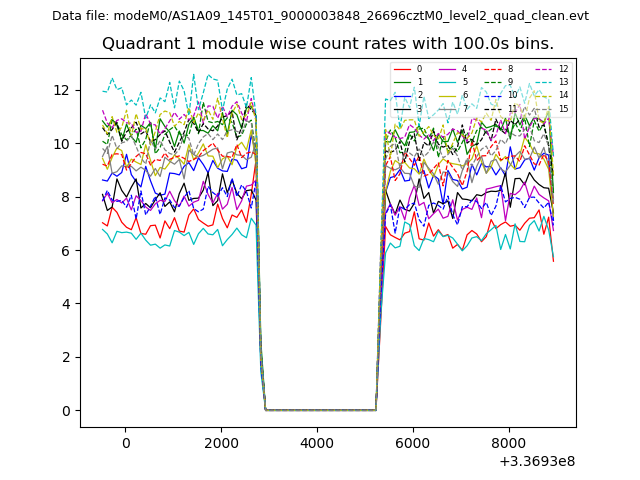
| Module-wise count rates for Quadrant A Data is divided into 100 sec bins |
 |
 |
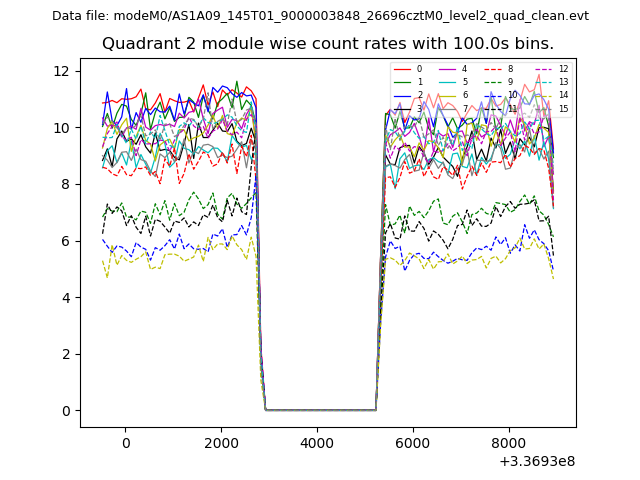
| Module-wise count rates for Quadrant B Data is divided into 100 sec bins |
 |
 |
| Module-wise count rates for Quadrant C Data is divided into 100 sec bins |
 |
 |
| Module-wise count rates for Quadrant D Data is divided into 100 sec bins |
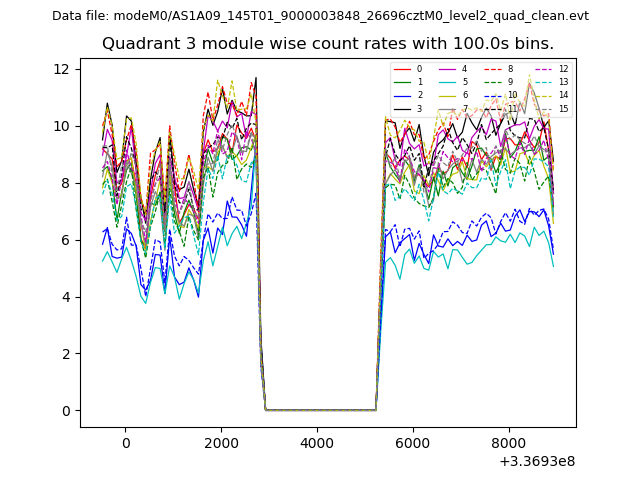 |
 |
| Parameter | Plot |
|---|---|
| CZT HV Monitor | 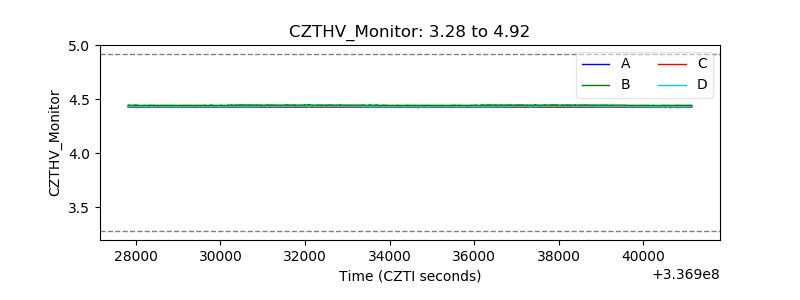 |
| D_VDD | 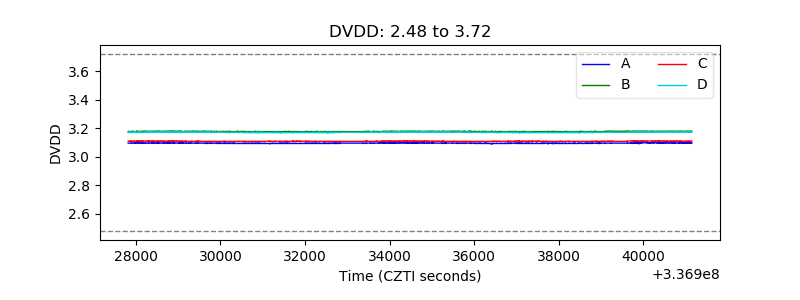 |
| Temperature 1 | 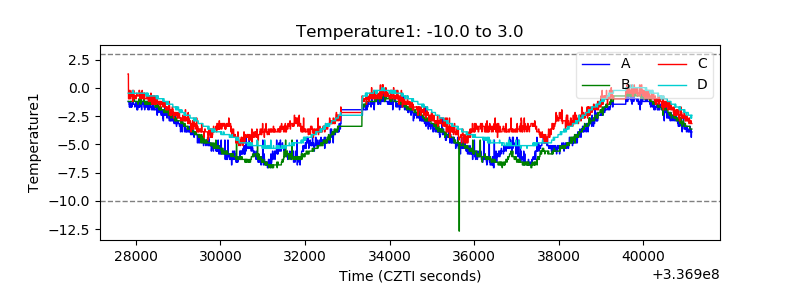 |
| Veto HV Monitor | 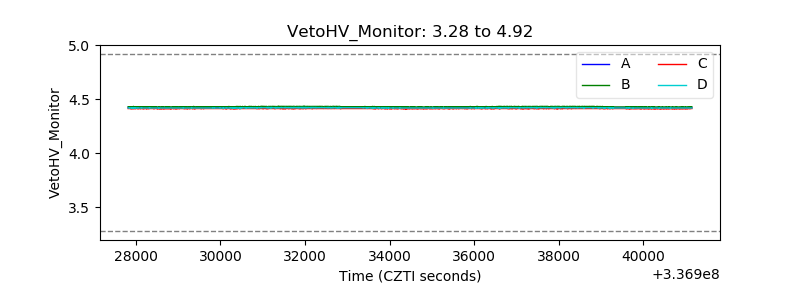 |
| Veto LLD | 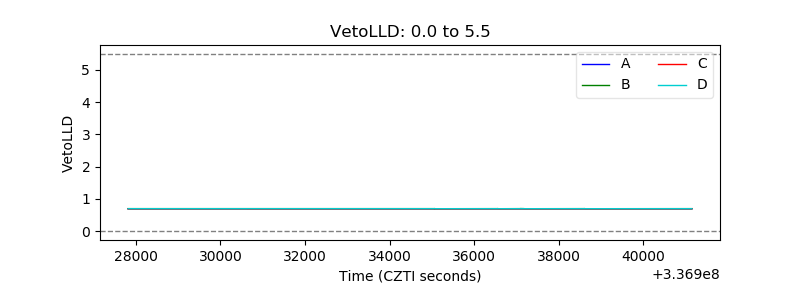 |
| Alpha Counter | 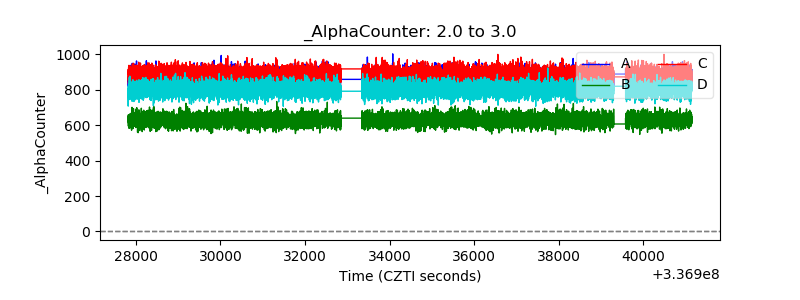 |
| _CPM_Rate |  |
| CZT Counter | 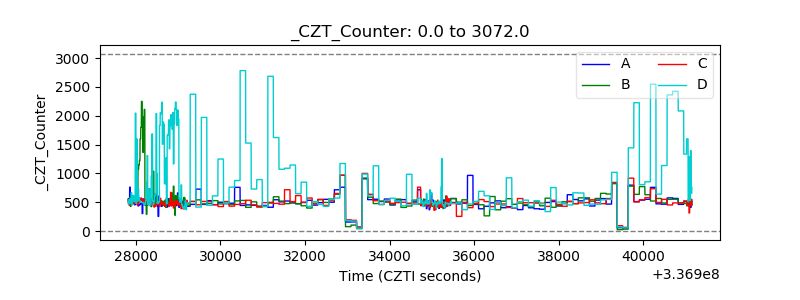 |
| +2.5 Volts monitor |  |
| +5 Volts monitor |  |
| _ROLL_ROT |  |
| _Roll_DEC | 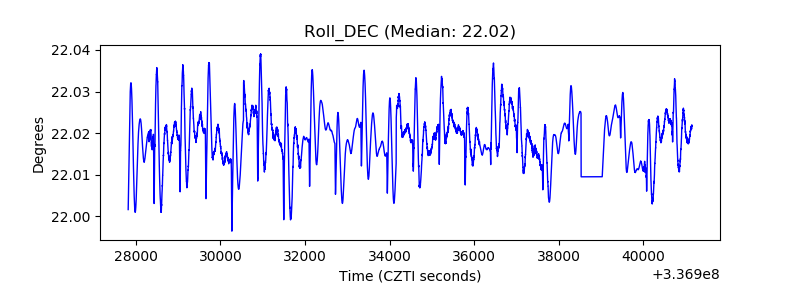 |
| _Roll_RA | 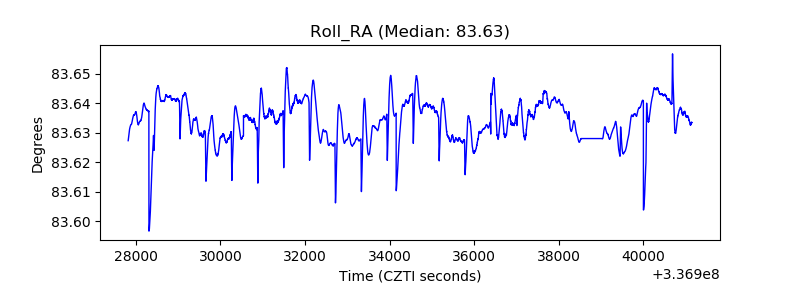 |
| Veto Counter | 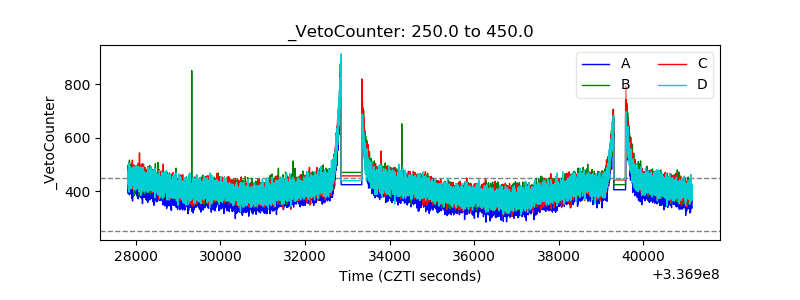 |