| Param | Original file | Final file |
|---|---|---|
| Filename | modeM0/AS1A09_145T01_9000003848_26697cztM0_level2.evt | modeM0/AS1A09_145T01_9000003848_26697cztM0_level2_quad_clean.evt |
| Size (bytes) | 850,654,080 | 88,637,760 |
| Size | 811.2 MB | 84.5 MB |
| Events in quadrant A | 4,020,859 | 584,459 |
| Events in quadrant B | 8,238,754 | 494,638 |
| Events in quadrant C | 4,905,591 | 559,650 |
| Events in quadrant D | 8,067,619 | 500,608 |
| Mode M0 | |||
|---|---|---|---|
| Quadrant | BADHDUFLAG | Total packets | Discarded packets |
| A | 0 | 16661 | 0 |
| B | 0 | 29550 | 0 |
| C | 0 | 19421 | 0 |
| D | 0 | 29327 | 0 |
| Mode M9 | |||
|---|---|---|---|
| Quadrant | BADHDUFLAG | Total packets | Discarded packets |
| A | 0 | 7 | 0 |
| B | 0 | 7 | 0 |
| C | 0 | 7 | 0 |
| D | 0 | 7 | 0 |
| Quadrant | Total seconds | Saturated seconds | Saturation percentage |
|---|---|---|---|
| A | 7826 | 172 | 2.197802% |
| B | 7827 | 2308 | 29.487671% |
| C | 7827 | 597 | 7.627443% |
| D | 7827 | 1608 | 20.544270% |
Noise dominated data is calculated using 1-second bins in cleaned event files. If a bin has >2000 counts, and if more than 50% of those come from <1% of pixels, then it is considered to be noise-dominated and hence unusable.
| Quadrant | # 1 sec bins | Bins with >0 counts | Bins with >2000 counts | High rate bins dominated by noise | Noise dominated (total time) | Noise dominated (detector-on time) | Marked lightcurve |
|---|---|---|---|---|---|---|---|
| A | 8451 | 7828 | 3 | 3 | 0.04% | 0.04% | 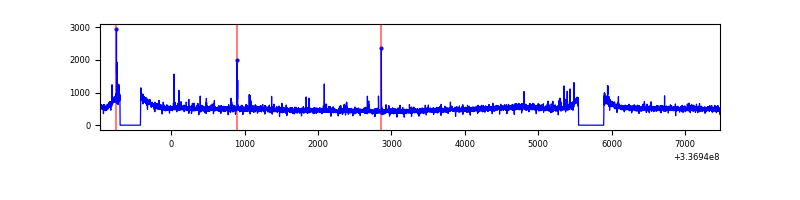 |
| B | 8452 | 7828 | 1274 | 1274 | 15.07% | 16.27% | 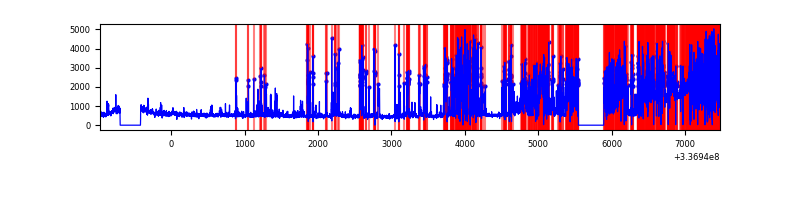 |
| C | 8452 | 7829 | 183 | 183 | 2.17% | 2.34% | 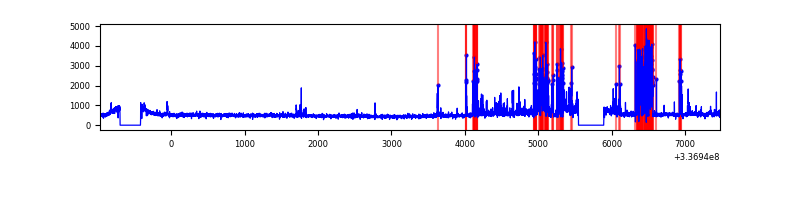 |
| D | 8452 | 7829 | 936 | 936 | 11.07% | 11.96% | 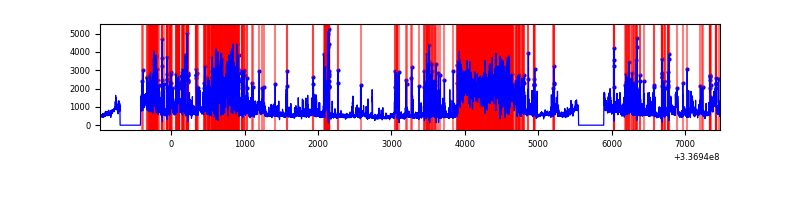 |
Top three noisy pixels from each quadrant. If the there are fewer than three noisy pixels in the level2.evt file, extra rows are filled as -1
| Pixel properties | Quadrant properties | ||||||
|---|---|---|---|---|---|---|---|
| Quadrant | DetID | PixID | Counts | Sigma | Mean | Median | Sigma |
| A | 0 | 13 | 92514 | 441.51 | 1017 | 997 | 207.3 |
| A | 13 | 254 | 14043 | 62.94 | 1017 | 997 | 207.3 |
| A | 3 | 137 | 9354 | 40.32 | 1017 | 997 | 207.3 |
| B | 0 | 189 | 4881803 | 30910.41 | 818 | 799 | 157.9 |
| B | 5 | 172 | 61050 | 381.55 | 818 | 799 | 157.9 |
| B | 3 | 112 | 36984 | 229.15 | 818 | 799 | 157.9 |
| C | 1 | 0 | 911682 | 4059.96 | 953 | 958 | 224.3 |
| C | 14 | 238 | 151397 | 670.65 | 953 | 958 | 224.3 |
| C | 3 | 233 | 69715 | 306.51 | 953 | 958 | 224.3 |
| D | 7 | 80 | 2911777 | 13024.3 | 916 | 891 | 223.5 |
| D | 1 | 52 | 924950 | 4134.56 | 916 | 891 | 223.5 |
| D | 2 | 250 | 624992 | 2792.44 | 916 | 891 | 223.5 |
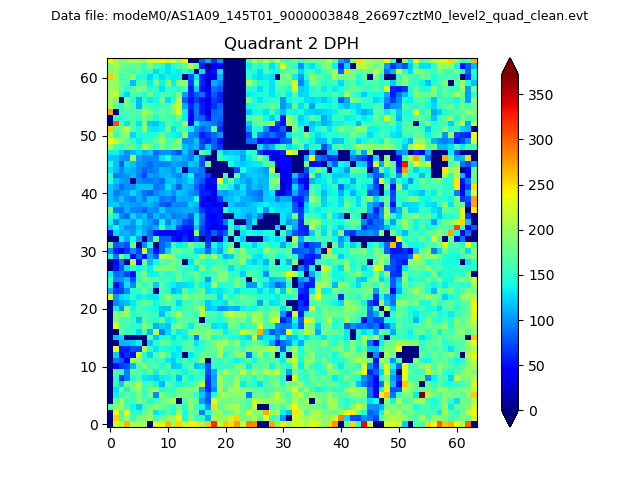
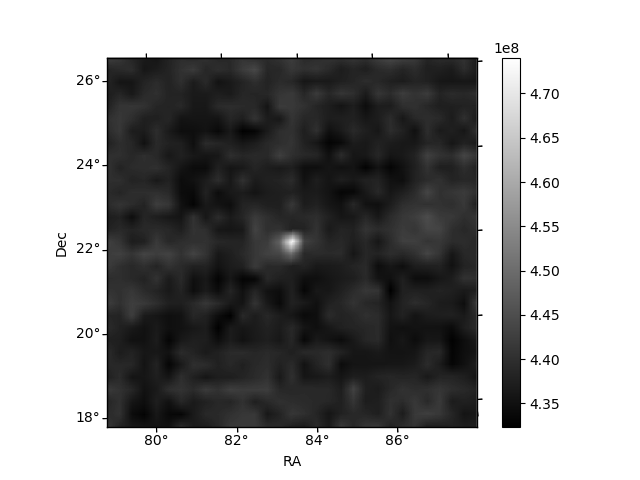
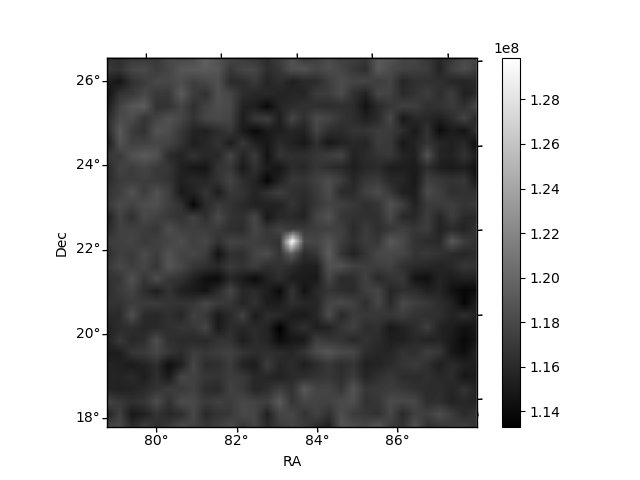
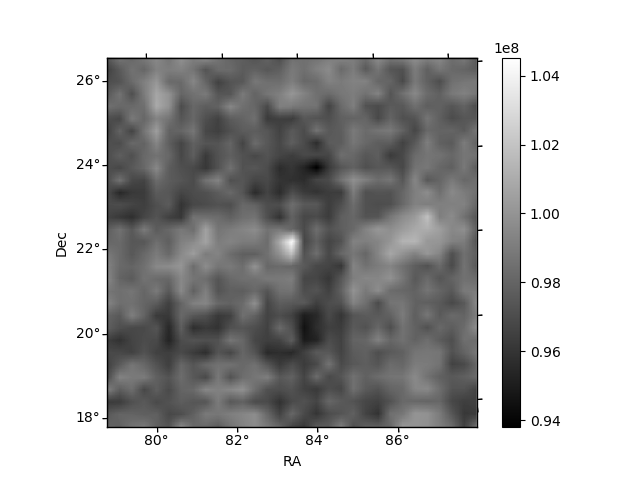
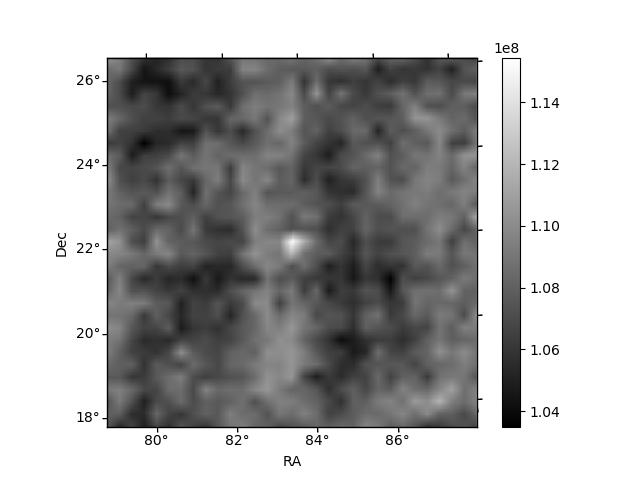
Histogram calculated using DETX and DETY for each event in the final _common_clean file
| Quadrant A | 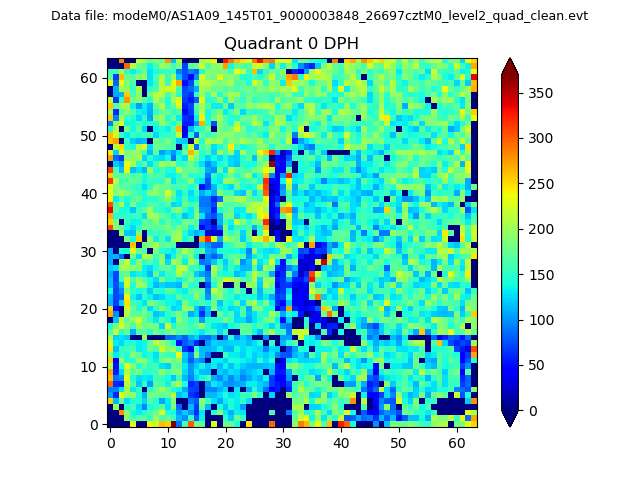 |
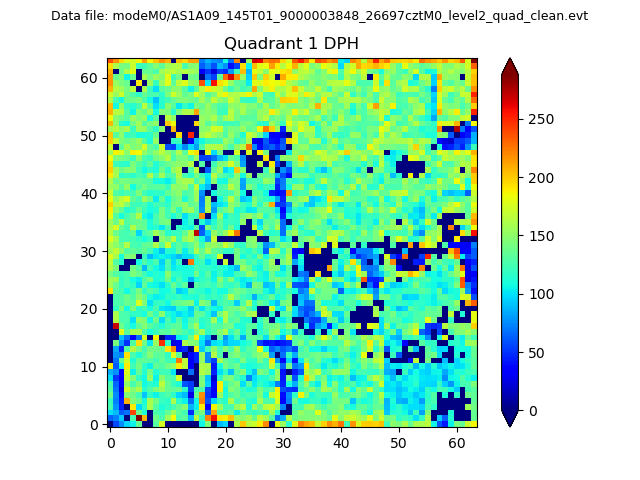 |
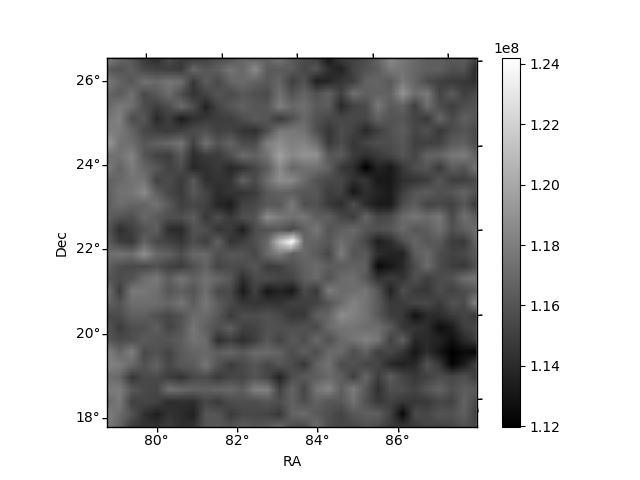
Quadrant B |
|---|---|---|---|
| Quadrant D | 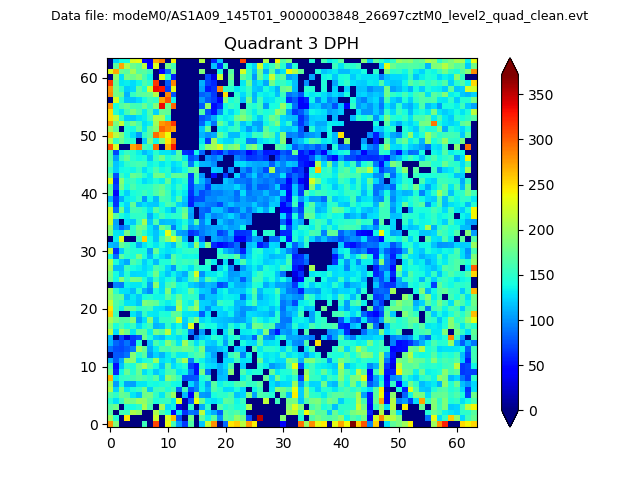 |
 |
Quadrant C |
| Plot type | Count rate plots | Images |
|---|---|---|
| Comparison with Poisson distribution Blue bars denote a histogram of data divided into 1 sec bins. Red curve is a Poisson curve with rate = median count rate of data. |
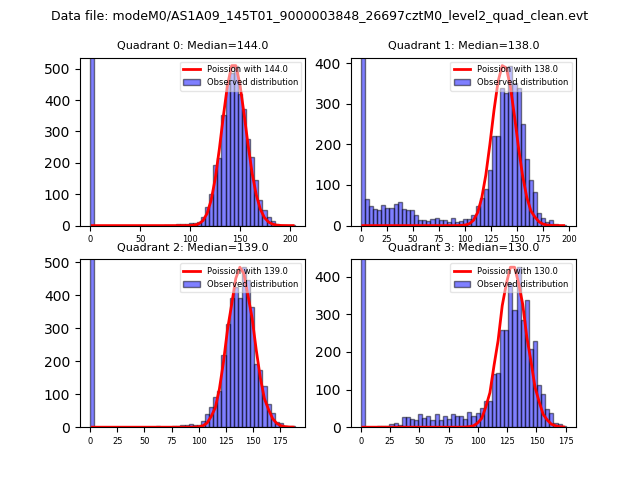 |
 |
| Quadrant-wise count rates Data is divided into 100 sec bins |
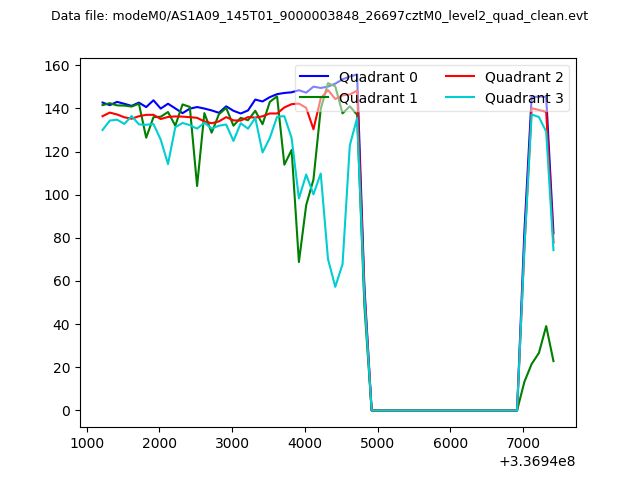 |
|
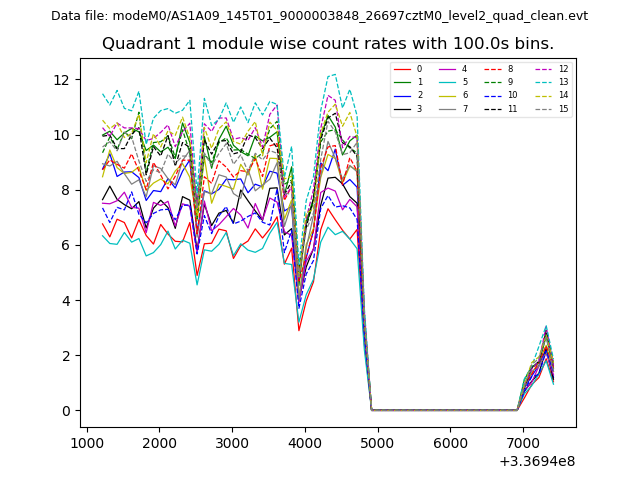
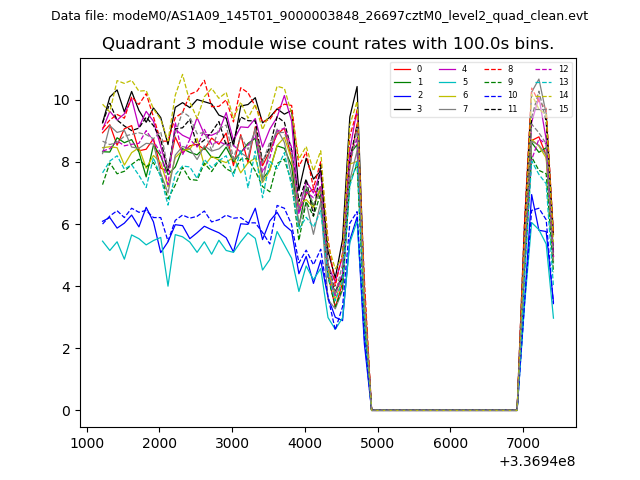
| Module-wise count rates for Quadrant A Data is divided into 100 sec bins |
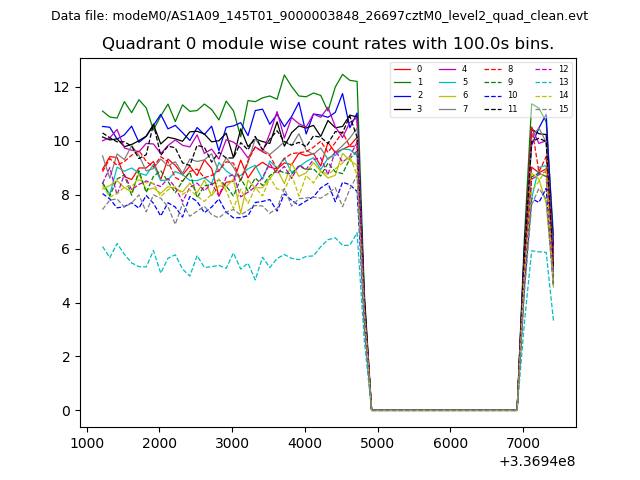 |
 |
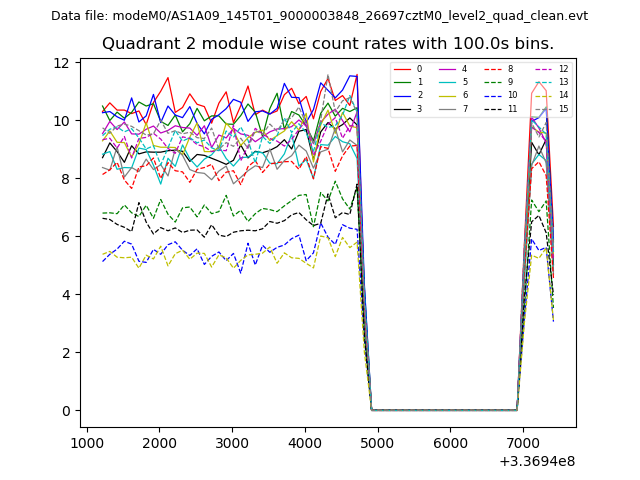
| Module-wise count rates for Quadrant B Data is divided into 100 sec bins |
 |
 |
| Module-wise count rates for Quadrant C Data is divided into 100 sec bins |
 |
 |
| Module-wise count rates for Quadrant D Data is divided into 100 sec bins |
 |
 |
| Parameter | Plot |
|---|---|
| CZT HV Monitor | 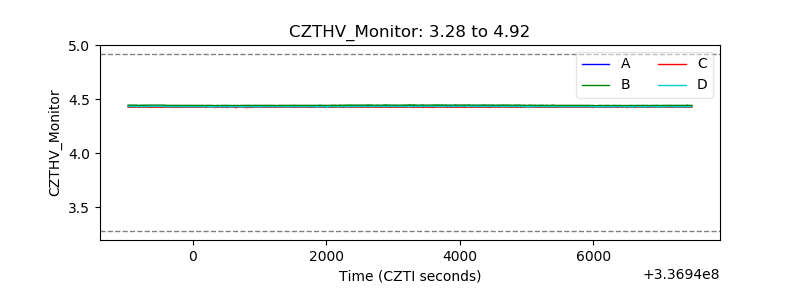 |
| D_VDD | 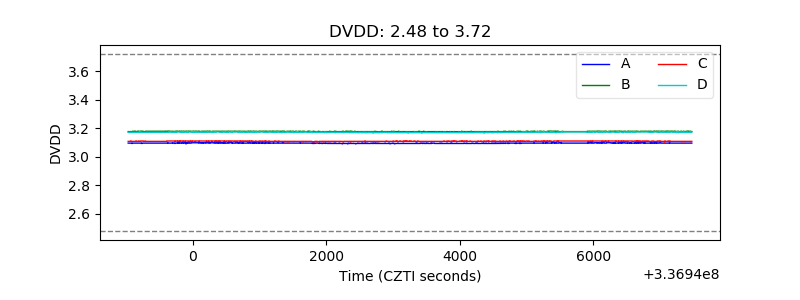 |
| Temperature 1 | 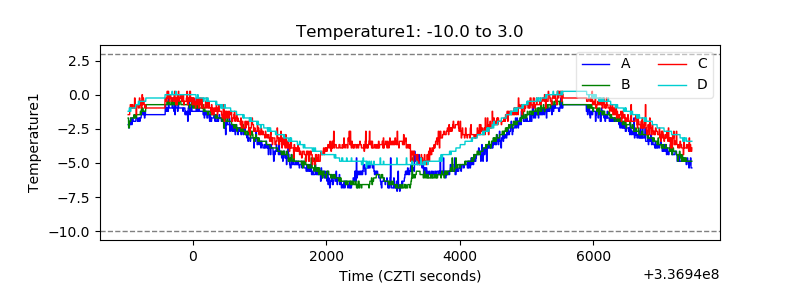 |
| Veto HV Monitor | 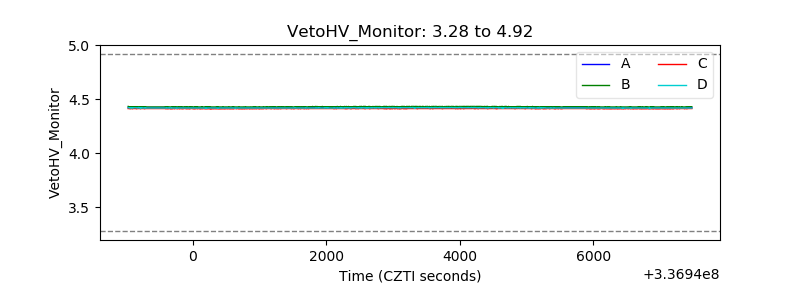 |
| Veto LLD | 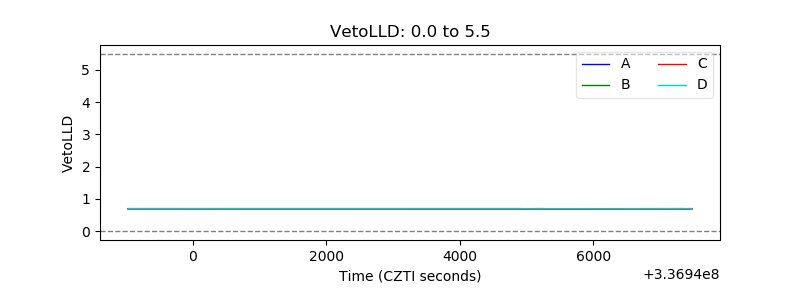 |
| Alpha Counter | 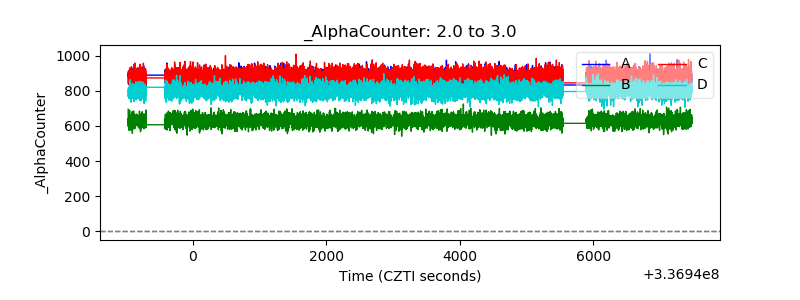 |
| _CPM_Rate | 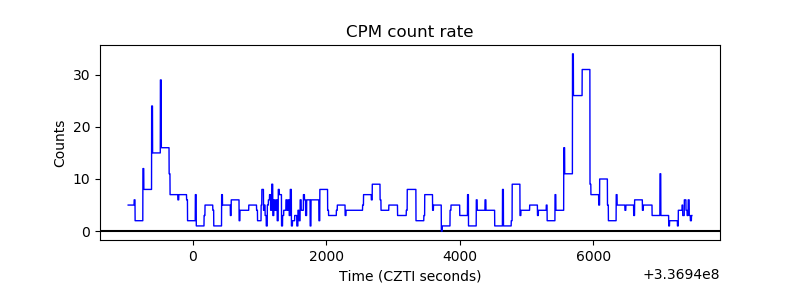 |
| CZT Counter | 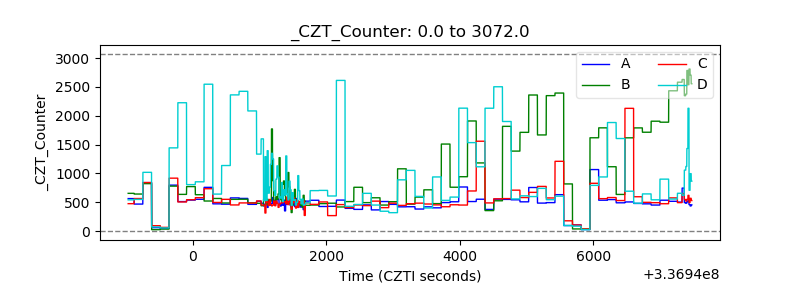 |
| +2.5 Volts monitor | 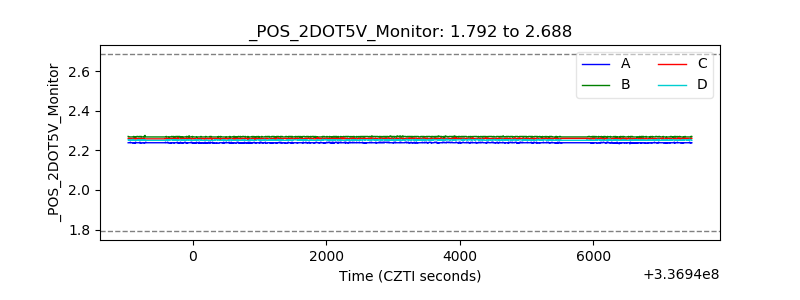 |
| +5 Volts monitor | 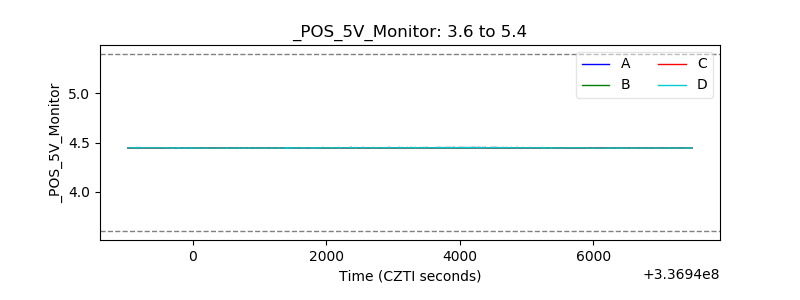 |
| _ROLL_ROT | 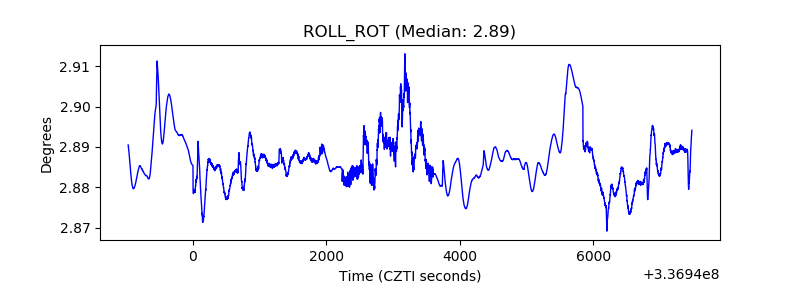 |
| _Roll_DEC | 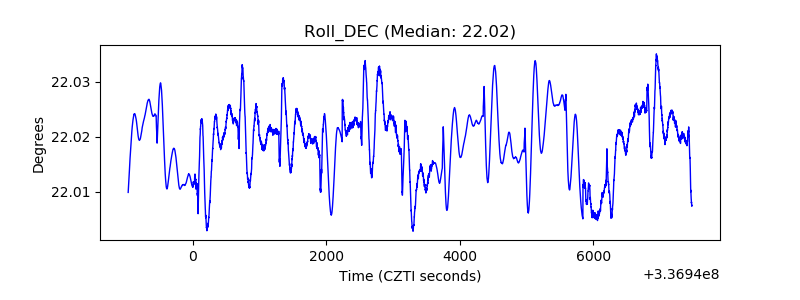 |
| _Roll_RA | 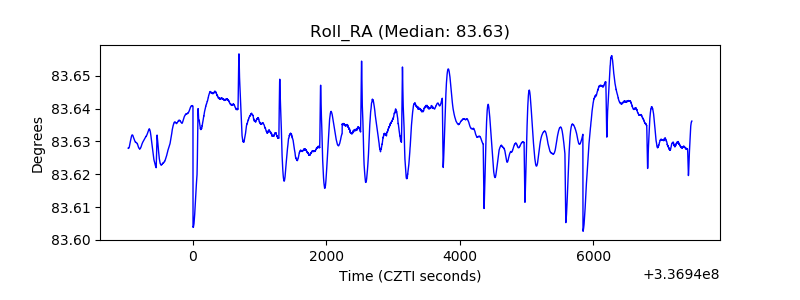 |
| Veto Counter | 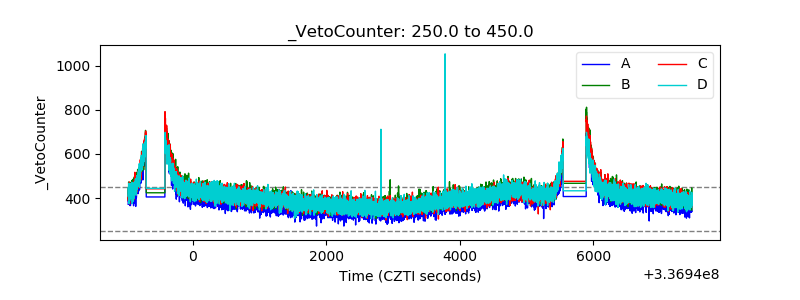 |