| Param | Original file | Final file |
|---|---|---|
| Filename | modeM0/AS1A09_145T01_9000003848_26701cztM0_level2.evt | modeM0/AS1A09_145T01_9000003848_26701cztM0_level2_quad_clean.evt |
| Size (bytes) | 1,472,702,400 | 252,466,560 |
| Size | 1.4 GB | 240.8 MB |
| Events in quadrant A | 7,901,289 | 1,721,746 |
| Events in quadrant B | 13,034,066 | 1,619,195 |
| Events in quadrant C | 9,432,950 | 1,643,539 |
| Events in quadrant D | 13,175,503 | 1,579,926 |
| Mode M0 | |||
|---|---|---|---|
| Quadrant | BADHDUFLAG | Total packets | Discarded packets |
| A | 0 | 33439 | 0 |
| B | 0 | 48905 | 0 |
| C | 0 | 38035 | 0 |
| D | 0 | 49970 | 0 |
| Mode M9 | |||
|---|---|---|---|
| Quadrant | BADHDUFLAG | Total packets | Discarded packets |
| A | 0 | 17 | 0 |
| B | 0 | 17 | 0 |
| C | 0 | 17 | 0 |
| D | 0 | 17 | 0 |
| Quadrant | Total seconds | Saturated seconds | Saturation percentage |
|---|---|---|---|
| A | 15673 | 159 | 1.014484% |
| B | 15673 | 2315 | 14.770625% |
| C | 15674 | 566 | 3.611076% |
| D | 15674 | 1352 | 8.625750% |
Noise dominated data is calculated using 1-second bins in cleaned event files. If a bin has >2000 counts, and if more than 50% of those come from <1% of pixels, then it is considered to be noise-dominated and hence unusable.
| Quadrant | # 1 sec bins | Bins with >0 counts | Bins with >2000 counts | High rate bins dominated by noise | Noise dominated (total time) | Noise dominated (detector-on time) | Marked lightcurve |
|---|---|---|---|---|---|---|---|
| A | 25568 | 15676 | 58 | 58 | 0.23% | 0.37% | 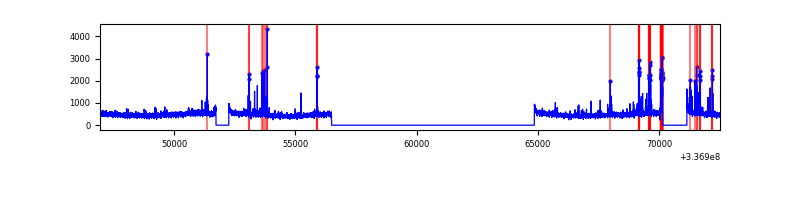 |
| B | 25568 | 15676 | 1687 | 1687 | 6.60% | 10.76% | 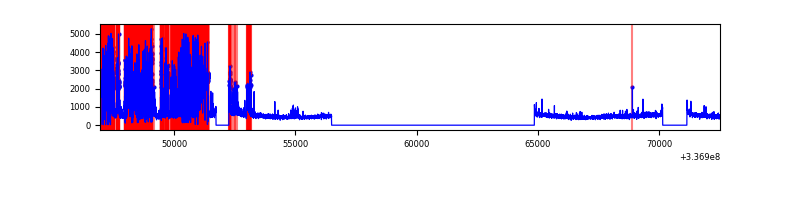 |
| C | 25569 | 15677 | 253 | 253 | 0.99% | 1.61% | 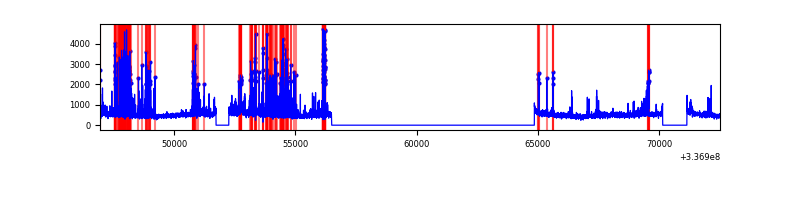 |
| D | 25569 | 15677 | 940 | 940 | 3.68% | 6.00% | 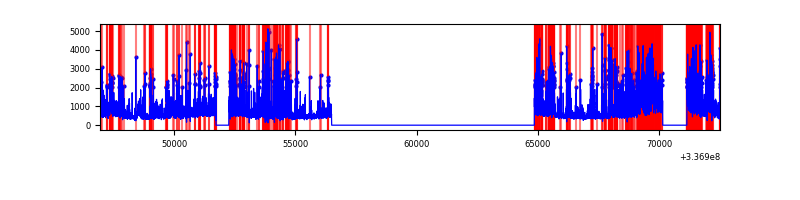 |
Top three noisy pixels from each quadrant. If the there are fewer than three noisy pixels in the level2.evt file, extra rows are filled as -1
| Pixel properties | Quadrant properties | ||||||
|---|---|---|---|---|---|---|---|
| Quadrant | DetID | PixID | Counts | Sigma | Mean | Median | Sigma |
| A | 0 | 13 | 325557 | 825.08 | 1927 | 1897 | 392.3 |
| A | 12 | 96 | 140721 | 353.89 | 1927 | 1897 | 392.3 |
| A | 13 | 254 | 27189 | 64.47 | 1927 | 1897 | 392.3 |
| B | 0 | 189 | 5808076 | 17324.42 | 1766 | 1726 | 335.2 |
| B | 10 | 246 | 99867 | 292.82 | 1766 | 1726 | 335.2 |
| B | 5 | 172 | 90588 | 265.14 | 1766 | 1726 | 335.2 |
| C | 1 | 0 | 1452065 | 3341.95 | 1837 | 1857 | 433.9 |
| C | 14 | 238 | 292212 | 669.11 | 1837 | 1857 | 433.9 |
| C | 3 | 233 | 262915 | 601.6 | 1837 | 1857 | 433.9 |
| D | 7 | 80 | 2860435 | 6477.49 | 1808 | 1763 | 441.3 |
| D | 1 | 52 | 2476290 | 5607.06 | 1808 | 1763 | 441.3 |
| D | 2 | 250 | 800275 | 1809.36 | 1808 | 1763 | 441.3 |
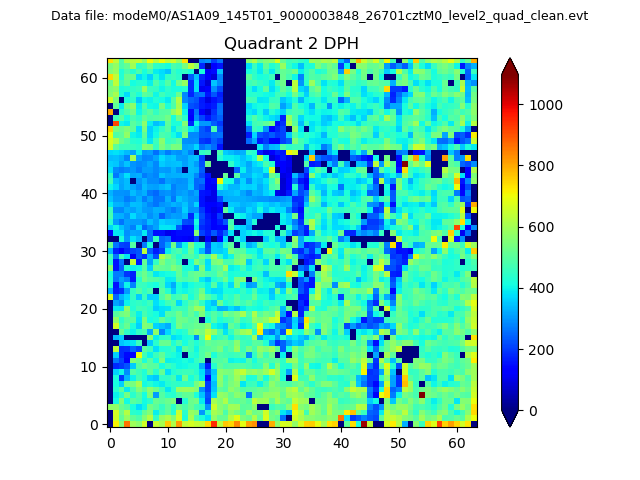
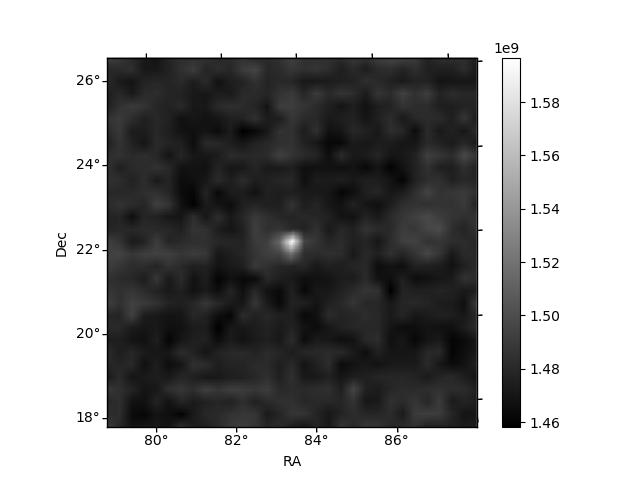
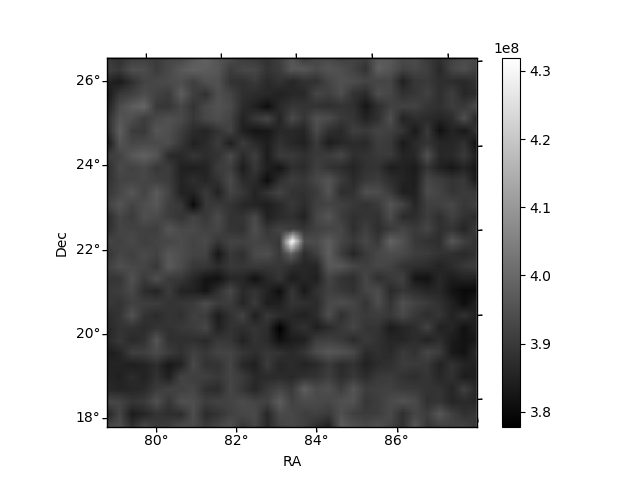
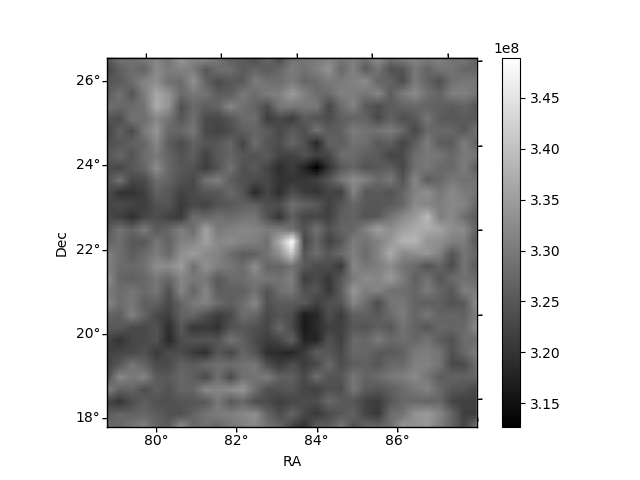
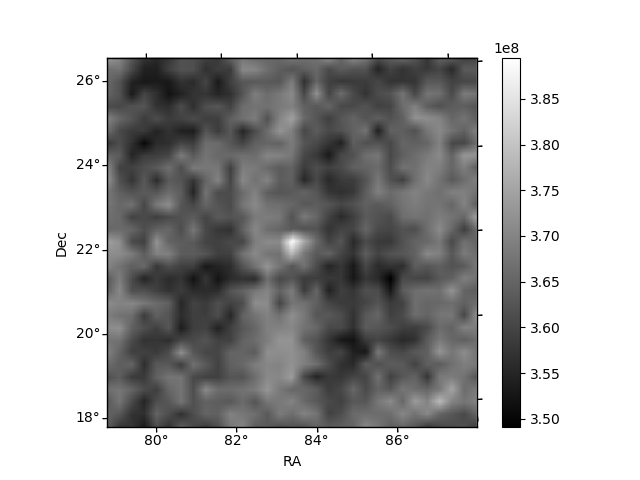
Histogram calculated using DETX and DETY for each event in the final _common_clean file
| Quadrant A | 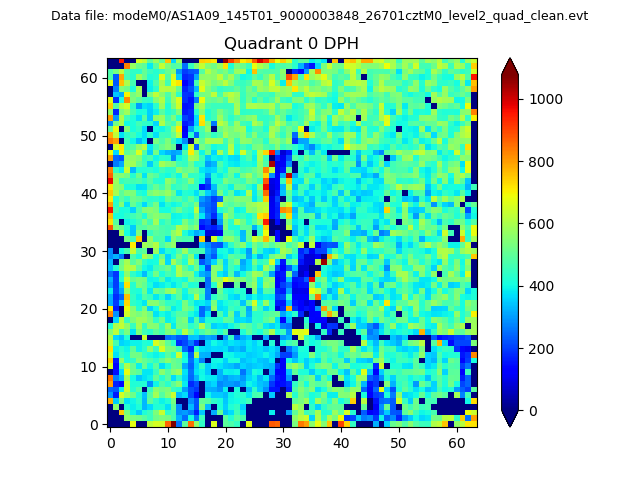 |
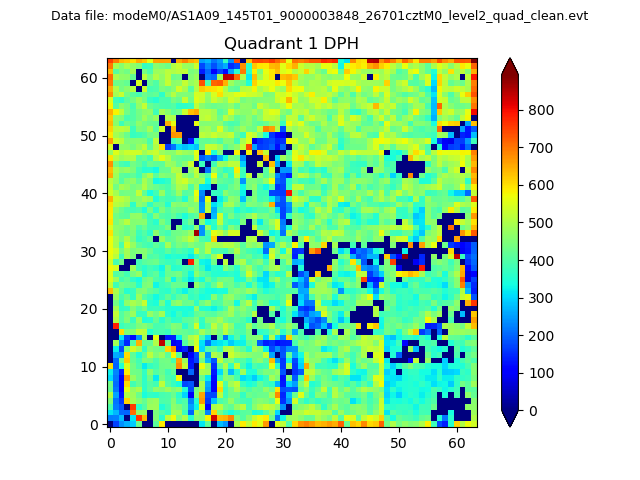 |
Quadrant B |
|---|---|---|---|
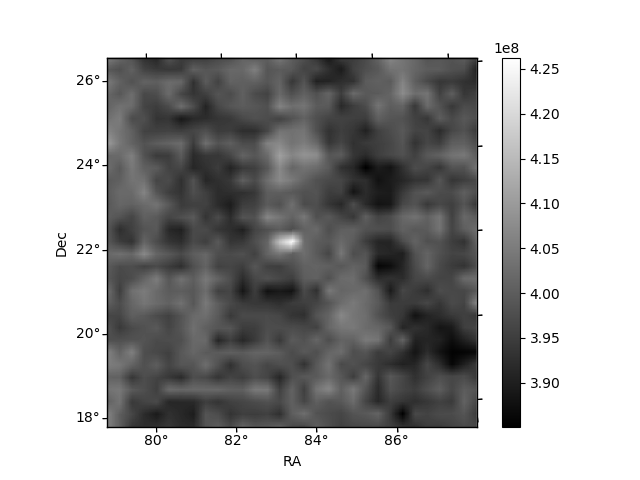
| Quadrant D | 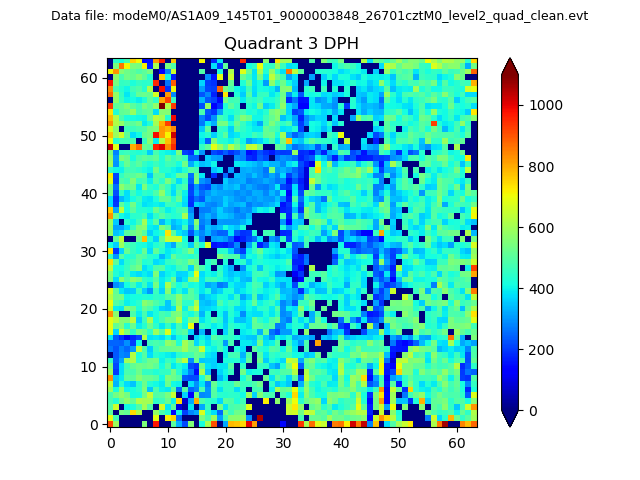 |
 |
Quadrant C |
| Plot type | Count rate plots | Images |
|---|---|---|
| Comparison with Poisson distribution Blue bars denote a histogram of data divided into 1 sec bins. Red curve is a Poisson curve with rate = median count rate of data. |
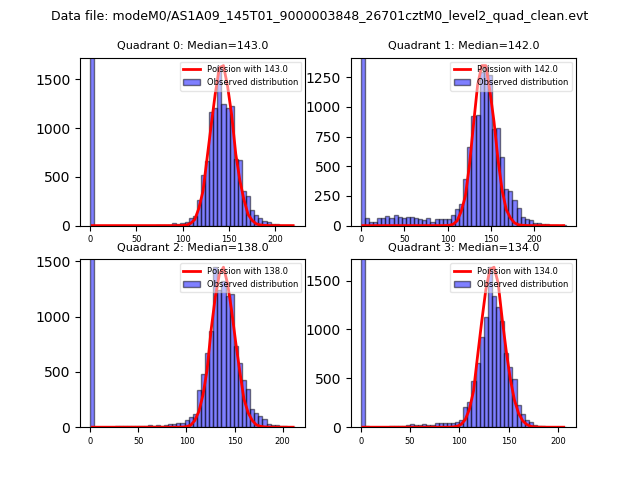 |
 |
| Quadrant-wise count rates Data is divided into 100 sec bins |
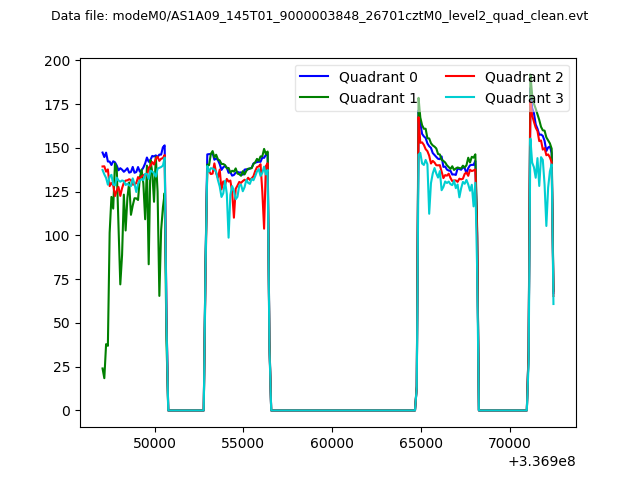 |
|
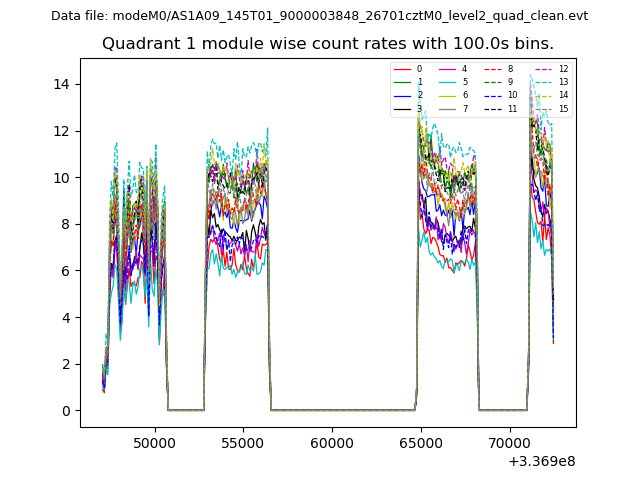
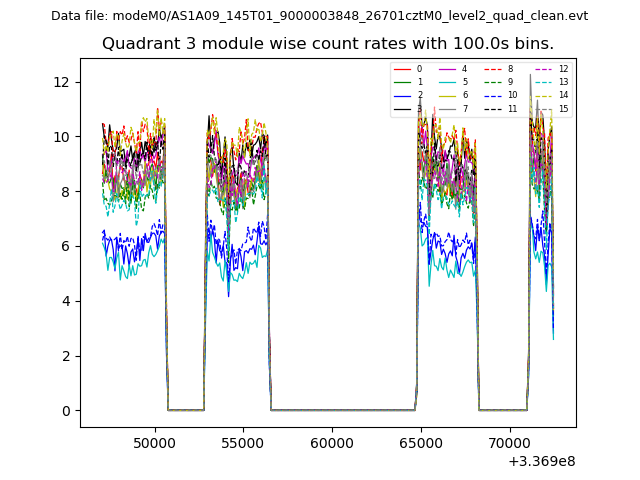
| Module-wise count rates for Quadrant A Data is divided into 100 sec bins |
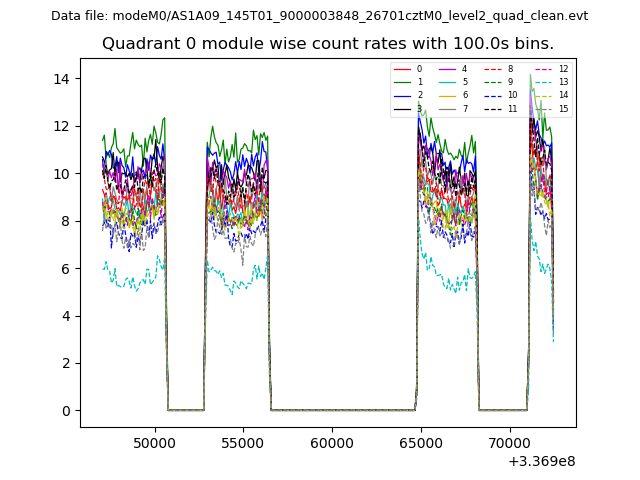 |
 |
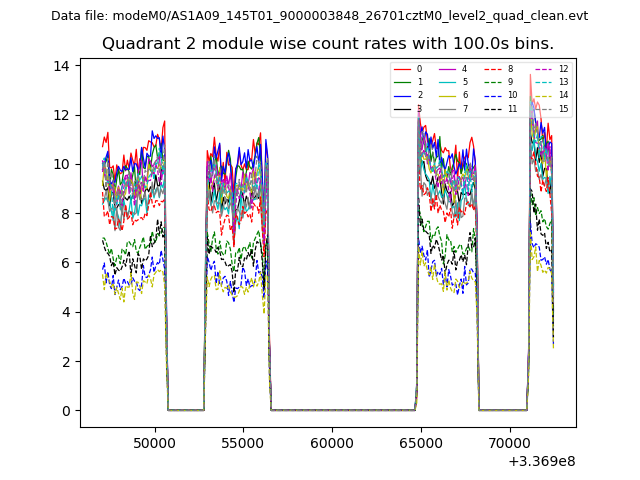
| Module-wise count rates for Quadrant B Data is divided into 100 sec bins |
 |
 |
| Module-wise count rates for Quadrant C Data is divided into 100 sec bins |
 |
 |
| Module-wise count rates for Quadrant D Data is divided into 100 sec bins |
 |
 |
| Parameter | Plot |
|---|---|
| CZT HV Monitor |  |
| D_VDD | 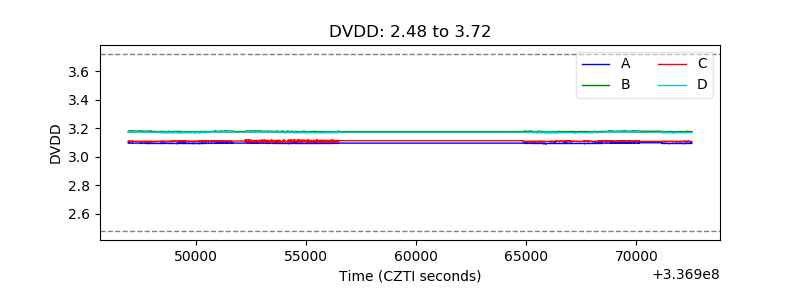 |
| Temperature 1 | 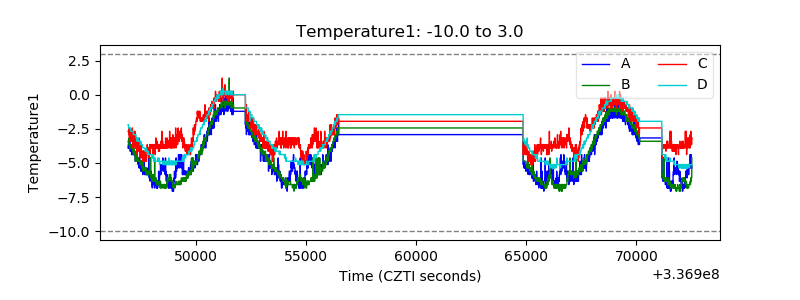 |
| Veto HV Monitor | 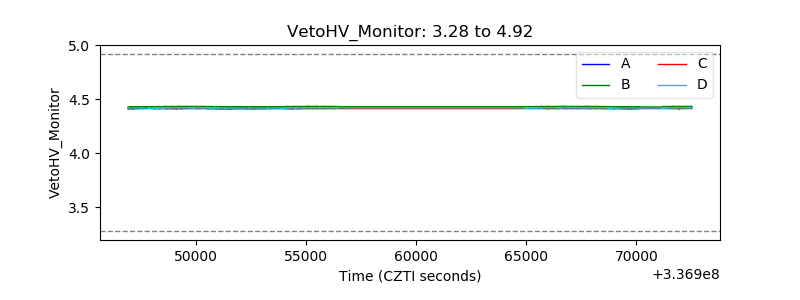 |
| Veto LLD | 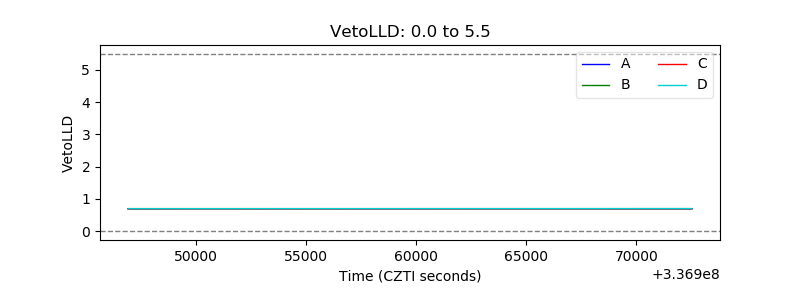 |
| Alpha Counter | 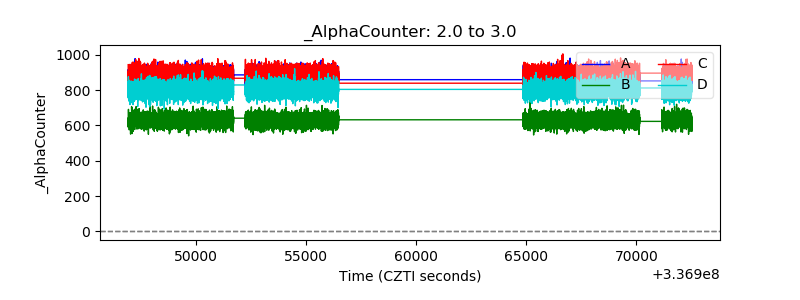 |
| _CPM_Rate | 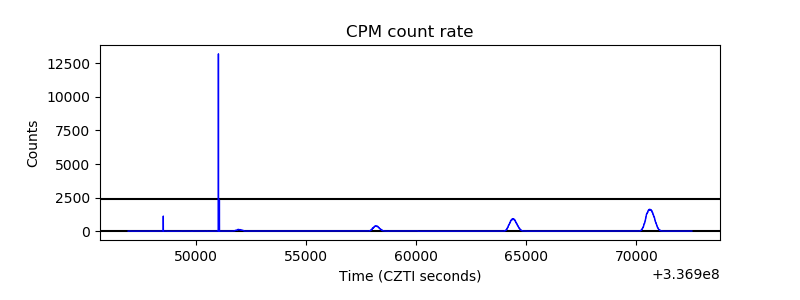 |
| CZT Counter | 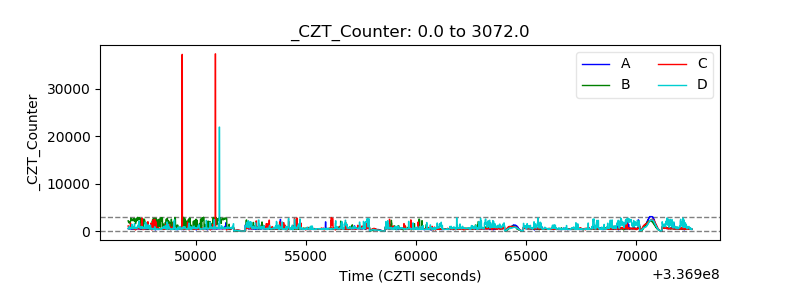 |
| +2.5 Volts monitor | 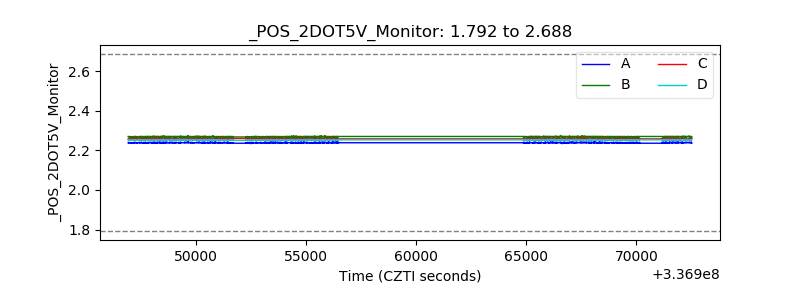 |
| +5 Volts monitor | 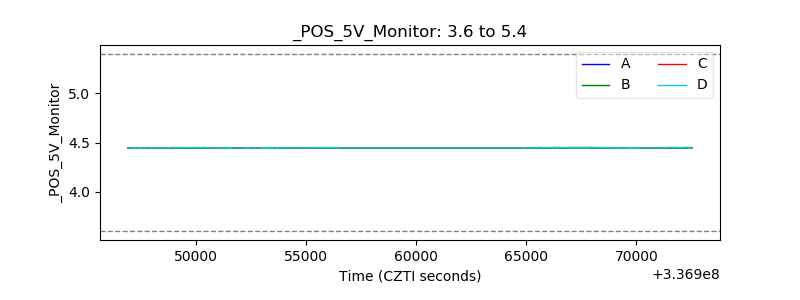 |
| _ROLL_ROT | 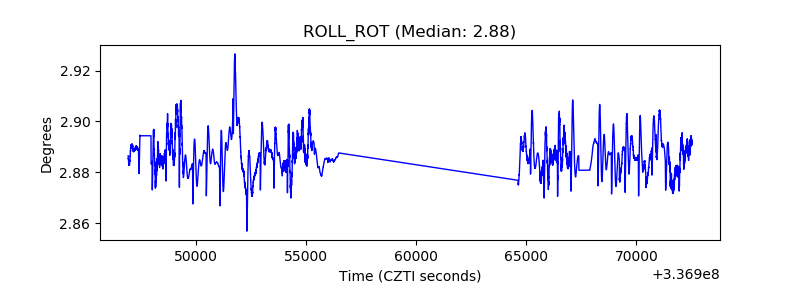 |
| _Roll_DEC | 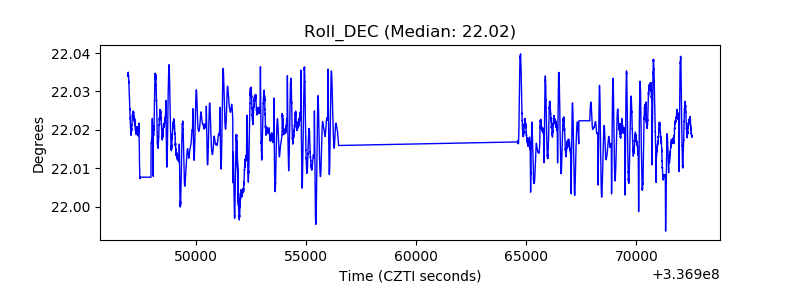 |
| _Roll_RA | 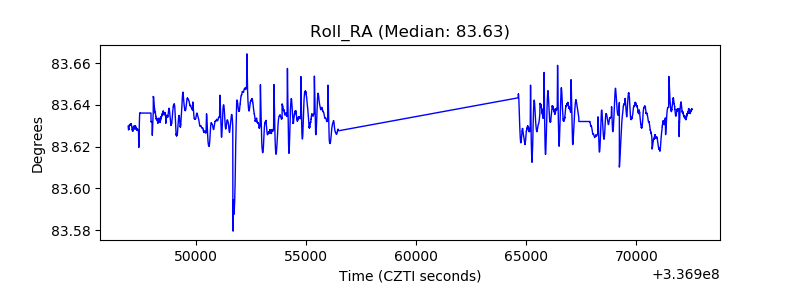 |
| Veto Counter | 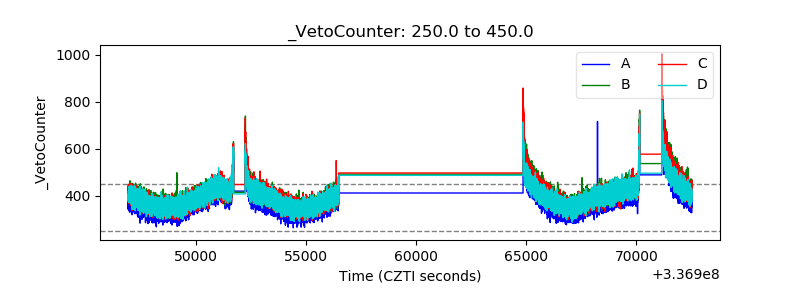 |