| Param | Original file | Final file |
|---|---|---|
| Filename | modeM0/AS1A09_145T01_9000003848_26703cztM0_level2.evt | modeM0/AS1A09_145T01_9000003848_26703cztM0_level2_quad_clean.evt |
| Size (bytes) | 2,316,732,480 | 407,191,680 |
| Size | 2.2 GB | 388.3 MB |
| Events in quadrant A | 12,962,855 | 2,743,531 |
| Events in quadrant B | 19,022,599 | 2,646,334 |
| Events in quadrant C | 15,003,978 | 2,624,160 |
| Events in quadrant D | 21,421,368 | 2,530,593 |
| Mode M0 | |||
|---|---|---|---|
| Quadrant | BADHDUFLAG | Total packets | Discarded packets |
| A | 0 | 54906 | 0 |
| B | 0 | 73331 | 0 |
| C | 0 | 61216 | 0 |
| D | 0 | 81468 | 0 |
| Mode M9 | |||
|---|---|---|---|
| Quadrant | BADHDUFLAG | Total packets | Discarded packets |
| A | 0 | 34 | 0 |
| B | 0 | 34 | 0 |
| C | 0 | 34 | 0 |
| D | 0 | 34 | 0 |
| Quadrant | Total seconds | Saturated seconds | Saturation percentage |
|---|---|---|---|
| A | 25999 | 185 | 0.711566% |
| B | 25999 | 2586 | 9.946536% |
| C | 26000 | 826 | 3.176923% |
| D | 26000 | 2112 | 8.123077% |
Noise dominated data is calculated using 1-second bins in cleaned event files. If a bin has >2000 counts, and if more than 50% of those come from <1% of pixels, then it is considered to be noise-dominated and hence unusable.
| Quadrant | # 1 sec bins | Bins with >0 counts | Bins with >2000 counts | High rate bins dominated by noise | Noise dominated (total time) | Noise dominated (detector-on time) | Marked lightcurve |
|---|---|---|---|---|---|---|---|
| A | 32116 | 26004 | 37 | 37 | 0.12% | 0.14% | 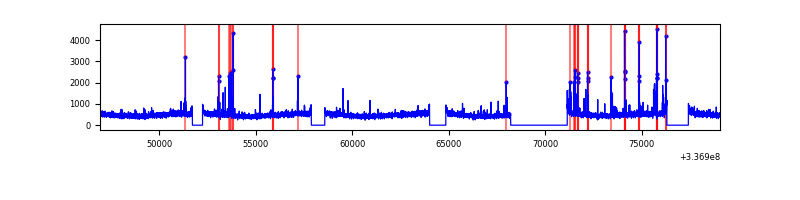 |
| B | 32116 | 26004 | 1776 | 1776 | 5.53% | 6.83% | 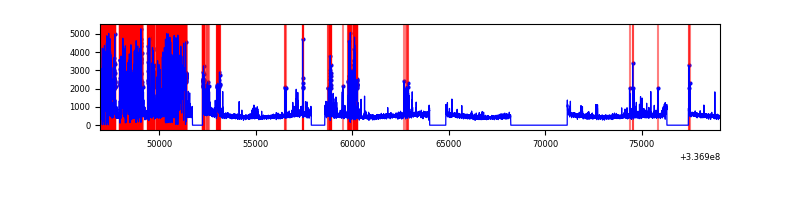 |
| C | 32117 | 26005 | 305 | 305 | 0.95% | 1.17% | 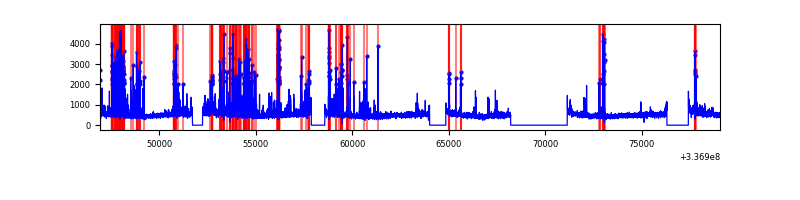 |
| D | 32117 | 26005 | 1531 | 1531 | 4.77% | 5.89% | 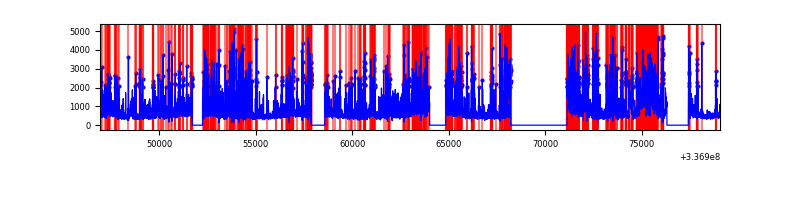 |
Top three noisy pixels from each quadrant. If the there are fewer than three noisy pixels in the level2.evt file, extra rows are filled as -1
| Pixel properties | Quadrant properties | ||||||
|---|---|---|---|---|---|---|---|
| Quadrant | DetID | PixID | Counts | Sigma | Mean | Median | Sigma |
| A | 0 | 13 | 390910 | 593.8 | 3236 | 3184 | 653.0 |
| A | 12 | 96 | 61382 | 89.13 | 3236 | 3184 | 653.0 |
| A | 13 | 254 | 43705 | 62.06 | 3236 | 3184 | 653.0 |
| B | 0 | 189 | 6410965 | 11093.95 | 3052 | 2979 | 577.6 |
| B | 5 | 172 | 146370 | 248.25 | 3052 | 2979 | 577.6 |
| B | 3 | 112 | 130181 | 220.22 | 3052 | 2979 | 577.6 |
| C | 1 | 0 | 1578818 | 2186.14 | 3071 | 3104 | 720.8 |
| C | 14 | 238 | 492185 | 678.55 | 3071 | 3104 | 720.8 |
| C | 3 | 233 | 466298 | 642.63 | 3071 | 3104 | 720.8 |
| D | 1 | 52 | 4283961 | 5750.61 | 3032 | 2953 | 744.4 |
| D | 7 | 80 | 3865602 | 5188.63 | 3032 | 2953 | 744.4 |
| D | 2 | 250 | 1199972 | 1607.94 | 3032 | 2953 | 744.4 |
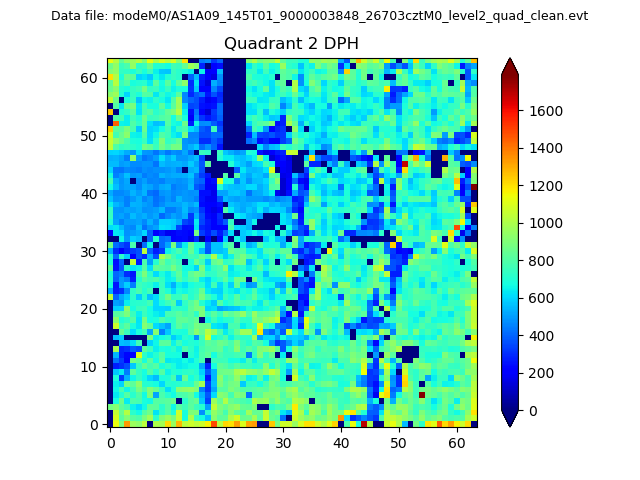
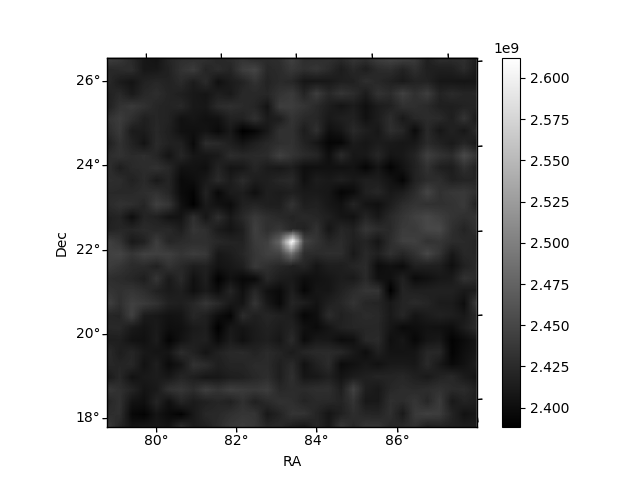
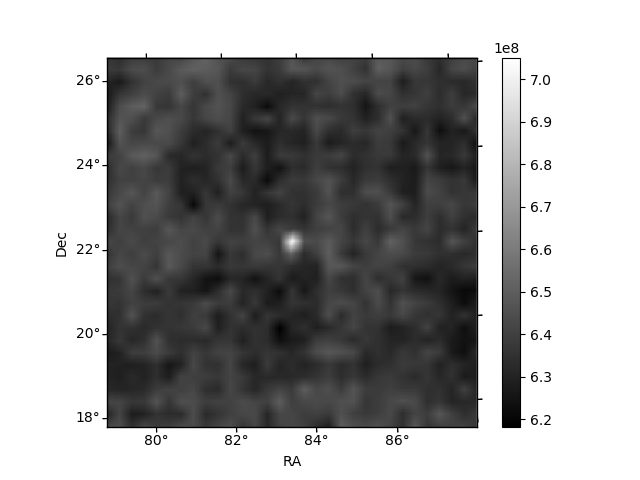
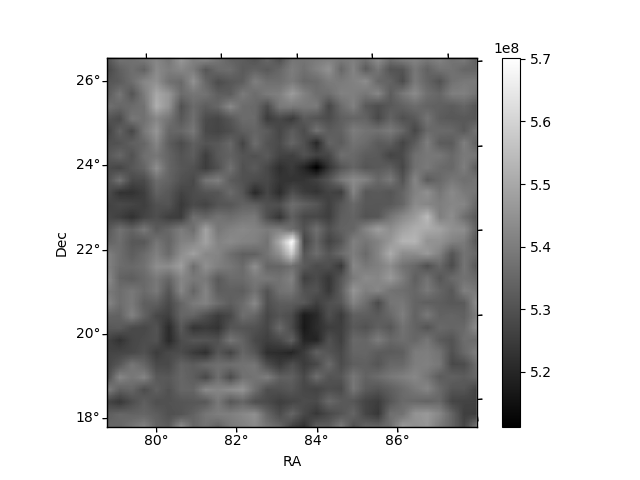
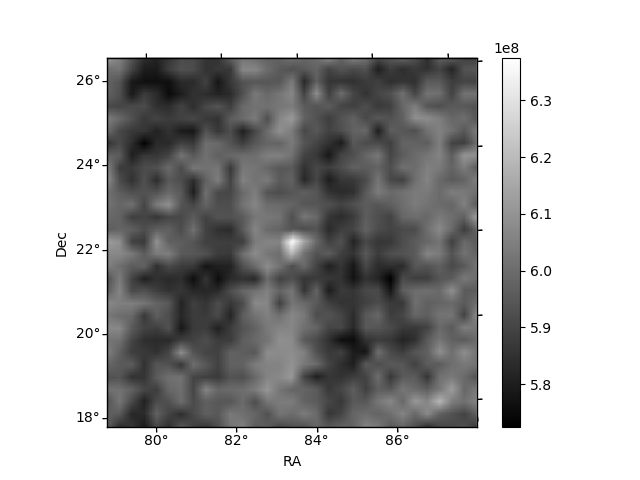
Histogram calculated using DETX and DETY for each event in the final _common_clean file
| Quadrant A | 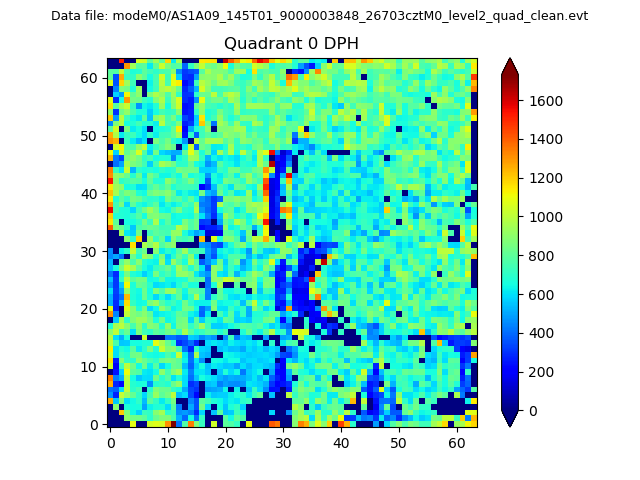 |
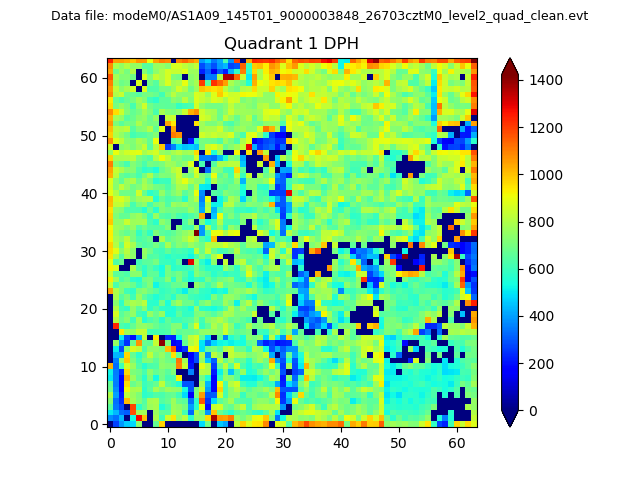 |
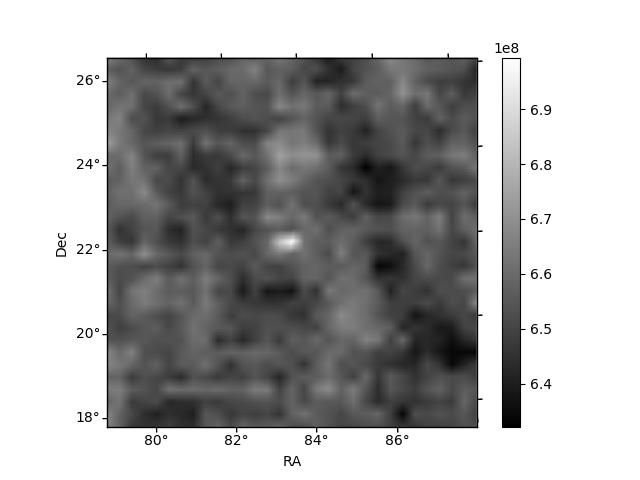
Quadrant B |
|---|---|---|---|
| Quadrant D | 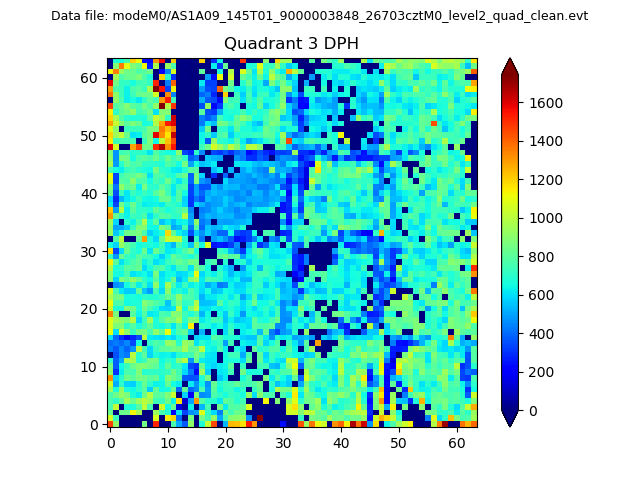 |
 |
Quadrant C |
| Plot type | Count rate plots | Images |
|---|---|---|
| Comparison with Poisson distribution Blue bars denote a histogram of data divided into 1 sec bins. Red curve is a Poisson curve with rate = median count rate of data. |
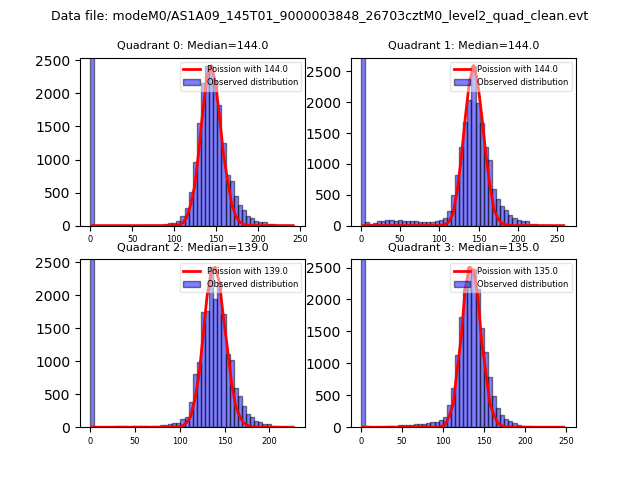 |
 |
| Quadrant-wise count rates Data is divided into 100 sec bins |
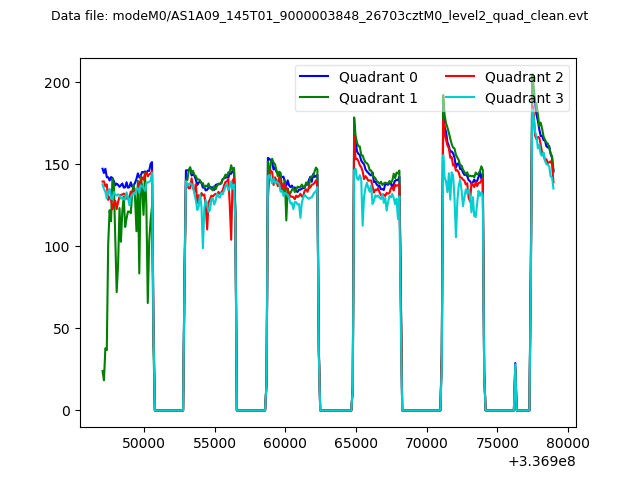 |
|
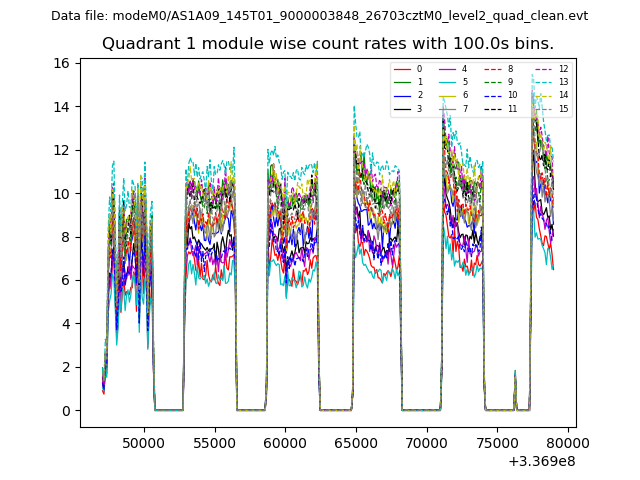
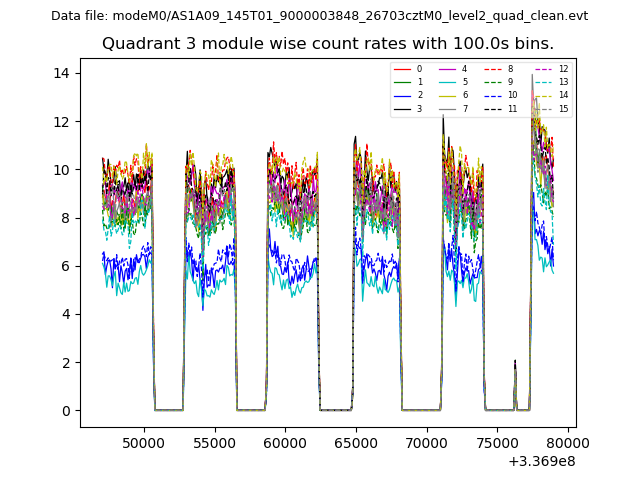
| Module-wise count rates for Quadrant A Data is divided into 100 sec bins |
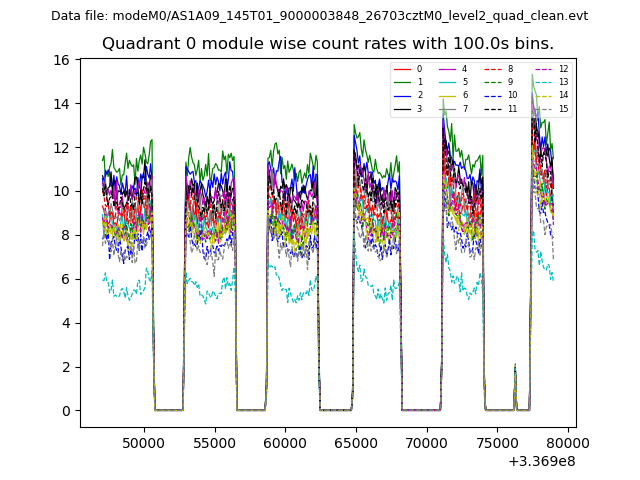 |
 |
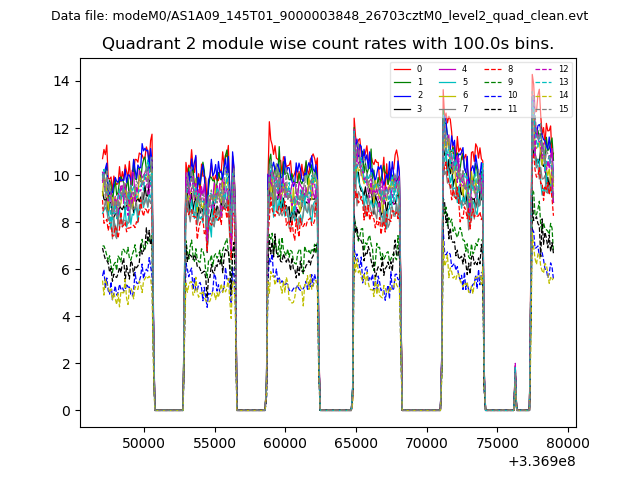
| Module-wise count rates for Quadrant B Data is divided into 100 sec bins |
 |
 |
| Module-wise count rates for Quadrant C Data is divided into 100 sec bins |
 |
 |
| Module-wise count rates for Quadrant D Data is divided into 100 sec bins |
 |
 |
| Parameter | Plot |
|---|---|
| CZT HV Monitor | 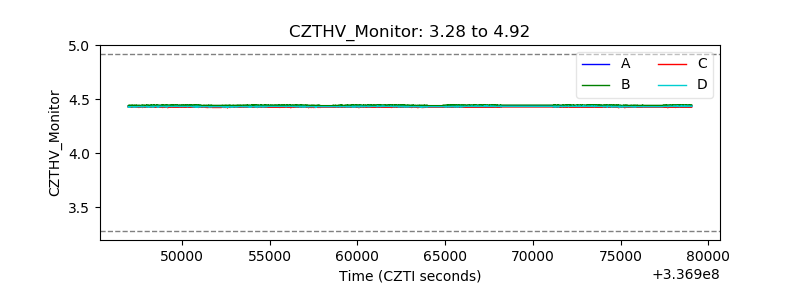 |
| D_VDD | 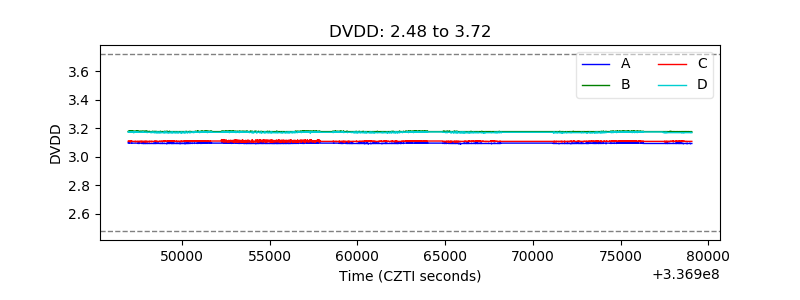 |
| Temperature 1 | 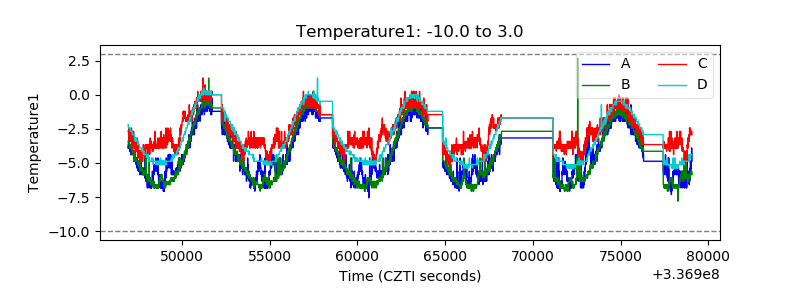 |
| Veto HV Monitor | 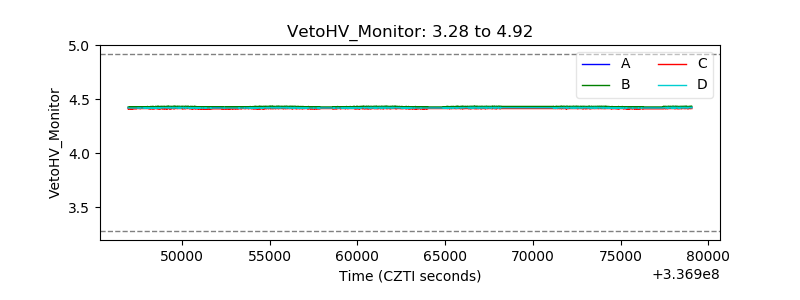 |
| Veto LLD | 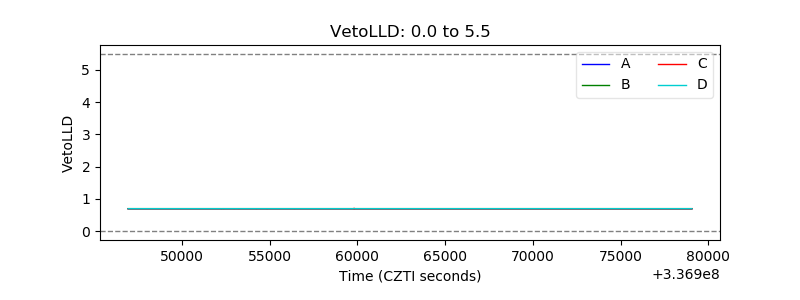 |
| Alpha Counter | 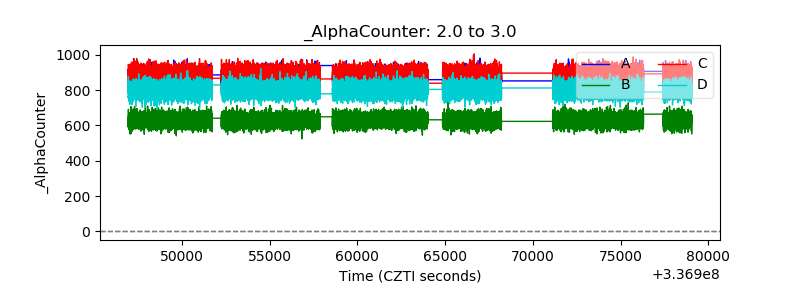 |
| _CPM_Rate | 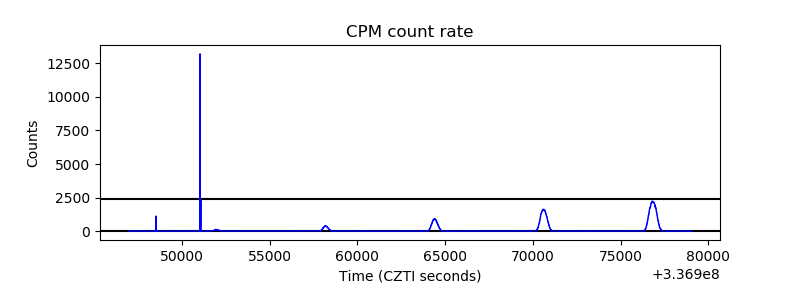 |
| CZT Counter | 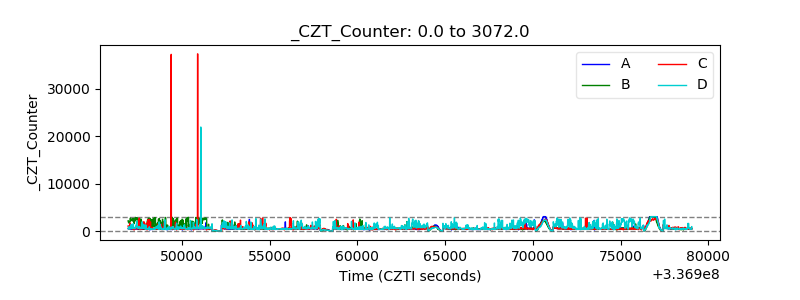 |
| +2.5 Volts monitor | 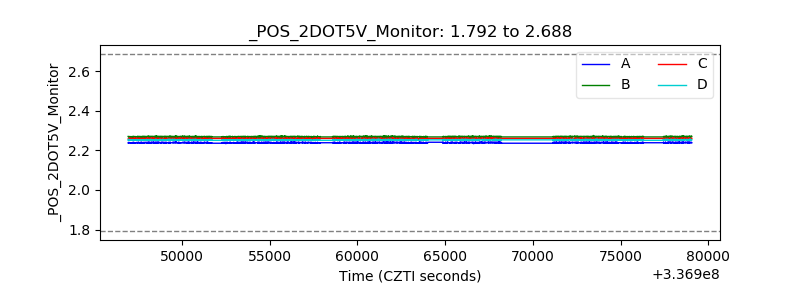 |
| +5 Volts monitor |  |
| _ROLL_ROT | 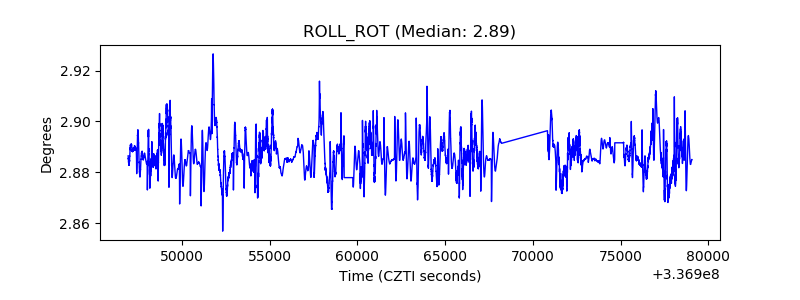 |
| _Roll_DEC | 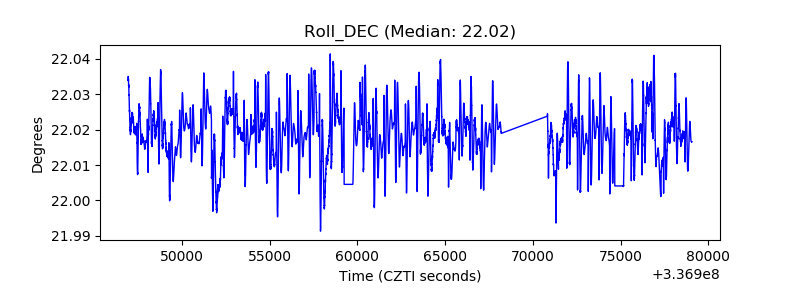 |
| _Roll_RA | 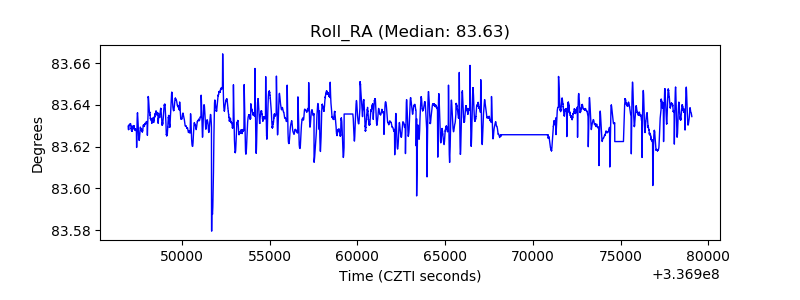 |
| Veto Counter |  |