| Param | Original file | Final file |
|---|---|---|
| Filename | modeM0/AS1A09_145T01_9000003848_26705cztM0_level2.evt | modeM0/AS1A09_145T01_9000003848_26705cztM0_level2_quad_clean.evt |
| Size (bytes) | 428,567,040 | 87,324,480 |
| Size | 408.7 MB | 83.3 MB |
| Events in quadrant A | 3,003,251 | 579,969 |
| Events in quadrant B | 2,987,659 | 588,026 |
| Events in quadrant C | 3,020,185 | 552,452 |
| Events in quadrant D | 3,594,182 | 538,855 |
| Mode M0 | |||
|---|---|---|---|
| Quadrant | BADHDUFLAG | Total packets | Discarded packets |
| A | 0 | 12031 | 0 |
| B | 0 | 11933 | 0 |
| C | 0 | 12156 | 0 |
| D | 0 | 14112 | 0 |
| Mode M9 | |||
|---|---|---|---|
| Quadrant | BADHDUFLAG | Total packets | Discarded packets |
| A | 0 | 13 | 0 |
| B | 0 | 13 | 0 |
| C | 0 | 13 | 0 |
| D | 0 | 13 | 0 |
| Quadrant | Total seconds | Saturated seconds | Saturation percentage |
|---|---|---|---|
| A | 5504 | 33 | 0.599564% |
| B | 5505 | 27 | 0.490463% |
| C | 5505 | 97 | 1.762035% |
| D | 5505 | 92 | 1.671208% |
Noise dominated data is calculated using 1-second bins in cleaned event files. If a bin has >2000 counts, and if more than 50% of those come from <1% of pixels, then it is considered to be noise-dominated and hence unusable.
| Quadrant | # 1 sec bins | Bins with >0 counts | Bins with >2000 counts | High rate bins dominated by noise | Noise dominated (total time) | Noise dominated (detector-on time) | Marked lightcurve |
|---|---|---|---|---|---|---|---|
| A | 6809 | 5505 | 3 | 3 | 0.04% | 0.05% | 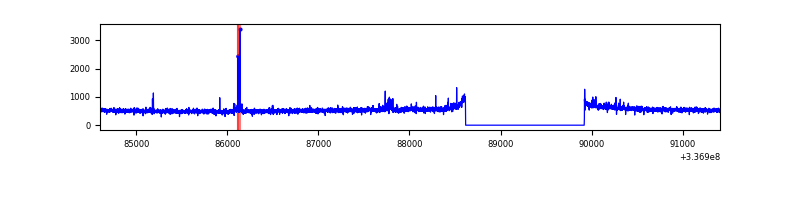 |
| B | 6810 | 5506 | 3 | 3 | 0.04% | 0.05% | 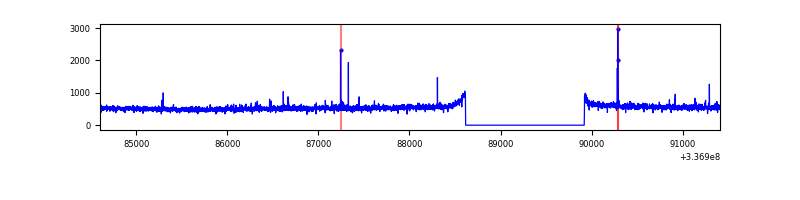 |
| C | 6810 | 5506 | 29 | 29 | 0.43% | 0.53% | 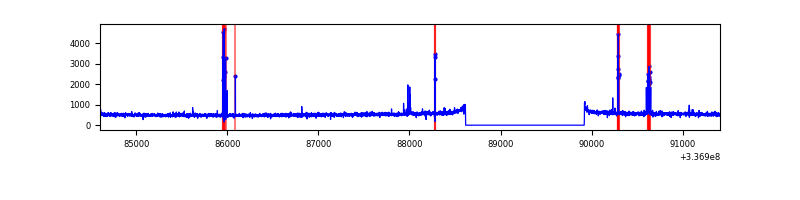 |
| D | 6810 | 5506 | 80 | 80 | 1.17% | 1.45% | 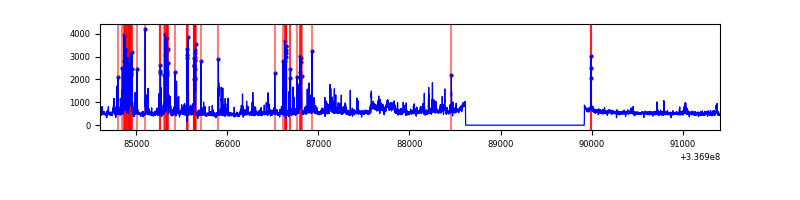 |
Top three noisy pixels from each quadrant. If the there are fewer than three noisy pixels in the level2.evt file, extra rows are filled as -1
| Pixel properties | Quadrant properties | ||||||
|---|---|---|---|---|---|---|---|
| Quadrant | DetID | PixID | Counts | Sigma | Mean | Median | Sigma |
| A | 0 | 13 | 51068 | 333.02 | 757 | 746 | 151.1 |
| A | 6 | 16 | 20506 | 130.77 | 757 | 746 | 151.1 |
| A | 13 | 254 | 8722 | 52.78 | 757 | 746 | 151.1 |
| B | 0 | 189 | 52470 | 369.56 | 744 | 730 | 140.0 |
| B | 10 | 251 | 23068 | 159.55 | 744 | 730 | 140.0 |
| B | 12 | 111 | 15902 | 108.37 | 744 | 730 | 140.0 |
| C | 15 | 208 | 125527 | 748.01 | 711 | 719 | 166.9 |
| C | 14 | 238 | 116170 | 691.93 | 711 | 719 | 166.9 |
| C | 13 | 61 | 4825 | 24.61 | 711 | 719 | 166.9 |
| D | 7 | 80 | 552978 | 3142.82 | 724 | 705 | 175.7 |
| D | 1 | 52 | 152462 | 863.6 | 724 | 705 | 175.7 |
| D | 1 | 239 | 72192 | 406.81 | 724 | 705 | 175.7 |
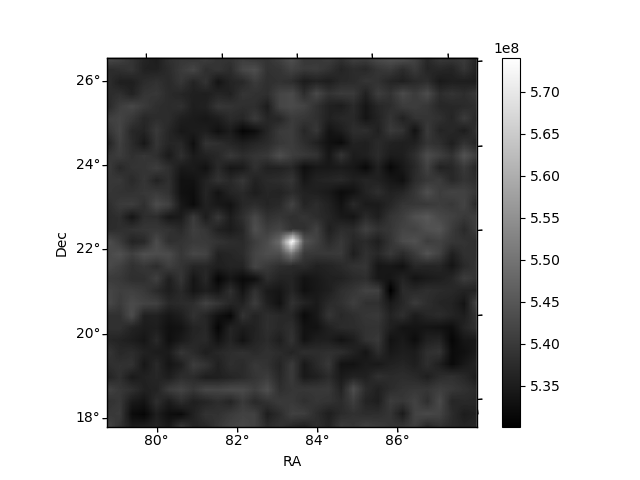
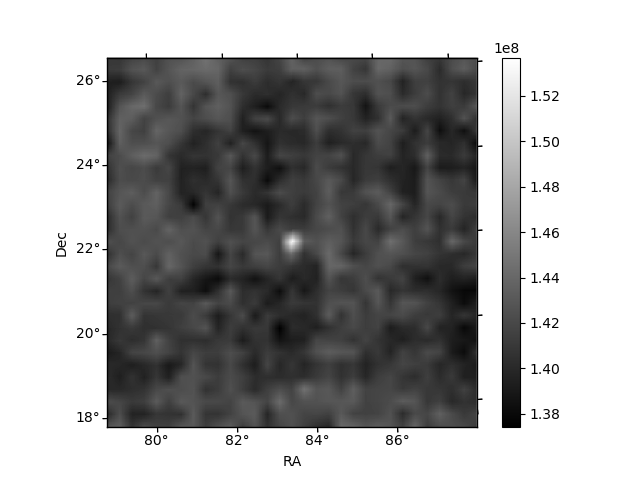
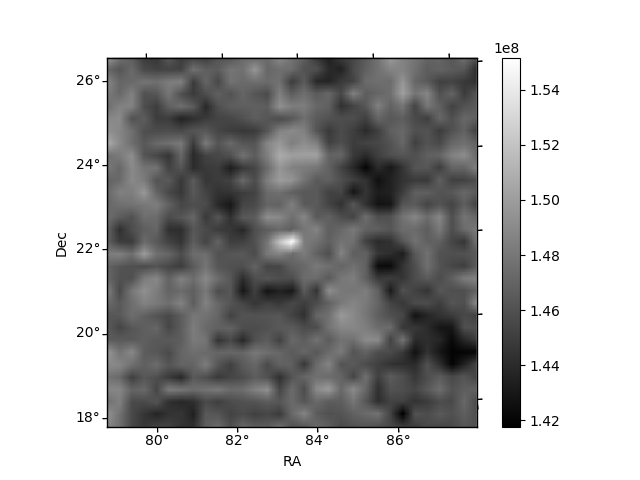
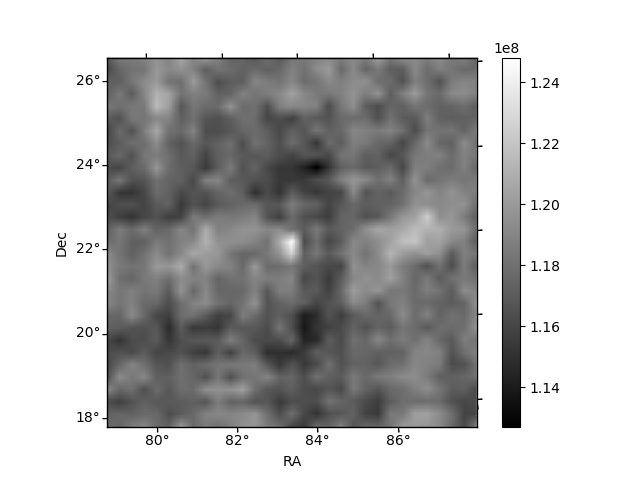
Histogram calculated using DETX and DETY for each event in the final _common_clean file
| Quadrant A | 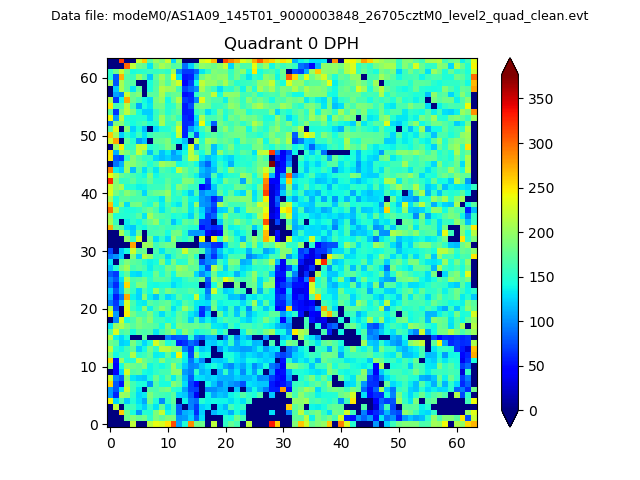 |
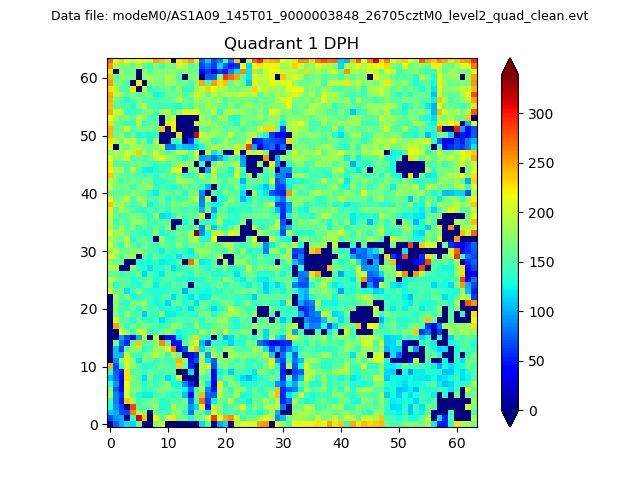 |
Quadrant B |
|---|---|---|---|
| Quadrant D |  |
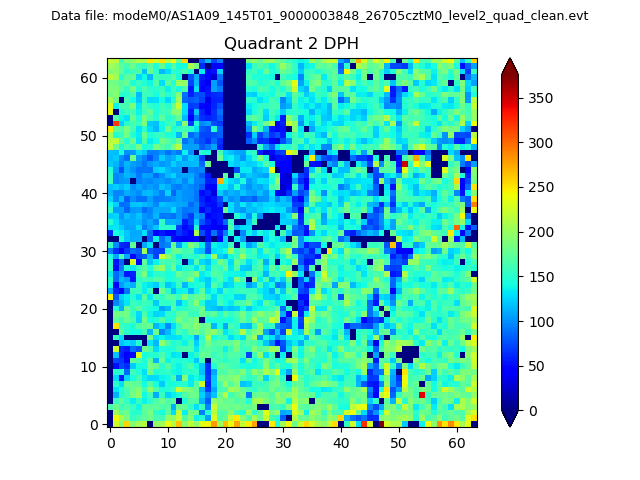 |
Quadrant C |
| Plot type | Count rate plots | Images |
|---|---|---|
| Comparison with Poisson distribution Blue bars denote a histogram of data divided into 1 sec bins. Red curve is a Poisson curve with rate = median count rate of data. |
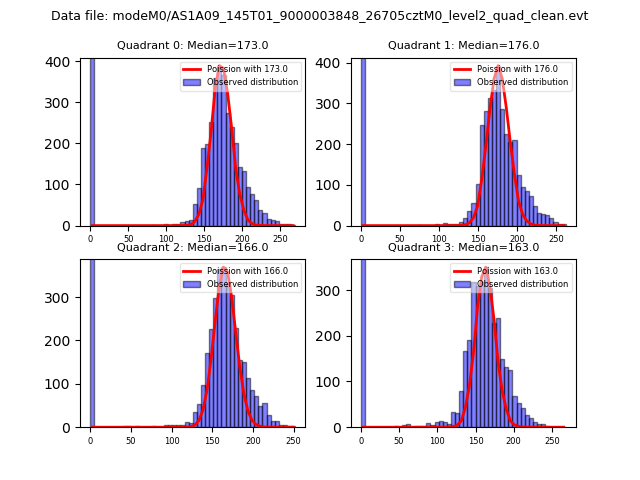 |
 |
| Quadrant-wise count rates Data is divided into 100 sec bins |
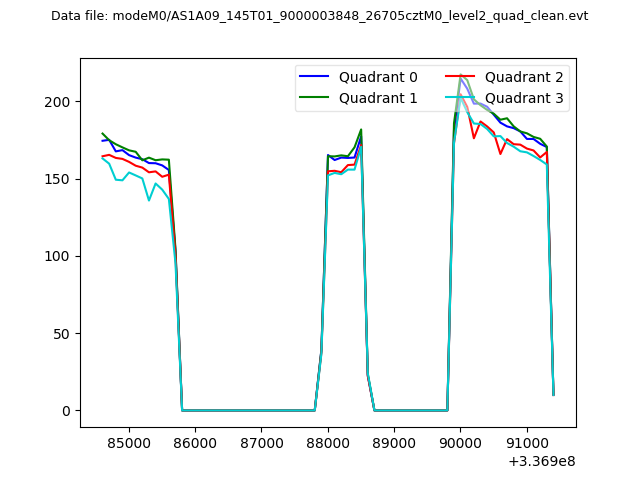 |
|
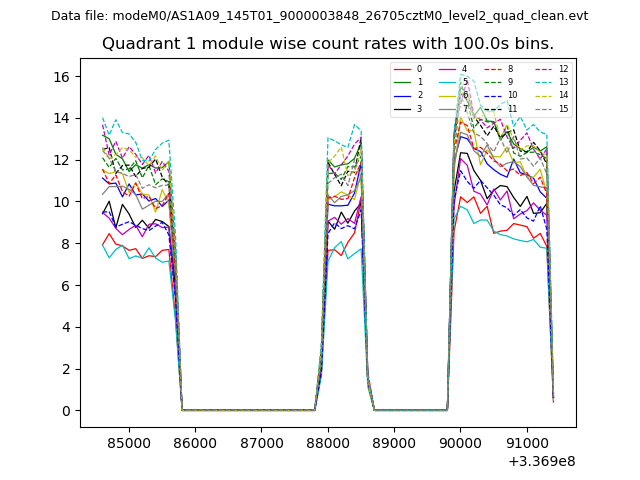
| Module-wise count rates for Quadrant A Data is divided into 100 sec bins |
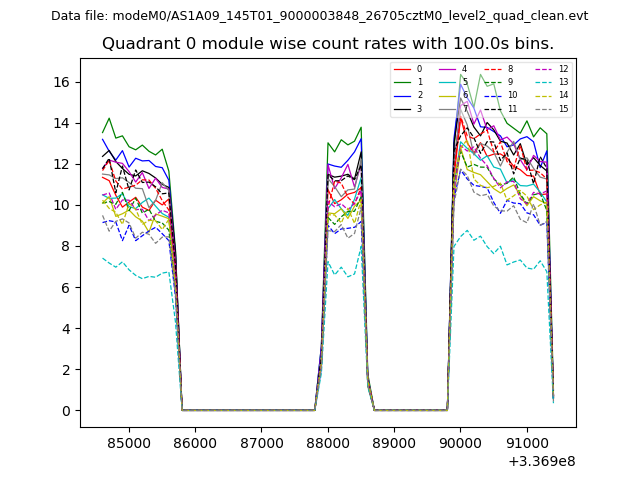 |
 |
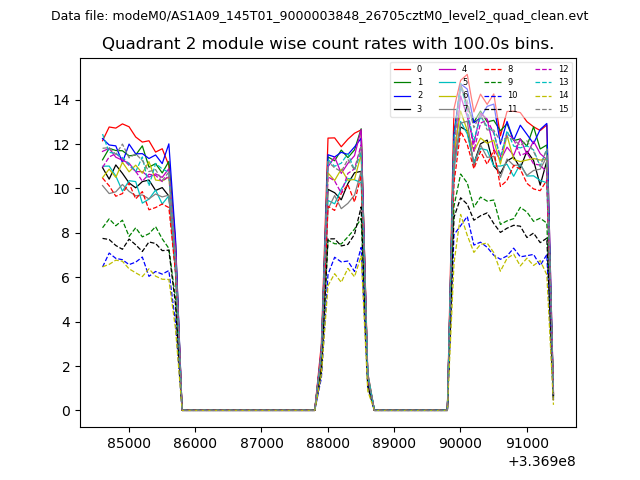
| Module-wise count rates for Quadrant B Data is divided into 100 sec bins |
 |
 |
| Module-wise count rates for Quadrant C Data is divided into 100 sec bins |
 |
 |
| Module-wise count rates for Quadrant D Data is divided into 100 sec bins |
 |
 |
| Parameter | Plot |
|---|---|
| CZT HV Monitor | 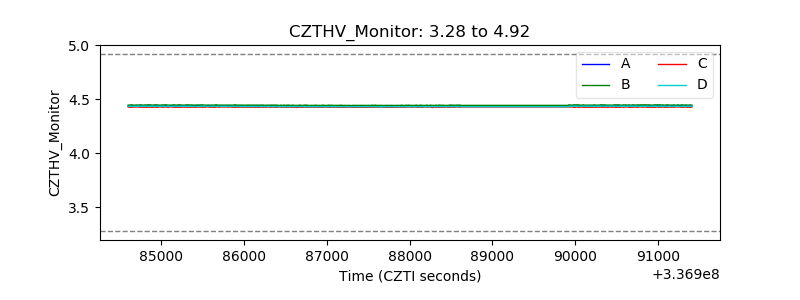 |
| D_VDD | 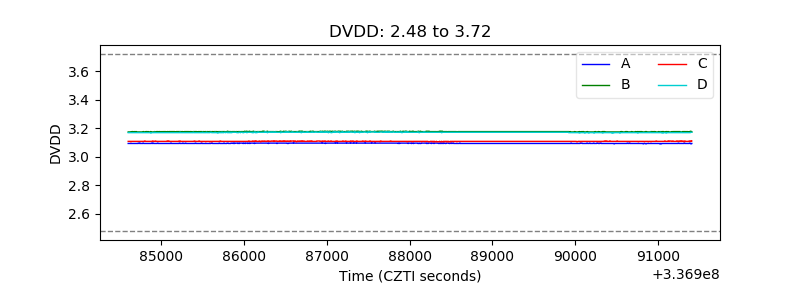 |
| Temperature 1 | 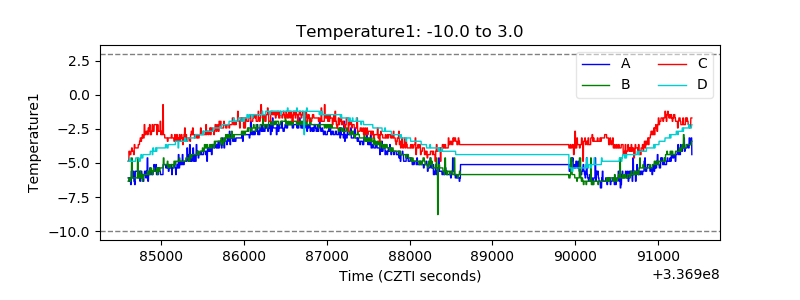 |
| Veto HV Monitor | 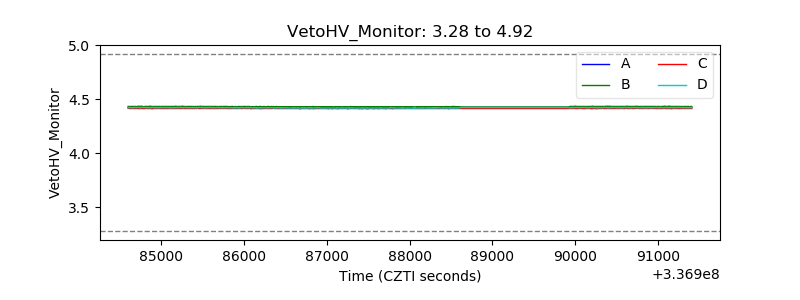 |
| Veto LLD | 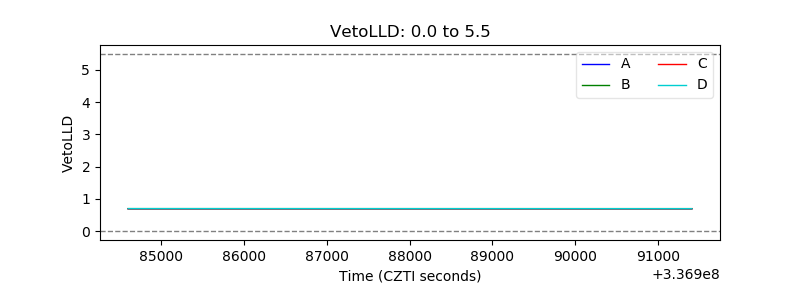 |
| Alpha Counter | 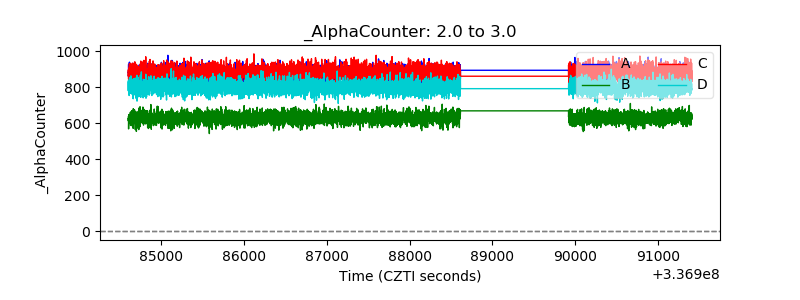 |
| _CPM_Rate | 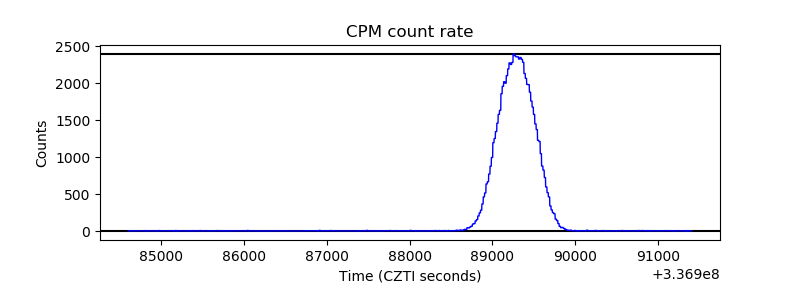 |
| CZT Counter | 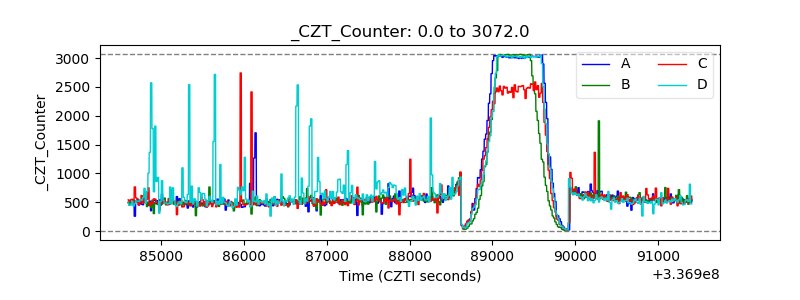 |
| +2.5 Volts monitor |  |
| +5 Volts monitor | 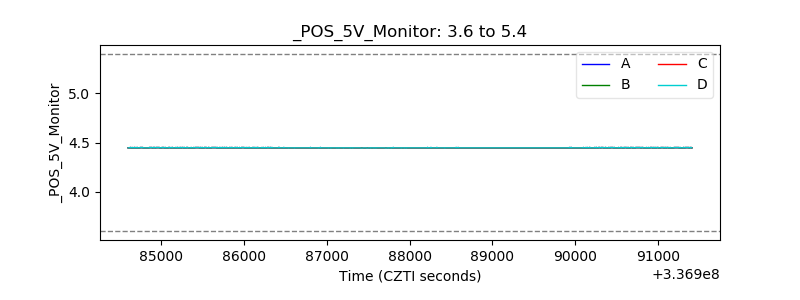 |
| _ROLL_ROT | 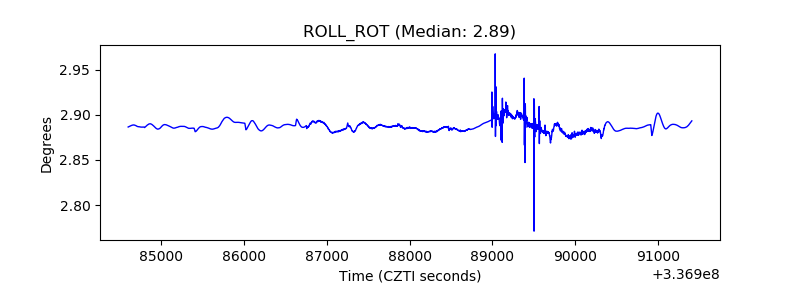 |
| _Roll_DEC | 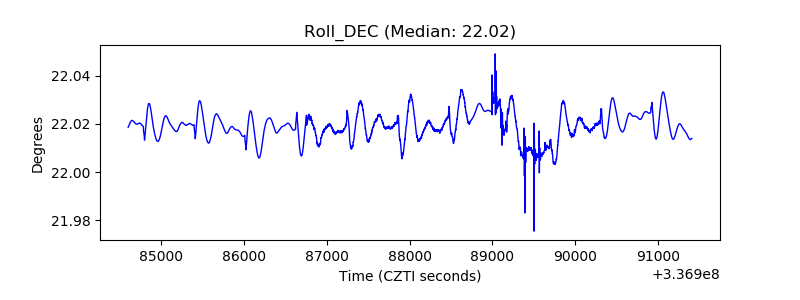 |
| _Roll_RA | 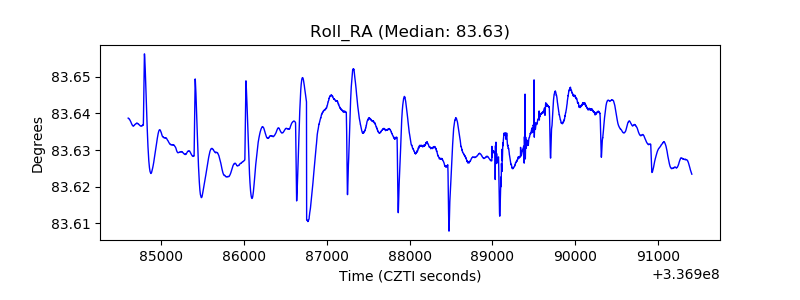 |
| Veto Counter | 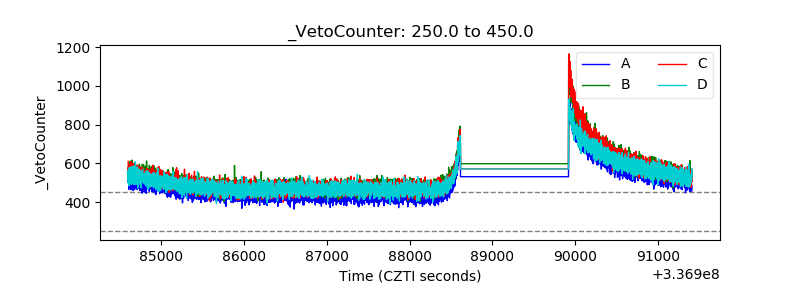 |