| Param | Original file | Final file |
|---|---|---|
| Filename | modeM0/AS1A09_145T01_9000003848_26706cztM0_level2.evt | modeM0/AS1A09_145T01_9000003848_26706cztM0_level2_quad_clean.evt |
| Size (bytes) | 470,076,480 | 85,008,960 |
| Size | 448.3 MB | 81.1 MB |
| Events in quadrant A | 3,064,138 | 569,501 |
| Events in quadrant B | 3,025,057 | 571,034 |
| Events in quadrant C | 2,998,113 | 543,312 |
| Events in quadrant D | 4,779,524 | 509,165 |
| Mode M0 | |||
|---|---|---|---|
| Quadrant | BADHDUFLAG | Total packets | Discarded packets |
| A | 0 | 12179 | 0 |
| B | 0 | 12000 | 0 |
| C | 0 | 11995 | 0 |
| D | 0 | 17757 | 0 |
| Mode M9 | |||
|---|---|---|---|
| Quadrant | BADHDUFLAG | Total packets | Discarded packets |
| A | 0 | 13 | 0 |
| B | 0 | 13 | 0 |
| C | 0 | 13 | 0 |
| D | 0 | 13 | 0 |
| Quadrant | Total seconds | Saturated seconds | Saturation percentage |
|---|---|---|---|
| A | 5440 | 60 | 1.102941% |
| B | 5441 | 67 | 1.231391% |
| C | 5441 | 85 | 1.562213% |
| D | 5441 | 546 | 10.034920% |
Noise dominated data is calculated using 1-second bins in cleaned event files. If a bin has >2000 counts, and if more than 50% of those come from <1% of pixels, then it is considered to be noise-dominated and hence unusable.
| Quadrant | # 1 sec bins | Bins with >0 counts | Bins with >2000 counts | High rate bins dominated by noise | Noise dominated (total time) | Noise dominated (detector-on time) | Marked lightcurve |
|---|---|---|---|---|---|---|---|
| A | 6765 | 5441 | 3 | 3 | 0.04% | 0.06% | 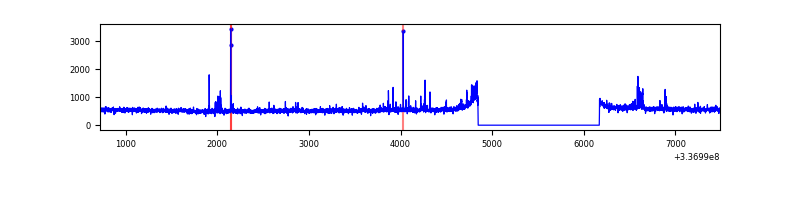 |
| B | 6766 | 5442 | 3 | 3 | 0.04% | 0.06% | 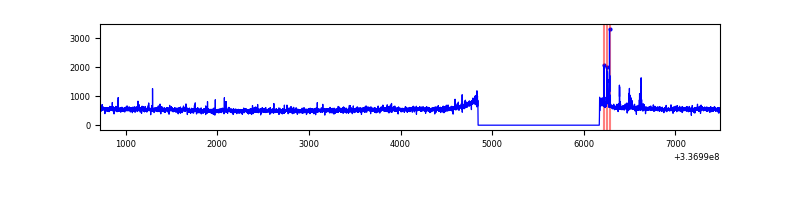 |
| C | 6766 | 5442 | 7 | 7 | 0.10% | 0.13% | 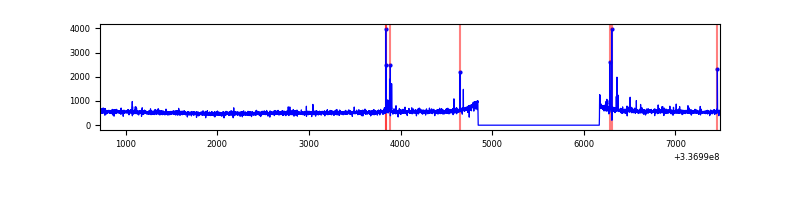 |
| D | 6766 | 5442 | 395 | 395 | 5.84% | 7.26% | 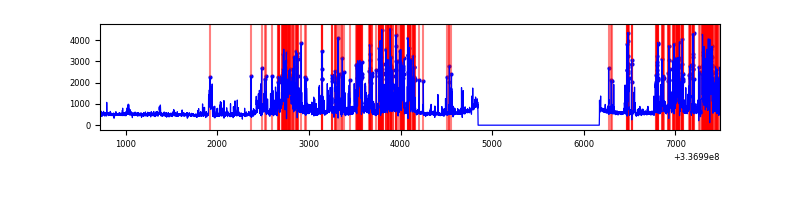 |
Top three noisy pixels from each quadrant. If the there are fewer than three noisy pixels in the level2.evt file, extra rows are filled as -1
| Pixel properties | Quadrant properties | ||||||
|---|---|---|---|---|---|---|---|
| Quadrant | DetID | PixID | Counts | Sigma | Mean | Median | Sigma |
| A | 0 | 13 | 75642 | 489.2 | 763 | 751 | 153.1 |
| A | 2 | 79 | 45688 | 293.54 | 763 | 751 | 153.1 |
| A | 13 | 254 | 8527 | 50.79 | 763 | 751 | 153.1 |
| B | 14 | 207 | 54856 | 380.75 | 748 | 734 | 142.1 |
| B | 0 | 189 | 30469 | 209.18 | 748 | 734 | 142.1 |
| B | 12 | 111 | 15914 | 106.79 | 748 | 734 | 142.1 |
| C | 14 | 238 | 118314 | 703.03 | 719 | 728 | 167.3 |
| C | 15 | 208 | 60033 | 354.58 | 719 | 728 | 167.3 |
| C | 3 | 233 | 10466 | 58.22 | 719 | 728 | 167.3 |
| D | 7 | 80 | 1805515 | 9448.08 | 704 | 690 | 191.0 |
| D | 1 | 52 | 125554 | 653.65 | 704 | 690 | 191.0 |
| D | 2 | 250 | 92208 | 479.09 | 704 | 690 | 191.0 |
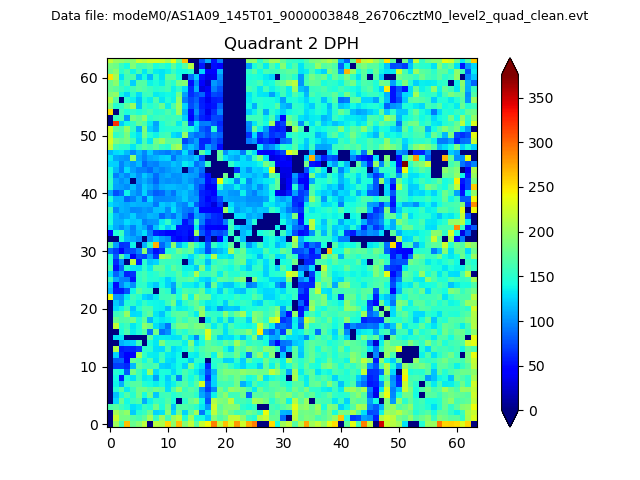
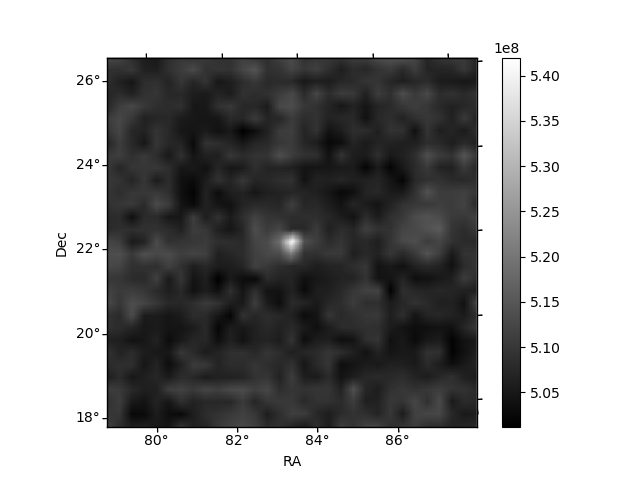
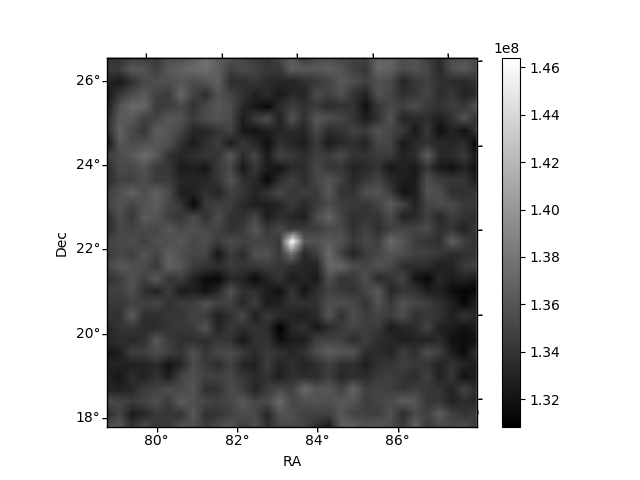
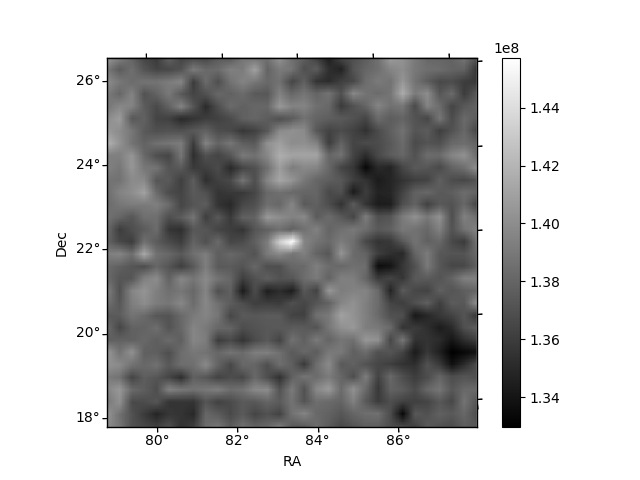
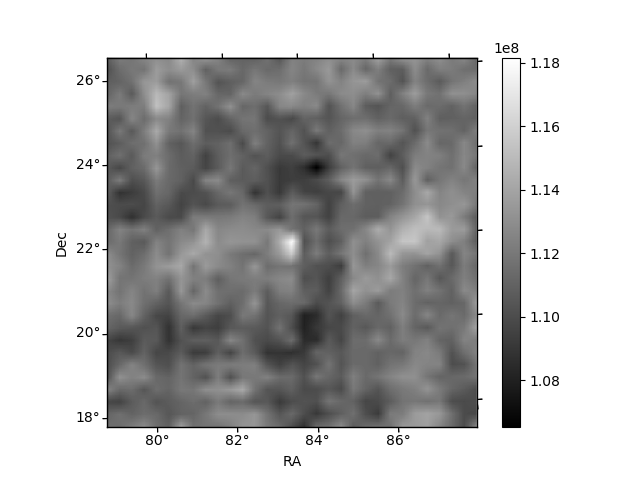
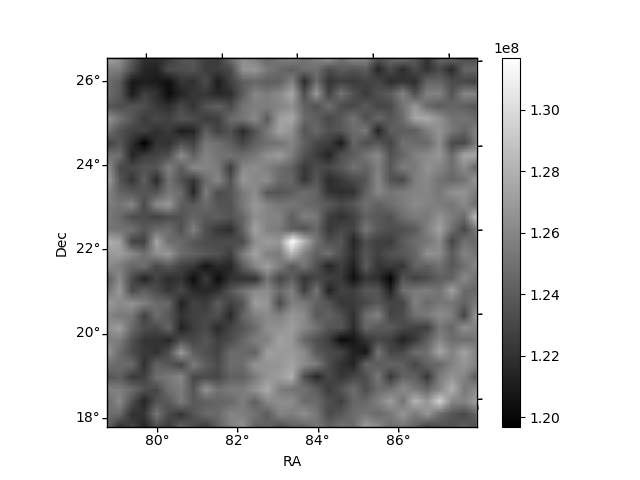
Histogram calculated using DETX and DETY for each event in the final _common_clean file
| Quadrant A | 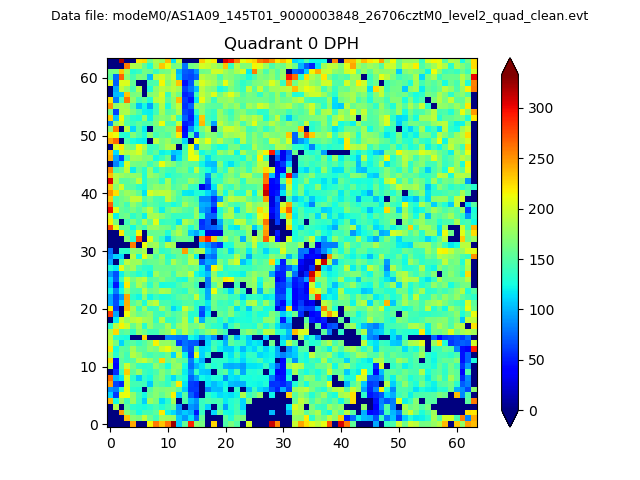 |
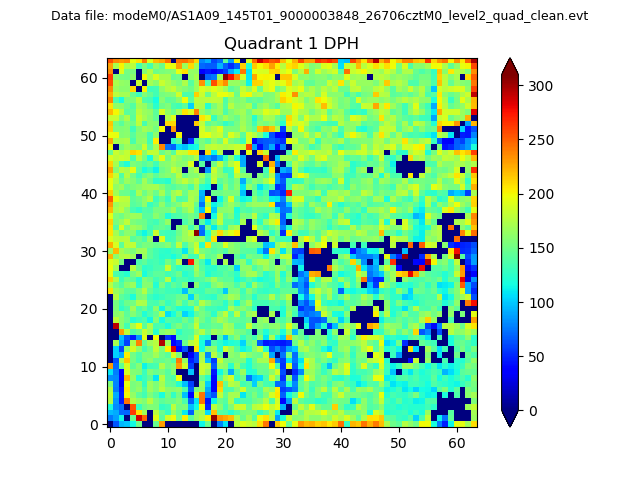 |
Quadrant B |
|---|---|---|---|
| Quadrant D | 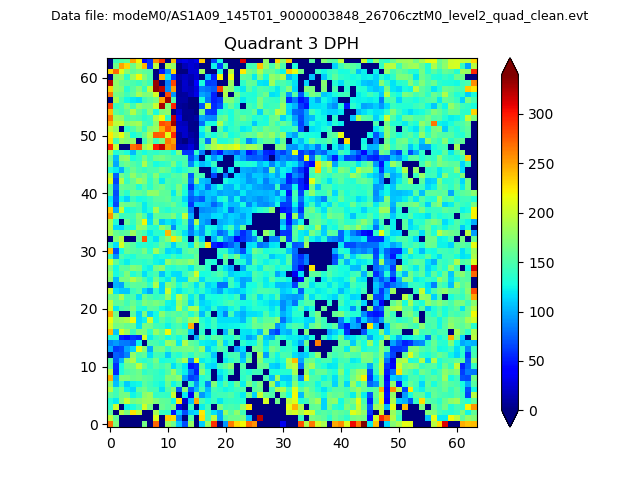 |
 |
Quadrant C |
| Plot type | Count rate plots | Images |
|---|---|---|
| Comparison with Poisson distribution Blue bars denote a histogram of data divided into 1 sec bins. Red curve is a Poisson curve with rate = median count rate of data. |
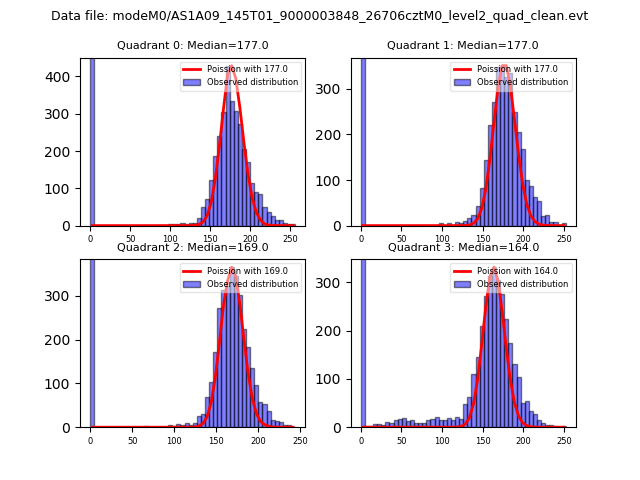 |
 |
| Quadrant-wise count rates Data is divided into 100 sec bins |
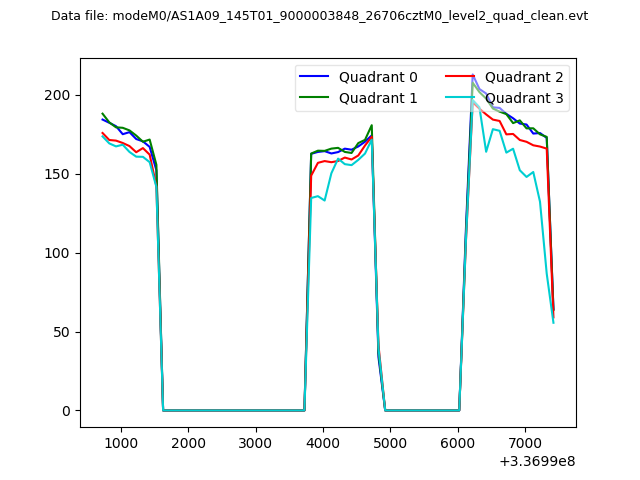 |
|
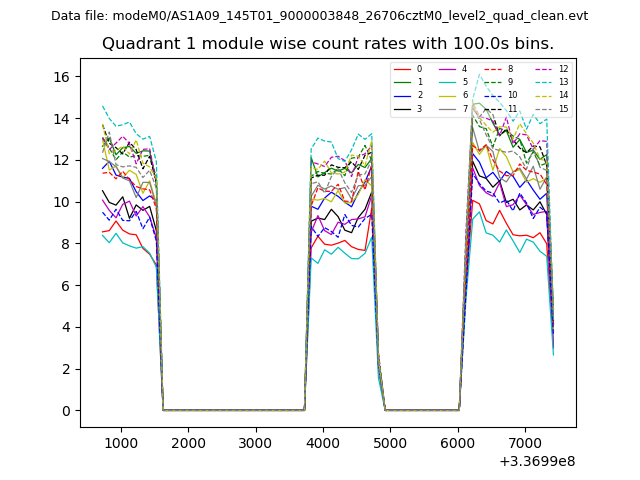
| Module-wise count rates for Quadrant A Data is divided into 100 sec bins |
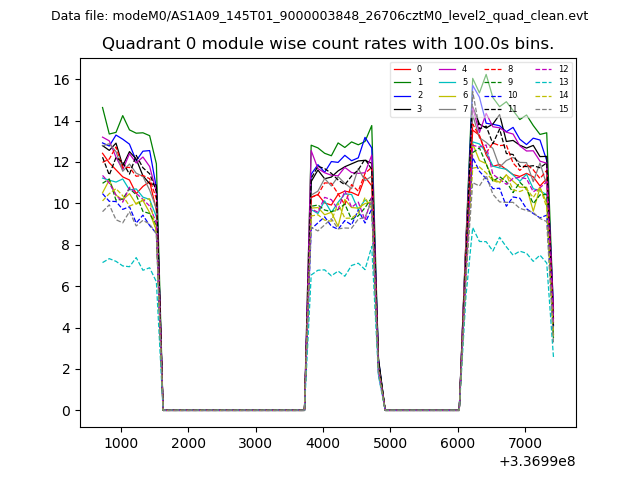 |
 |
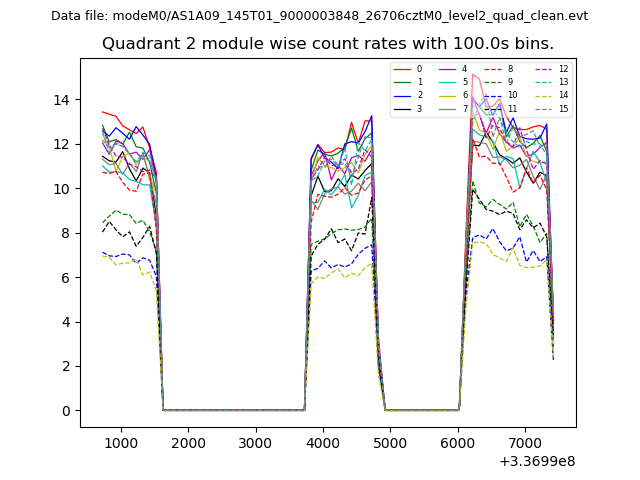
| Module-wise count rates for Quadrant B Data is divided into 100 sec bins |
 |
 |
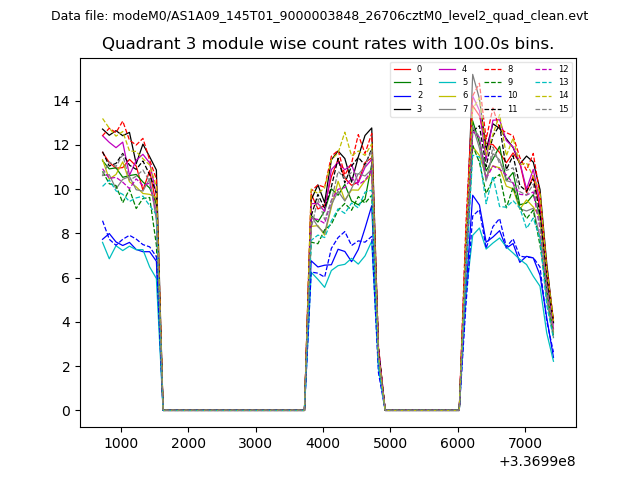
| Module-wise count rates for Quadrant C Data is divided into 100 sec bins |
 |
 |
| Module-wise count rates for Quadrant D Data is divided into 100 sec bins |
 |
 |
| Parameter | Plot |
|---|---|
| CZT HV Monitor | 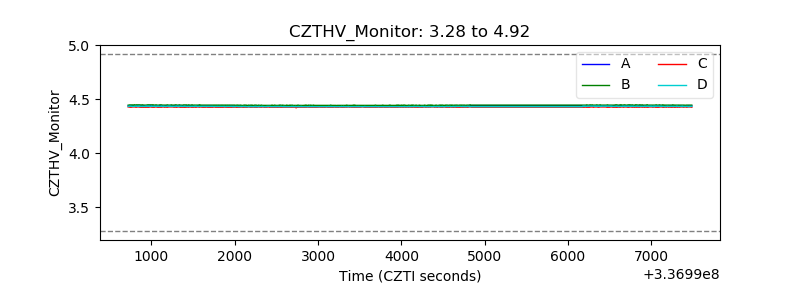 |
| D_VDD | 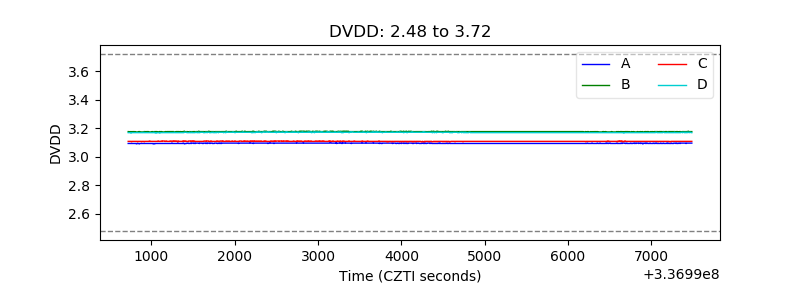 |
| Temperature 1 | 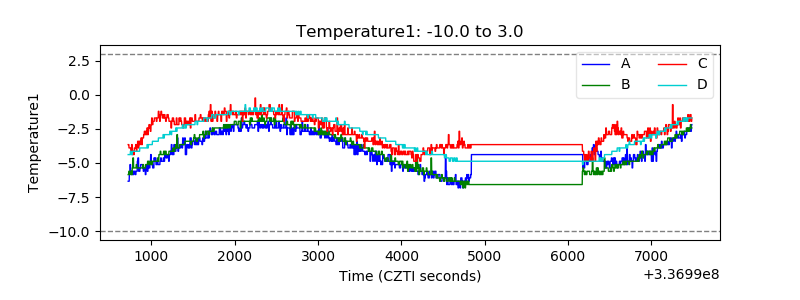 |
| Veto HV Monitor | 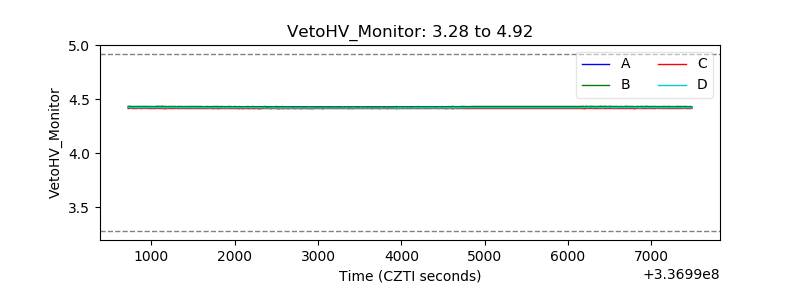 |
| Veto LLD | 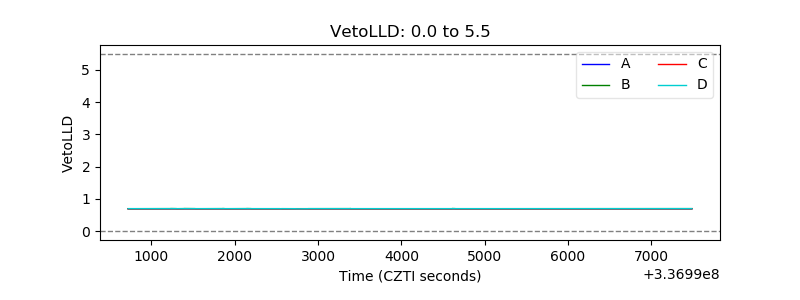 |
| Alpha Counter | 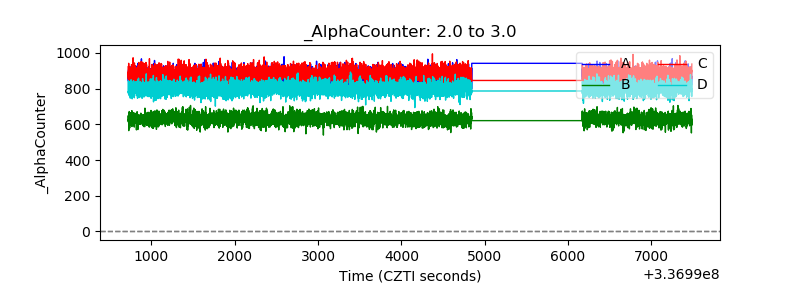 |
| _CPM_Rate | 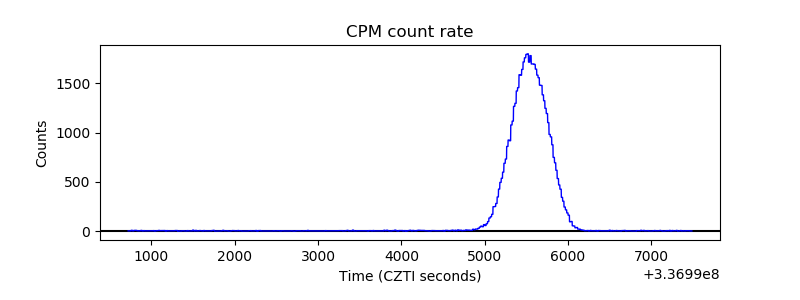 |
| CZT Counter | 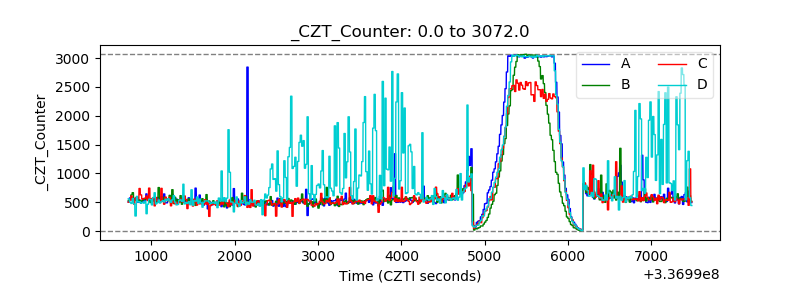 |
| +2.5 Volts monitor | 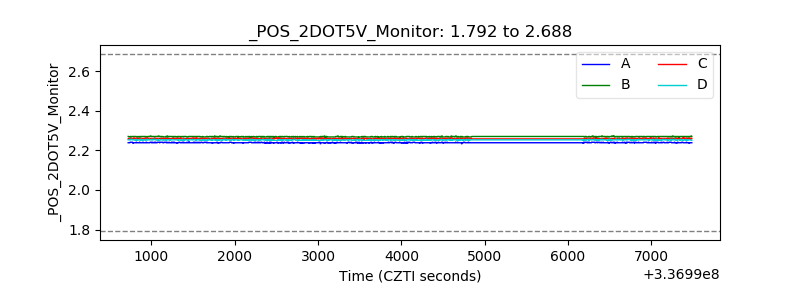 |
| +5 Volts monitor |  |
| _ROLL_ROT |  |
| _Roll_DEC | 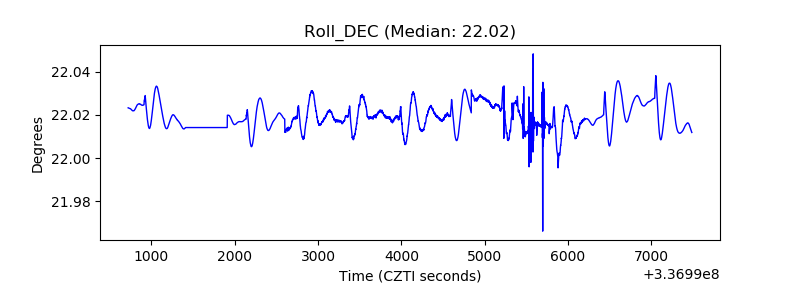 |
| _Roll_RA | 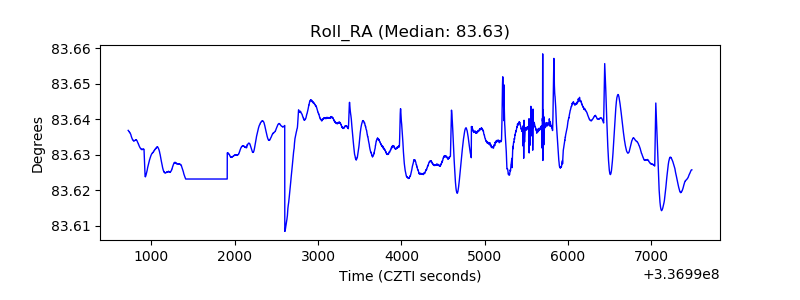 |
| Veto Counter |  |