| Param | Original file | Final file |
|---|---|---|
| Filename | modeM0/AS1A09_145T01_9000003848_26708cztM0_level2.evt | modeM0/AS1A09_145T01_9000003848_26708cztM0_level2_quad_clean.evt |
| Size (bytes) | 573,943,680 | 74,116,800 |
| Size | 547.4 MB | 70.7 MB |
| Events in quadrant A | 3,273,509 | 468,320 |
| Events in quadrant B | 3,446,729 | 468,396 |
| Events in quadrant C | 3,924,134 | 445,692 |
| Events in quadrant D | 6,315,431 | 426,460 |
| Mode M0 | |||
|---|---|---|---|
| Quadrant | BADHDUFLAG | Total packets | Discarded packets |
| A | 0 | 13250 | 0 |
| B | 0 | 13819 | 0 |
| C | 0 | 15566 | 0 |
| D | 0 | 23018 | 0 |
| Mode M9 | |||
|---|---|---|---|
| Quadrant | BADHDUFLAG | Total packets | Discarded packets |
| A | 0 | 10 | 0 |
| B | 0 | 10 | 0 |
| C | 0 | 10 | 0 |
| D | 0 | 10 | 0 |
| Quadrant | Total seconds | Saturated seconds | Saturation percentage |
|---|---|---|---|
| A | 6230 | 65 | 1.043339% |
| B | 6230 | 84 | 1.348315% |
| C | 6230 | 158 | 2.536116% |
| D | 6230 | 809 | 12.985554% |
Noise dominated data is calculated using 1-second bins in cleaned event files. If a bin has >2000 counts, and if more than 50% of those come from <1% of pixels, then it is considered to be noise-dominated and hence unusable.
| Quadrant | # 1 sec bins | Bins with >0 counts | Bins with >2000 counts | High rate bins dominated by noise | Noise dominated (total time) | Noise dominated (detector-on time) | Marked lightcurve |
|---|---|---|---|---|---|---|---|
| A | 7300 | 6231 | 1 | 1 | 0.01% | 0.02% | 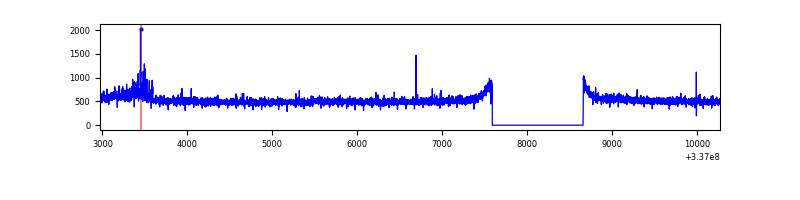 |
| B | 7300 | 6231 | 7 | 7 | 0.10% | 0.11% | 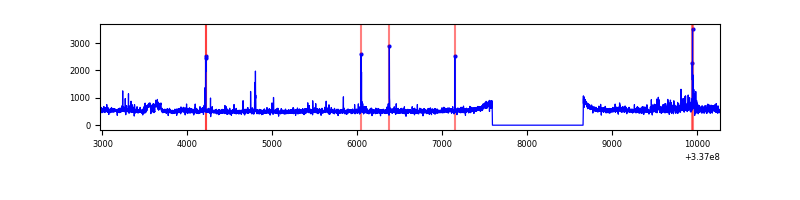 |
| C | 7300 | 6231 | 35 | 35 | 0.48% | 0.56% | 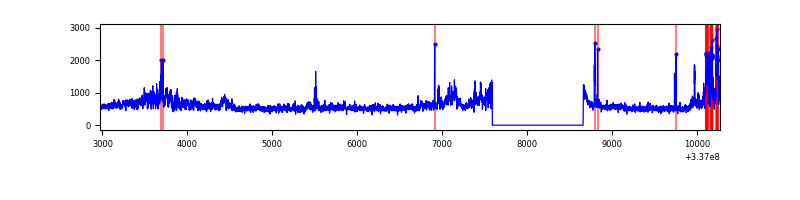 |
| D | 7300 | 6231 | 586 | 586 | 8.03% | 9.40% | 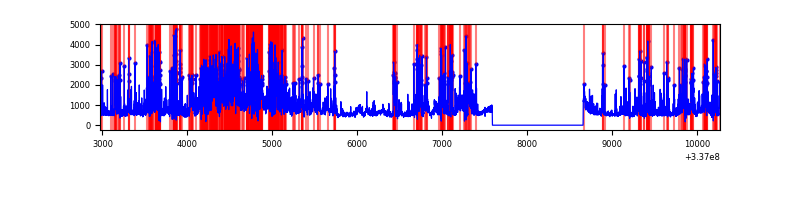 |
Top three noisy pixels from each quadrant. If the there are fewer than three noisy pixels in the level2.evt file, extra rows are filled as -1
| Pixel properties | Quadrant properties | ||||||
|---|---|---|---|---|---|---|---|
| Quadrant | DetID | PixID | Counts | Sigma | Mean | Median | Sigma |
| A | 0 | 13 | 69138 | 413.04 | 829 | 815 | 165.4 |
| A | 13 | 254 | 11068 | 61.98 | 829 | 815 | 165.4 |
| A | 3 | 137 | 7326 | 39.36 | 829 | 815 | 165.4 |
| B | 0 | 189 | 102562 | 661.91 | 813 | 798 | 153.7 |
| B | 3 | 112 | 51203 | 327.85 | 813 | 798 | 153.7 |
| B | 4 | 200 | 30135 | 190.82 | 813 | 798 | 153.7 |
| C | 3 | 233 | 704236 | 3890.6 | 780 | 787 | 180.8 |
| C | 14 | 238 | 125911 | 692.03 | 780 | 787 | 180.8 |
| C | 15 | 208 | 29934 | 161.2 | 780 | 787 | 180.8 |
| D | 7 | 80 | 2448581 | 13119.59 | 764 | 742 | 186.6 |
| D | 1 | 52 | 816443 | 4371.88 | 764 | 742 | 186.6 |
| D | 2 | 250 | 102546 | 545.64 | 764 | 742 | 186.6 |
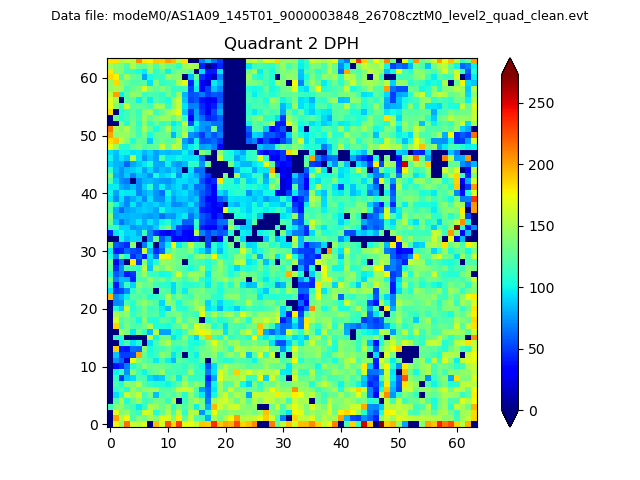
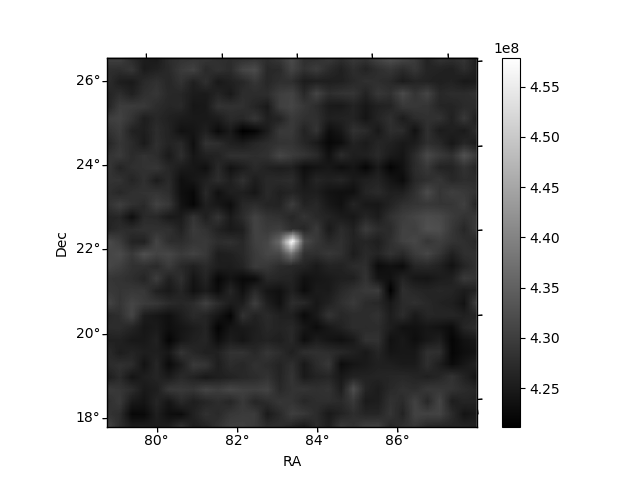
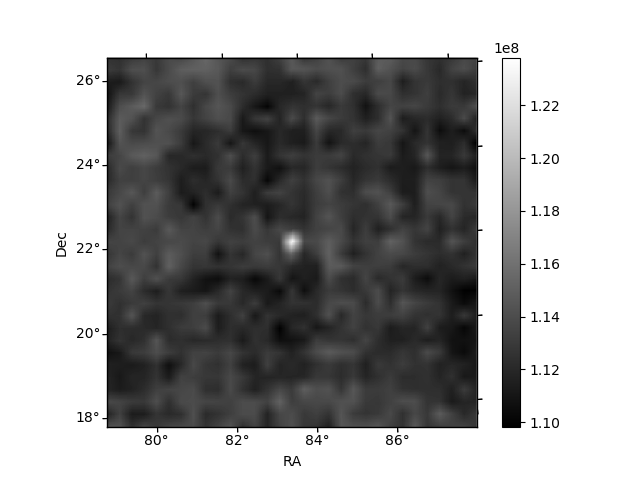
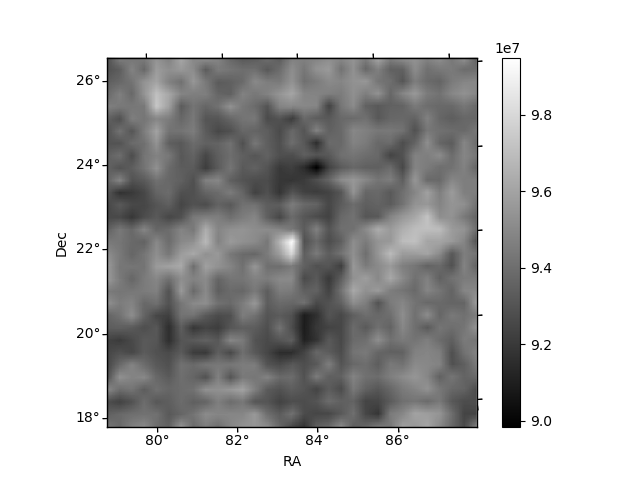
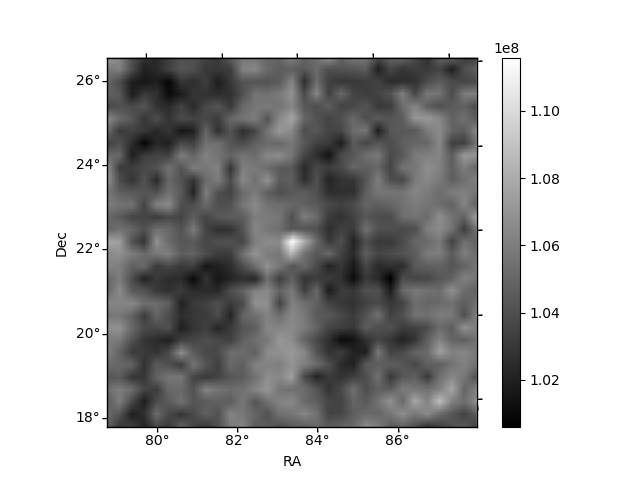
Histogram calculated using DETX and DETY for each event in the final _common_clean file
| Quadrant A | 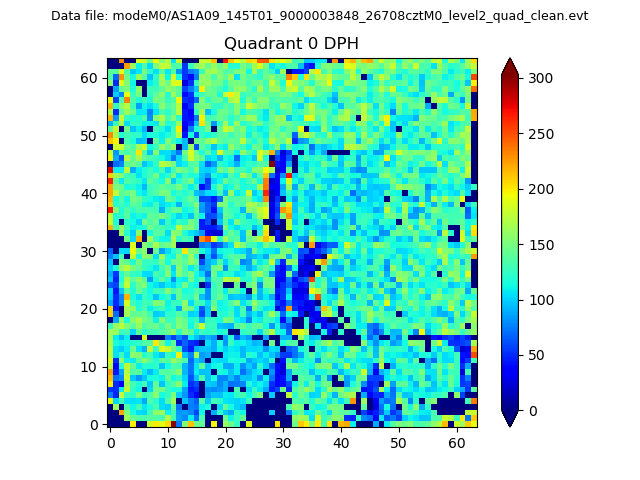 |
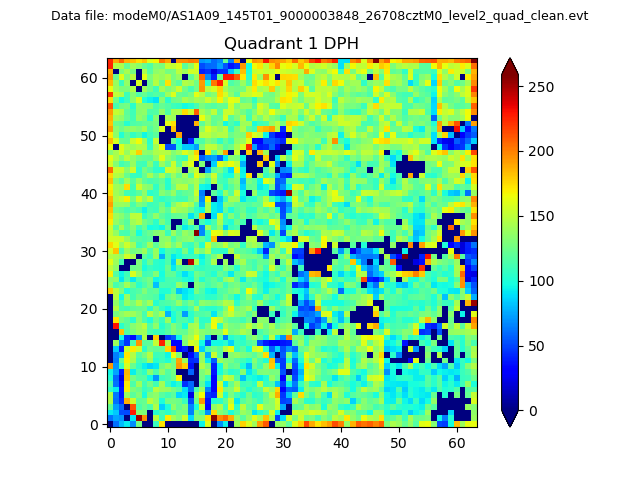 |
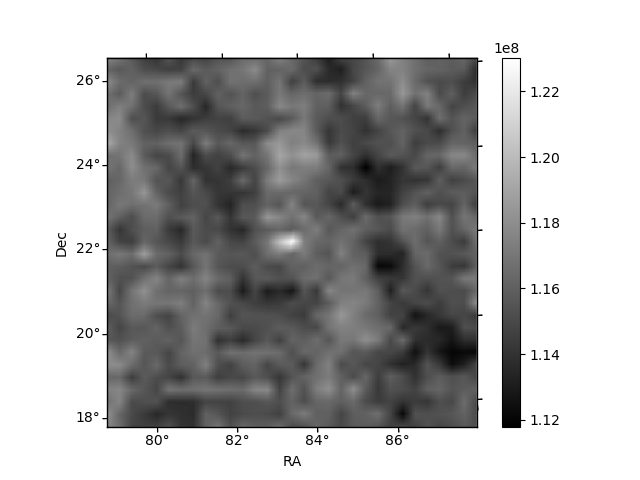
Quadrant B |
|---|---|---|---|
| Quadrant D | 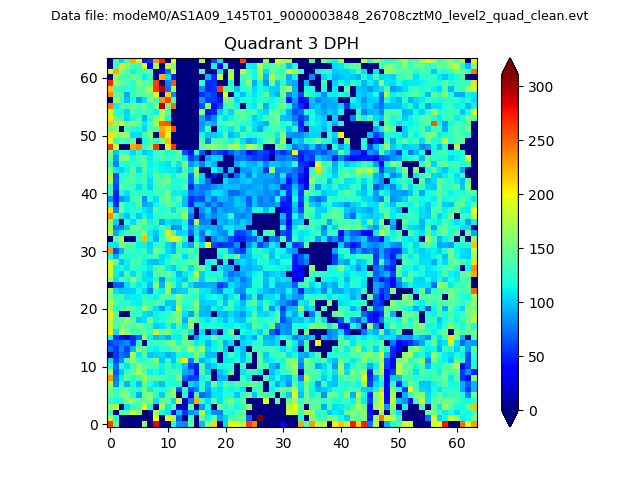 |
 |
Quadrant C |
| Plot type | Count rate plots | Images |
|---|---|---|
| Comparison with Poisson distribution Blue bars denote a histogram of data divided into 1 sec bins. Red curve is a Poisson curve with rate = median count rate of data. |
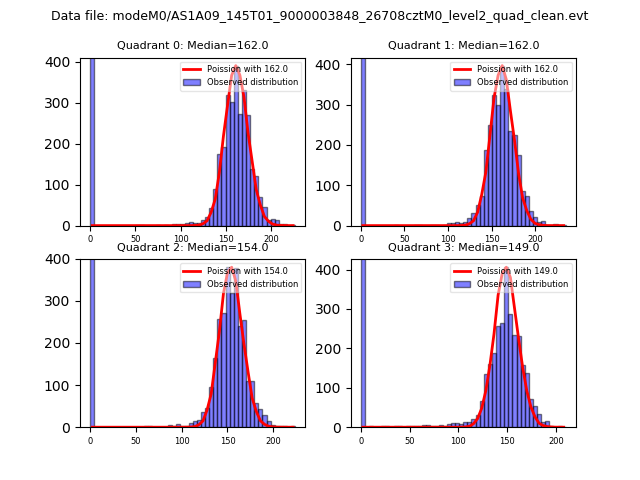 |
 |
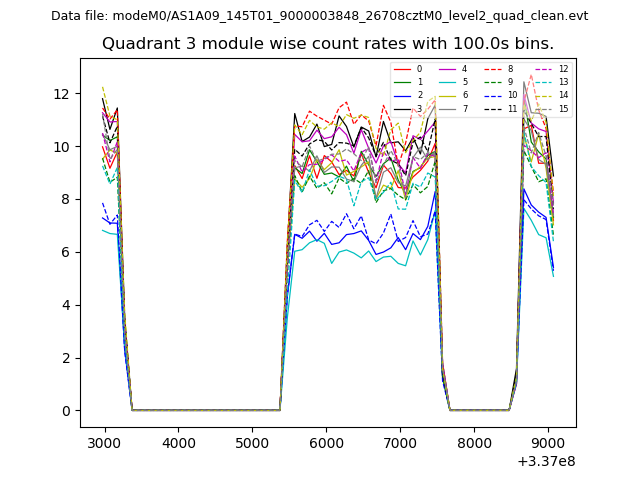
| Quadrant-wise count rates Data is divided into 100 sec bins |
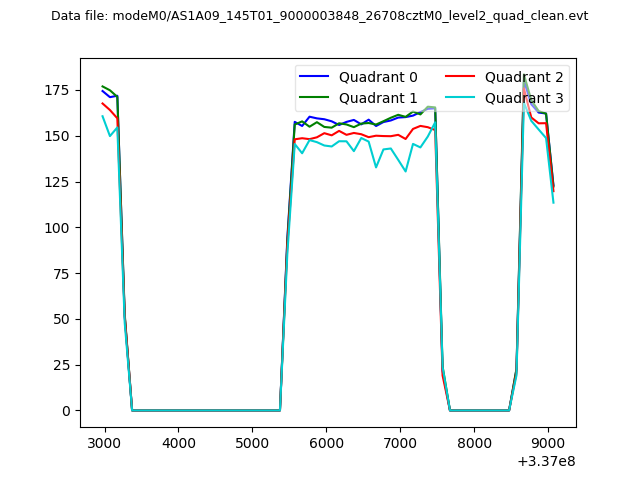 |
|
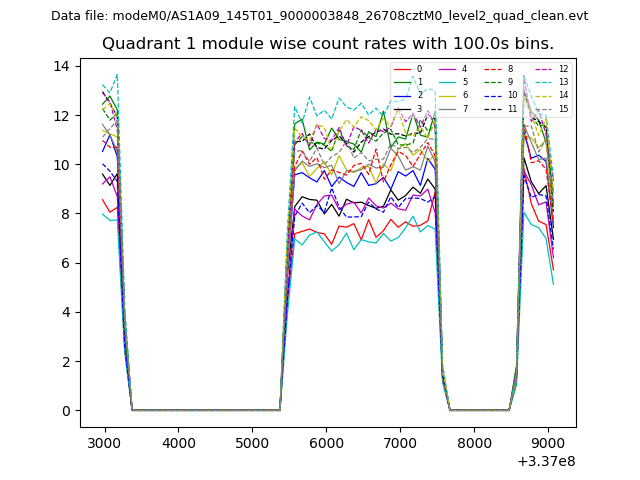
| Module-wise count rates for Quadrant A Data is divided into 100 sec bins |
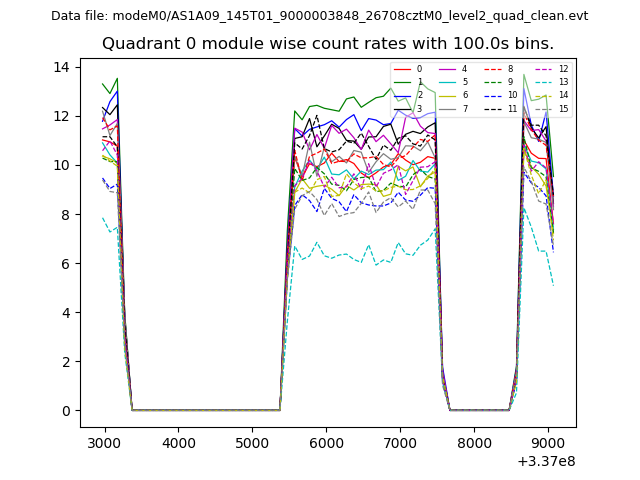 |
 |
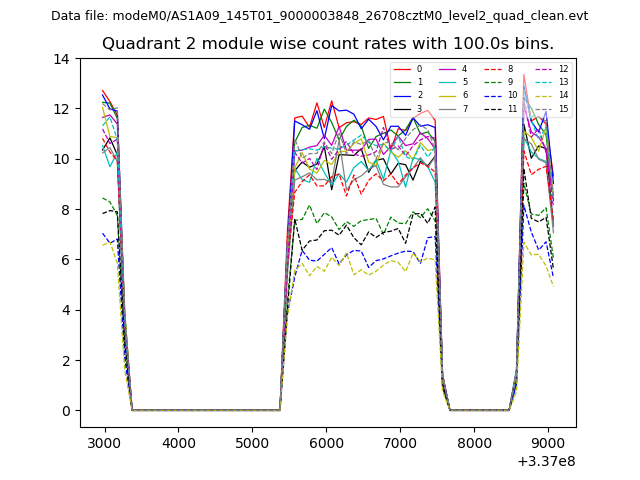
| Module-wise count rates for Quadrant B Data is divided into 100 sec bins |
 |
 |
| Module-wise count rates for Quadrant C Data is divided into 100 sec bins |
 |
 |
| Module-wise count rates for Quadrant D Data is divided into 100 sec bins |
 |
 |
| Parameter | Plot |
|---|---|
| CZT HV Monitor | 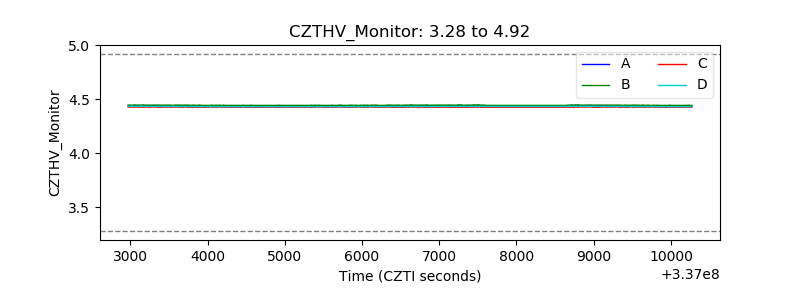 |
| D_VDD | 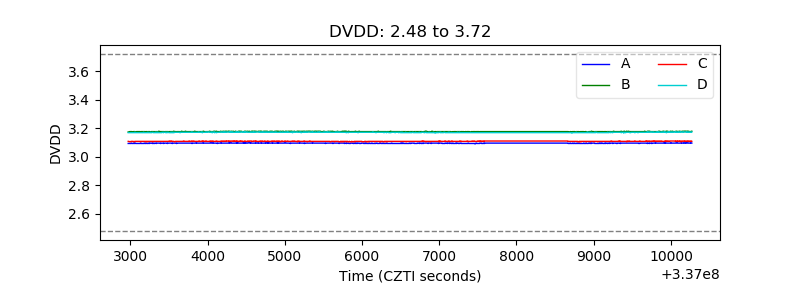 |
| Temperature 1 | 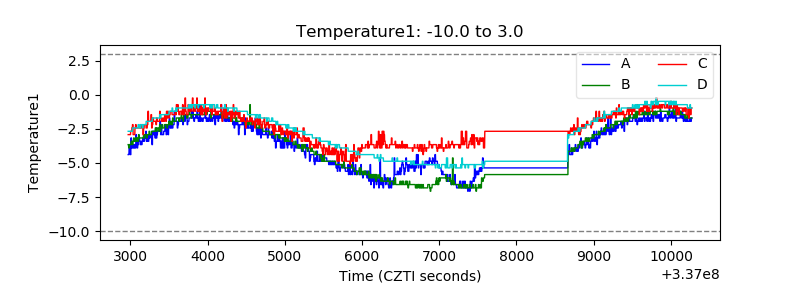 |
| Veto HV Monitor | 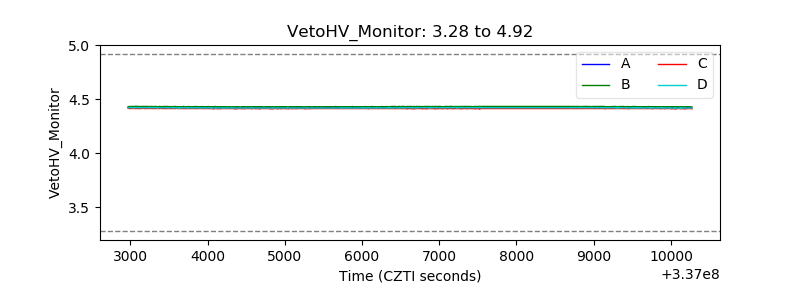 |
| Veto LLD | 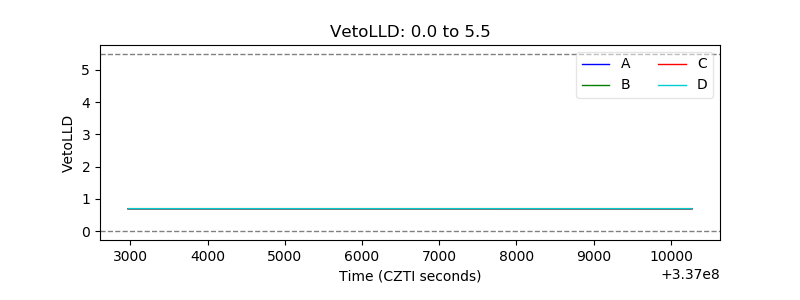 |
| Alpha Counter | 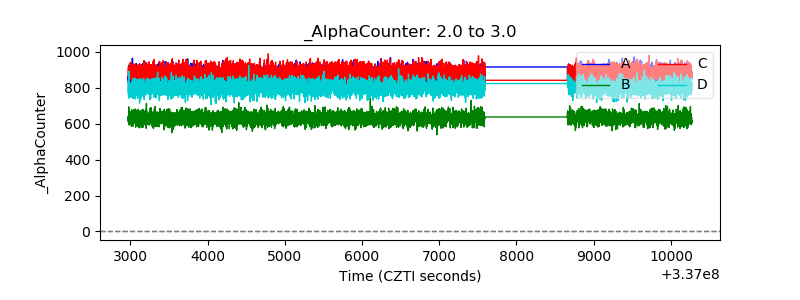 |
| _CPM_Rate | 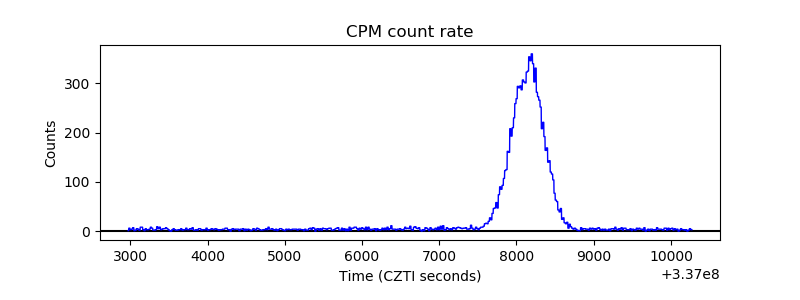 |
| CZT Counter | 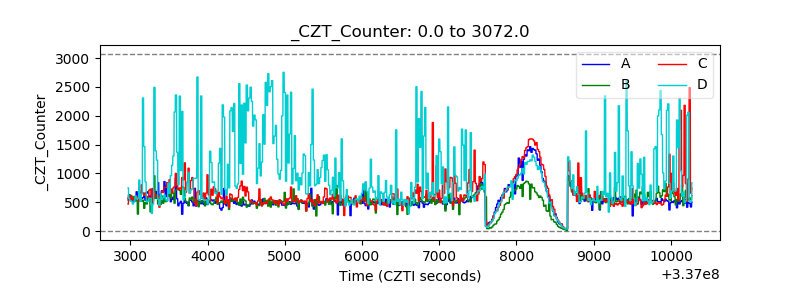 |
| +2.5 Volts monitor | 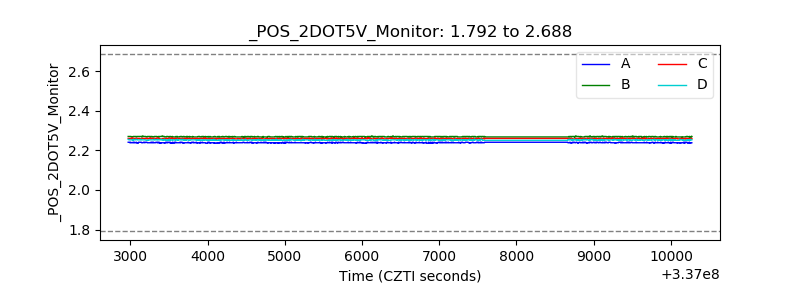 |
| +5 Volts monitor | 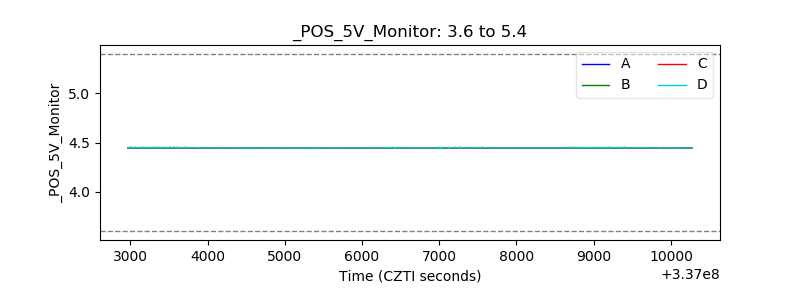 |
| _ROLL_ROT |  |
| _Roll_DEC | 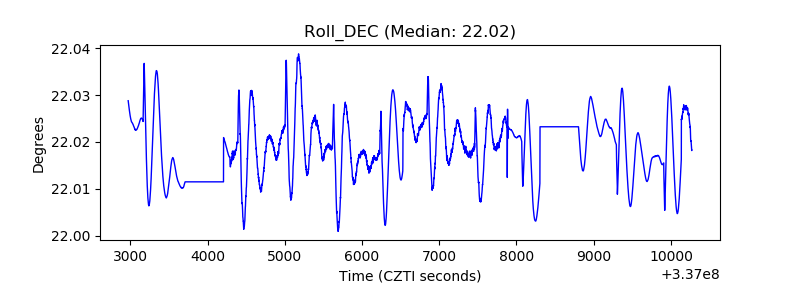 |
| _Roll_RA | 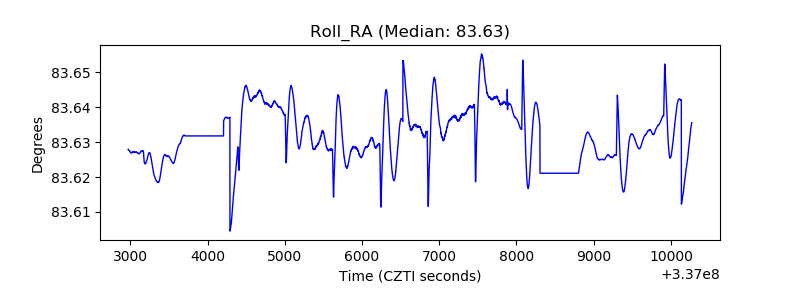 |
| Veto Counter | 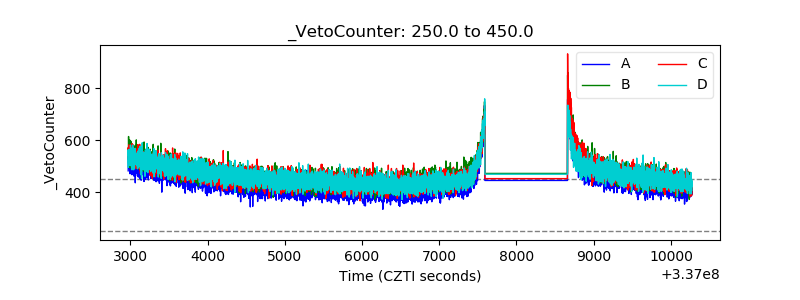 |