| Param | Original file | Final file |
|---|---|---|
| Filename | modeM0/AS1A09_145T01_9000003848_26709cztM0_level2.evt | modeM0/AS1A09_145T01_9000003848_26709cztM0_level2_quad_clean.evt |
| Size (bytes) | 626,008,320 | 79,980,480 |
| Size | 597.0 MB | 76.3 MB |
| Events in quadrant A | 3,582,428 | 500,794 |
| Events in quadrant B | 3,835,570 | 503,667 |
| Events in quadrant C | 4,570,866 | 481,051 |
| Events in quadrant D | 6,494,633 | 446,913 |
| Mode M0 | |||
|---|---|---|---|
| Quadrant | BADHDUFLAG | Total packets | Discarded packets |
| A | 0 | 14672 | 0 |
| B | 0 | 15554 | 0 |
| C | 0 | 17951 | 0 |
| D | 0 | 24195 | 0 |
| Mode M9 | |||
|---|---|---|---|
| Quadrant | BADHDUFLAG | Total packets | Discarded packets |
| A | 0 | 7 | 0 |
| B | 0 | 7 | 0 |
| C | 0 | 7 | 0 |
| D | 0 | 7 | 0 |
| Quadrant | Total seconds | Saturated seconds | Saturation percentage |
|---|---|---|---|
| A | 7025 | 95 | 1.352313% |
| B | 7026 | 100 | 1.423285% |
| C | 7026 | 243 | 3.458582% |
| D | 7026 | 666 | 9.479078% |
Noise dominated data is calculated using 1-second bins in cleaned event files. If a bin has >2000 counts, and if more than 50% of those come from <1% of pixels, then it is considered to be noise-dominated and hence unusable.
| Quadrant | # 1 sec bins | Bins with >0 counts | Bins with >2000 counts | High rate bins dominated by noise | Noise dominated (total time) | Noise dominated (detector-on time) | Marked lightcurve |
|---|---|---|---|---|---|---|---|
| A | 7735 | 7026 | 4 | 4 | 0.05% | 0.06% | 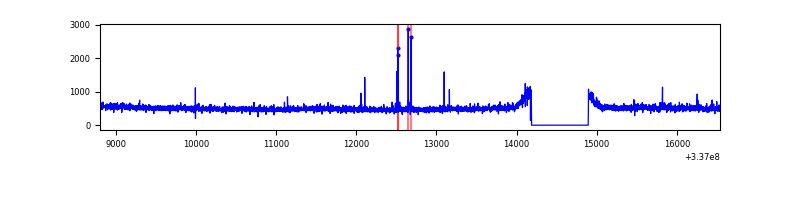 |
| B | 7736 | 7027 | 3 | 3 | 0.04% | 0.04% | 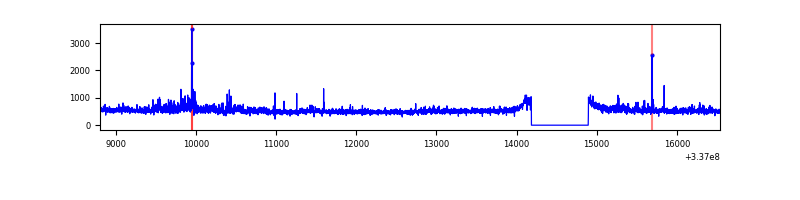 |
| C | 7736 | 7027 | 34 | 34 | 0.44% | 0.48% | 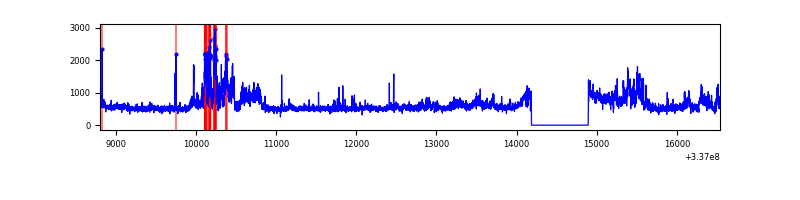 |
| D | 7736 | 7027 | 504 | 504 | 6.51% | 7.17% | 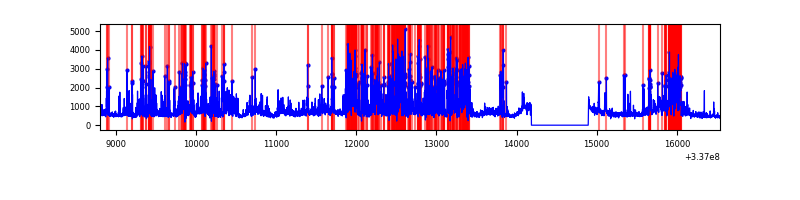 |
Top three noisy pixels from each quadrant. If the there are fewer than three noisy pixels in the level2.evt file, extra rows are filled as -1
| Pixel properties | Quadrant properties | ||||||
|---|---|---|---|---|---|---|---|
| Quadrant | DetID | PixID | Counts | Sigma | Mean | Median | Sigma |
| A | 0 | 13 | 28185 | 148.5 | 912 | 896 | 183.8 |
| A | 12 | 96 | 25163 | 132.06 | 912 | 896 | 183.8 |
| A | 13 | 254 | 12438 | 62.81 | 912 | 896 | 183.8 |
| B | 0 | 189 | 224186 | 1287.54 | 900 | 880 | 173.4 |
| B | 5 | 172 | 30058 | 168.24 | 900 | 880 | 173.4 |
| B | 3 | 112 | 26326 | 146.72 | 900 | 880 | 173.4 |
| C | 3 | 233 | 1018308 | 5030.24 | 862 | 869 | 202.3 |
| C | 14 | 238 | 139064 | 683.24 | 862 | 869 | 202.3 |
| C | 15 | 208 | 23547 | 112.12 | 862 | 869 | 202.3 |
| D | 7 | 80 | 2149036 | 10196.72 | 859 | 836 | 210.7 |
| D | 1 | 52 | 887003 | 4206.31 | 859 | 836 | 210.7 |
| D | 2 | 250 | 136123 | 642.16 | 859 | 836 | 210.7 |
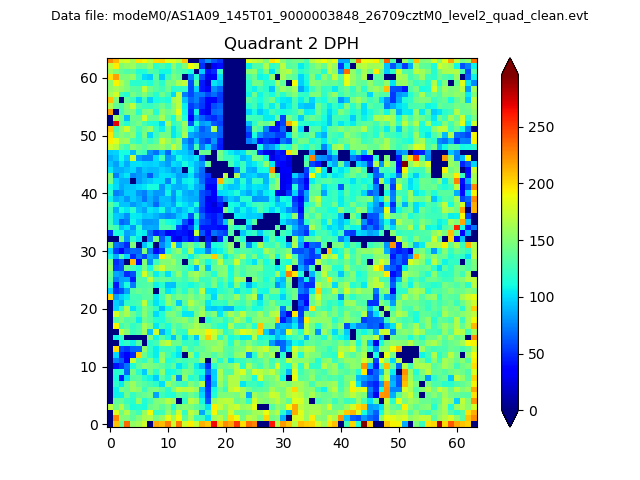
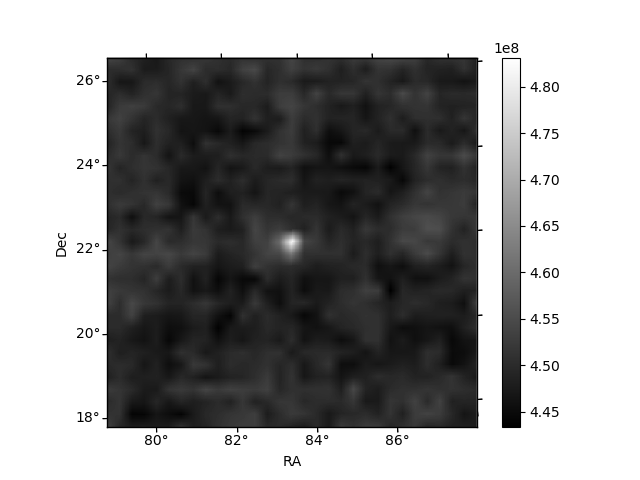
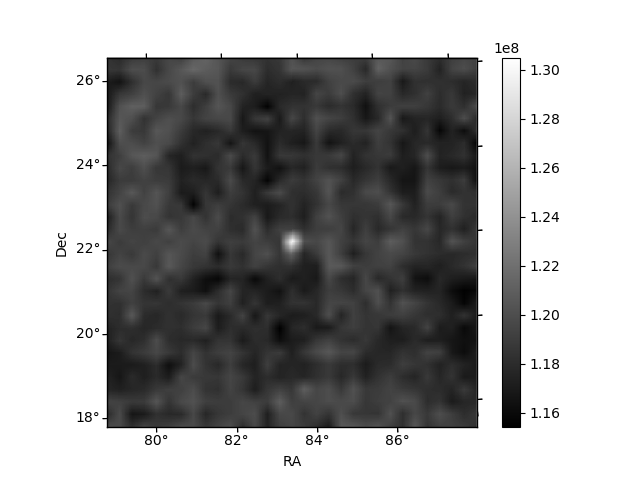
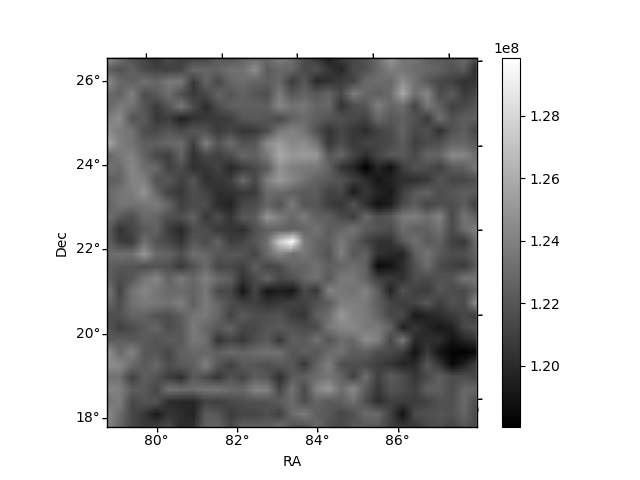
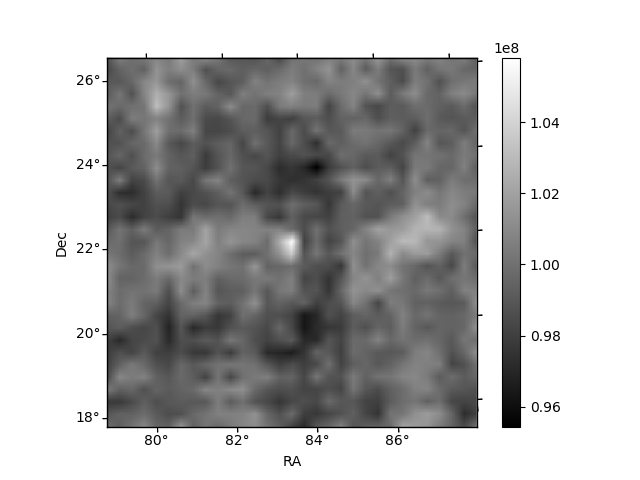
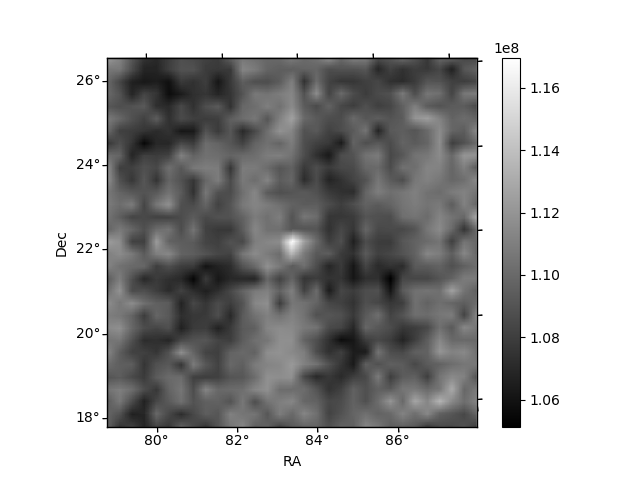
Histogram calculated using DETX and DETY for each event in the final _common_clean file
| Quadrant A | 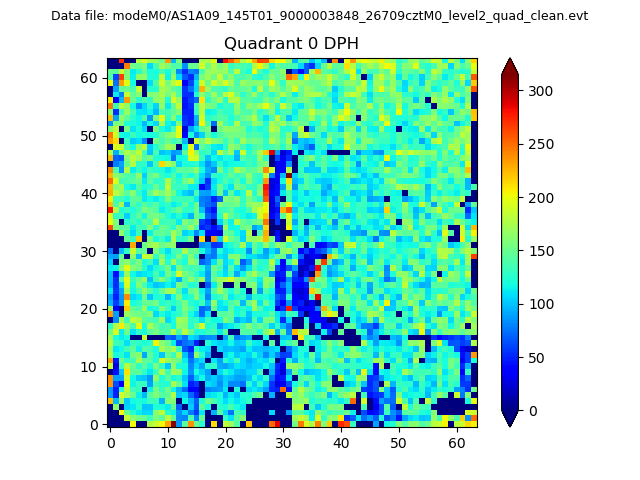 |
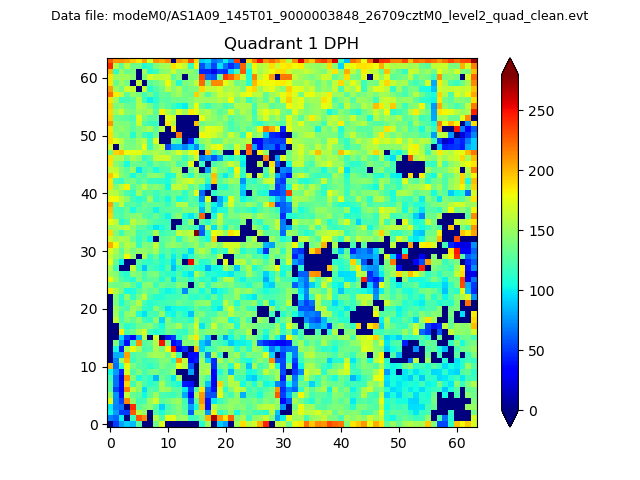 |
Quadrant B |
|---|---|---|---|
| Quadrant D | 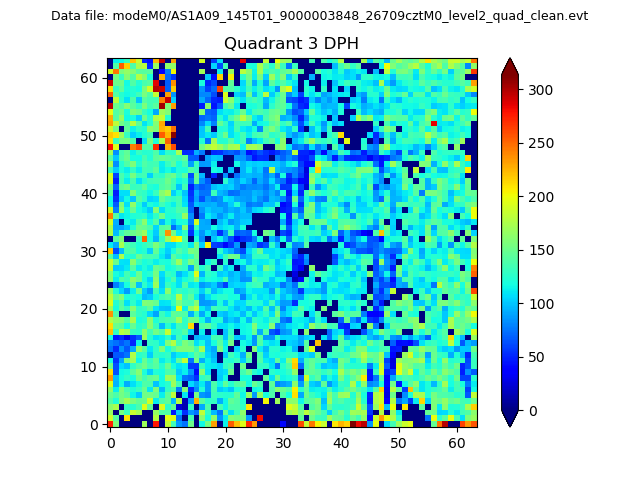 |
 |
Quadrant C |
| Plot type | Count rate plots | Images |
|---|---|---|
| Comparison with Poisson distribution Blue bars denote a histogram of data divided into 1 sec bins. Red curve is a Poisson curve with rate = median count rate of data. |
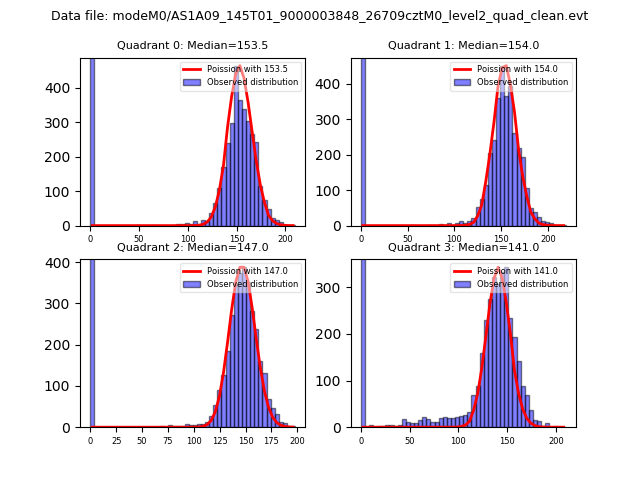 |
 |
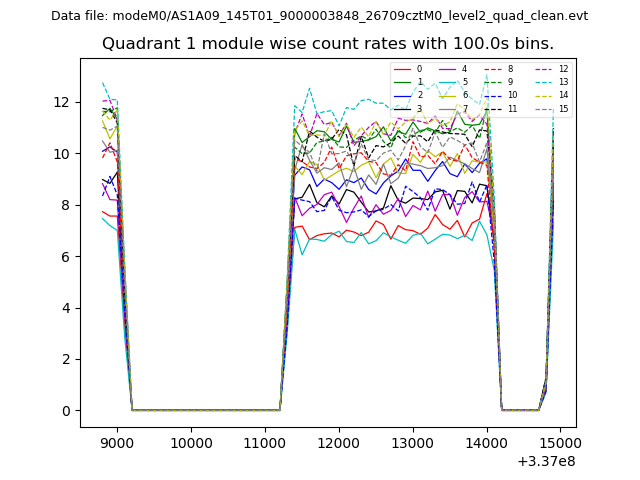
| Quadrant-wise count rates Data is divided into 100 sec bins |
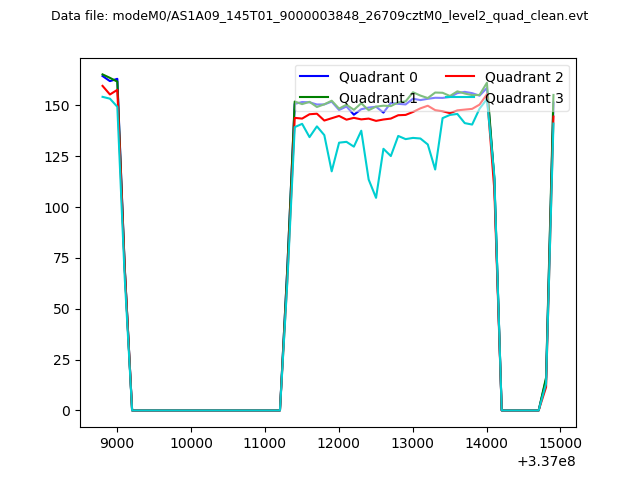 |
|
| Module-wise count rates for Quadrant A Data is divided into 100 sec bins |
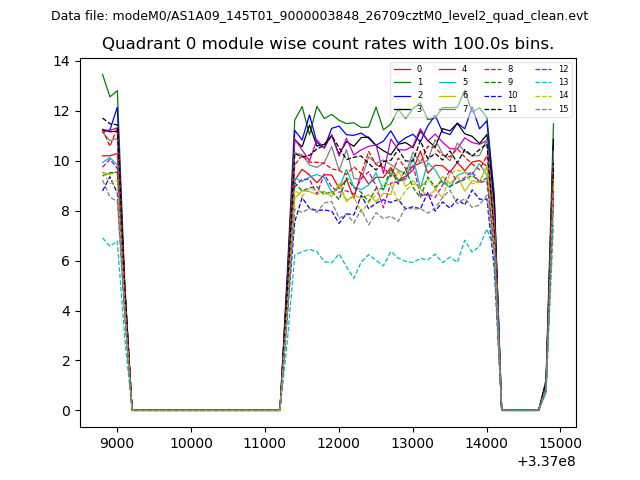 |
 |
| Module-wise count rates for Quadrant B Data is divided into 100 sec bins |
 |
 |
| Module-wise count rates for Quadrant C Data is divided into 100 sec bins |
 |
 |
| Module-wise count rates for Quadrant D Data is divided into 100 sec bins |
 |
 |
| Parameter | Plot |
|---|---|
| CZT HV Monitor | 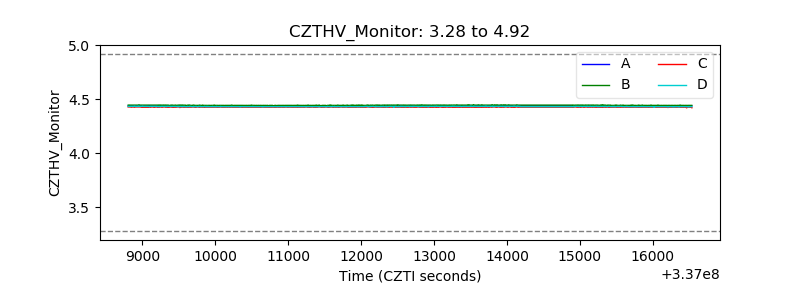 |
| D_VDD | 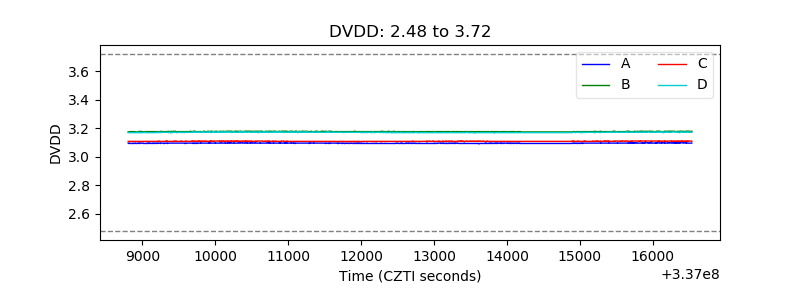 |
| Temperature 1 | 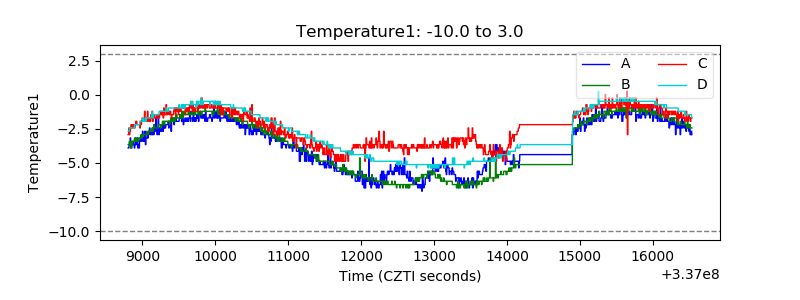 |
| Veto HV Monitor | 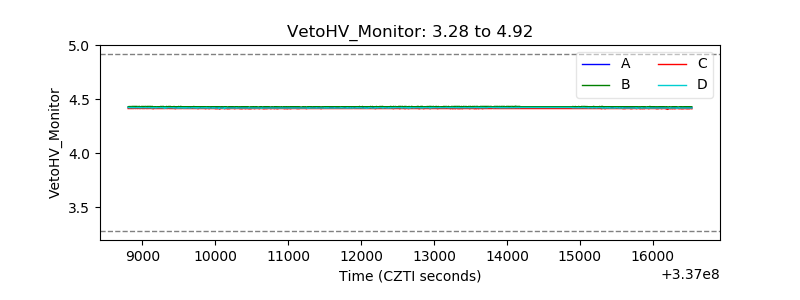 |
| Veto LLD | 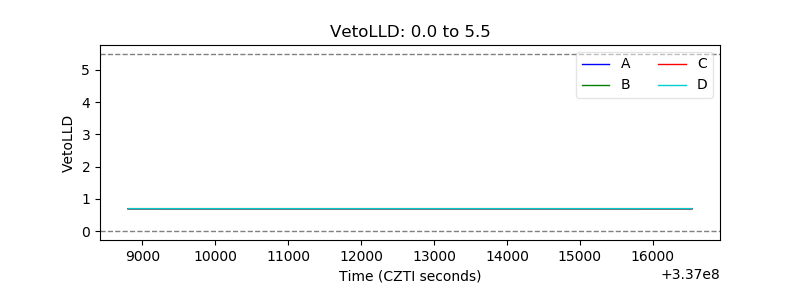 |
| Alpha Counter |  |
| _CPM_Rate | 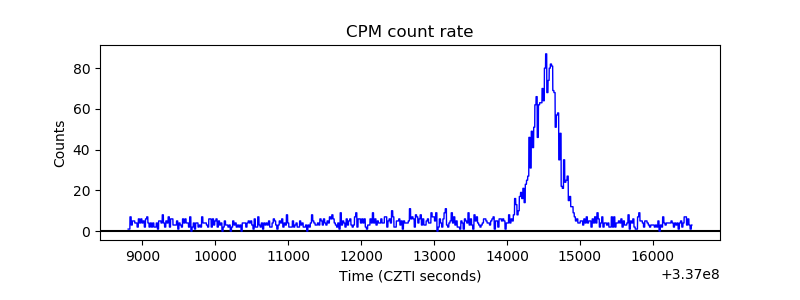 |
| CZT Counter | 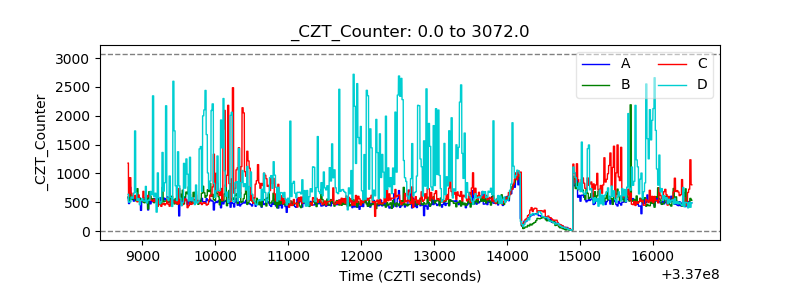 |
| +2.5 Volts monitor | 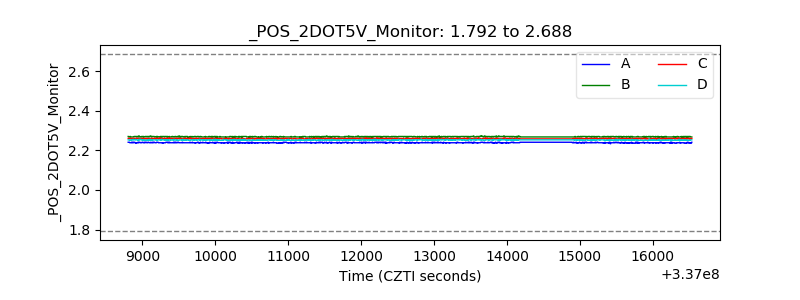 |
| +5 Volts monitor |  |
| _ROLL_ROT |  |
| _Roll_DEC | 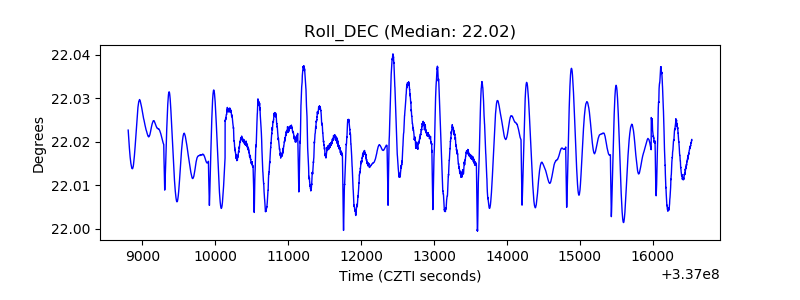 |
| _Roll_RA | 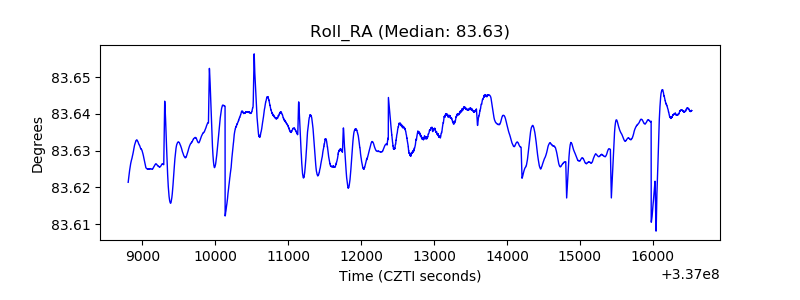 |
| Veto Counter |  |