| Param | Original file | Final file |
|---|---|---|
| Filename | modeM0/AS1A09_145T01_9000003848_26710cztM0_level2.evt | modeM0/AS1A09_145T01_9000003848_26710cztM0_level2_quad_clean.evt |
| Size (bytes) | 589,144,320 | 86,878,080 |
| Size | 561.9 MB | 82.9 MB |
| Events in quadrant A | 3,805,565 | 542,068 |
| Events in quadrant B | 3,983,575 | 543,514 |
| Events in quadrant C | 4,505,655 | 521,079 |
| Events in quadrant D | 5,046,591 | 510,006 |
| Mode M0 | |||
|---|---|---|---|
| Quadrant | BADHDUFLAG | Total packets | Discarded packets |
| A | 0 | 15711 | 0 |
| B | 0 | 16316 | 0 |
| C | 0 | 17957 | 0 |
| D | 0 | 19837 | 0 |
| Mode M9 | |||
|---|---|---|---|
| Quadrant | BADHDUFLAG | Total packets | Discarded packets |
| A | 0 | 8 | 0 |
| B | 0 | 9 | 0 |
| C | 0 | 9 | 0 |
| D | 0 | 9 | 0 |
| Quadrant | Total seconds | Saturated seconds | Saturation percentage |
|---|---|---|---|
| A | 7394 | 117 | 1.582364% |
| B | 7394 | 137 | 1.852854% |
| C | 7394 | 281 | 3.800379% |
| D | 7394 | 450 | 6.086016% |
Noise dominated data is calculated using 1-second bins in cleaned event files. If a bin has >2000 counts, and if more than 50% of those come from <1% of pixels, then it is considered to be noise-dominated and hence unusable.
| Quadrant | # 1 sec bins | Bins with >0 counts | Bins with >2000 counts | High rate bins dominated by noise | Noise dominated (total time) | Noise dominated (detector-on time) | Marked lightcurve |
|---|---|---|---|---|---|---|---|
| A | 7744 | 7395 | 1 | 1 | 0.01% | 0.01% | 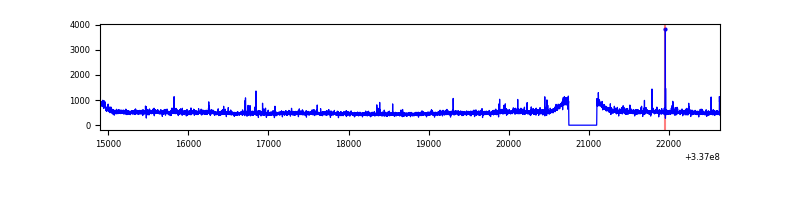 |
| B | 7744 | 7395 | 5 | 5 | 0.06% | 0.07% | 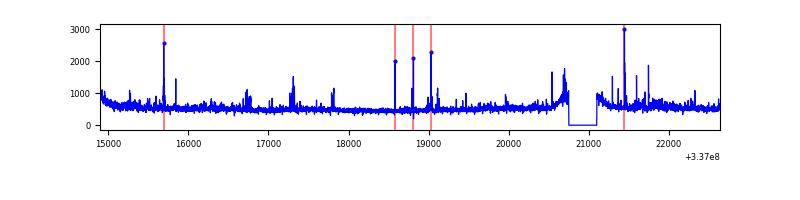 |
| C | 7744 | 7395 | 21 | 21 | 0.27% | 0.28% | 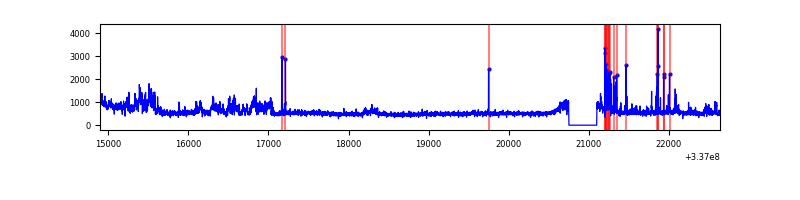 |
| D | 7744 | 7395 | 268 | 268 | 3.46% | 3.62% | 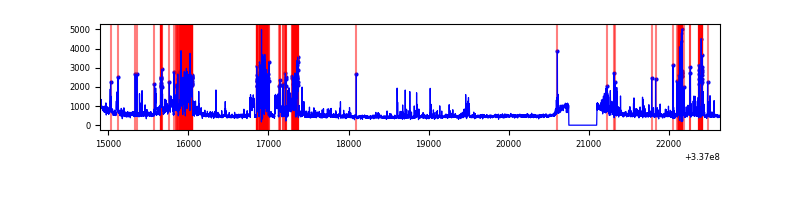 |
Top three noisy pixels from each quadrant. If the there are fewer than three noisy pixels in the level2.evt file, extra rows are filled as -1
| Pixel properties | Quadrant properties | ||||||
|---|---|---|---|---|---|---|---|
| Quadrant | DetID | PixID | Counts | Sigma | Mean | Median | Sigma |
| A | 0 | 13 | 69938 | 355.21 | 958 | 939 | 194.2 |
| A | 6 | 16 | 22962 | 113.37 | 958 | 939 | 194.2 |
| A | 12 | 96 | 16310 | 79.13 | 958 | 939 | 194.2 |
| B | 0 | 189 | 146303 | 800.76 | 945 | 922 | 181.6 |
| B | 10 | 246 | 44649 | 240.85 | 945 | 922 | 181.6 |
| B | 5 | 172 | 23909 | 126.61 | 945 | 922 | 181.6 |
| C | 3 | 233 | 623826 | 2908.95 | 908 | 915 | 214.1 |
| C | 1 | 0 | 160508 | 745.29 | 908 | 915 | 214.1 |
| C | 14 | 238 | 145312 | 674.32 | 908 | 915 | 214.1 |
| D | 1 | 52 | 1284966 | 5647.8 | 915 | 890 | 227.4 |
| D | 2 | 250 | 110140 | 480.52 | 915 | 890 | 227.4 |
| D | 15 | 0 | 79798 | 347.06 | 915 | 890 | 227.4 |
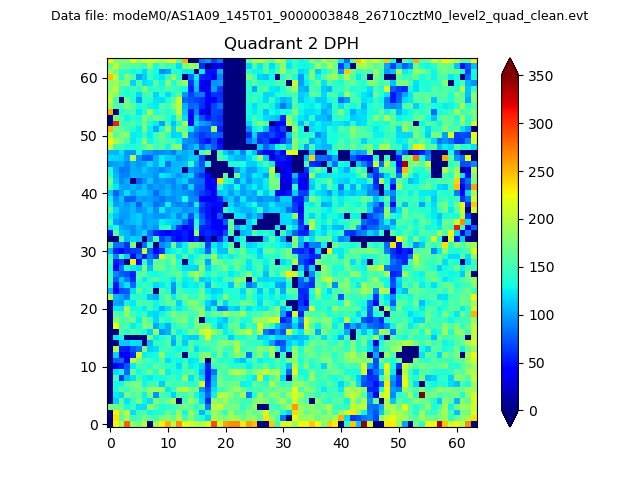
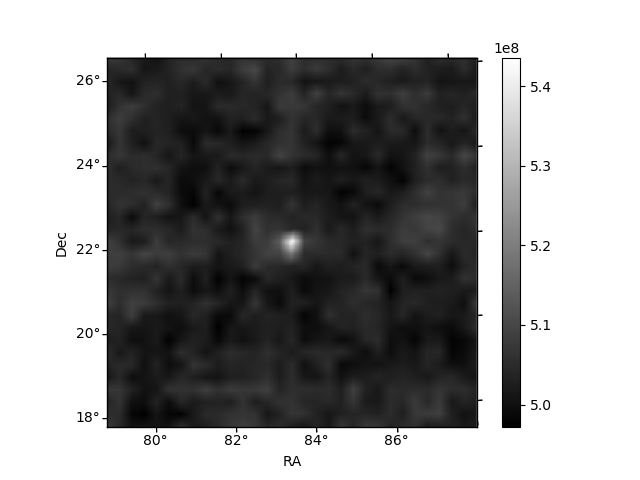
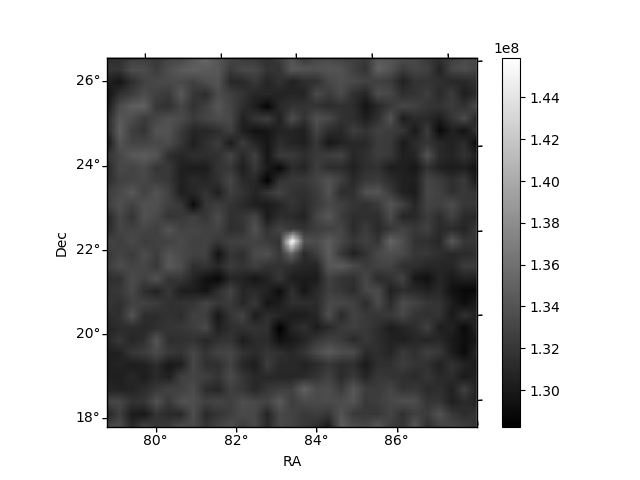
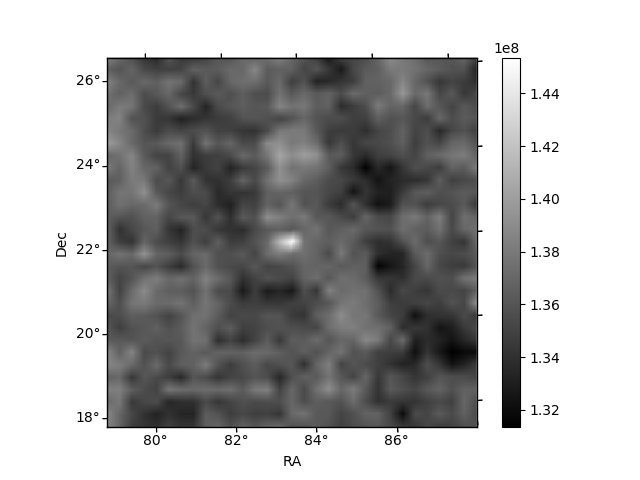
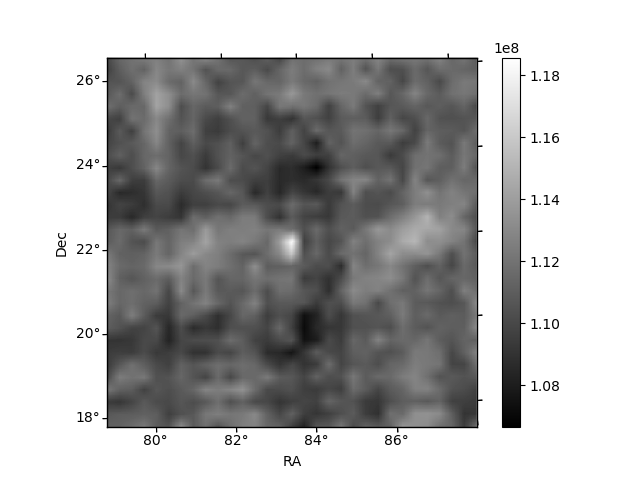
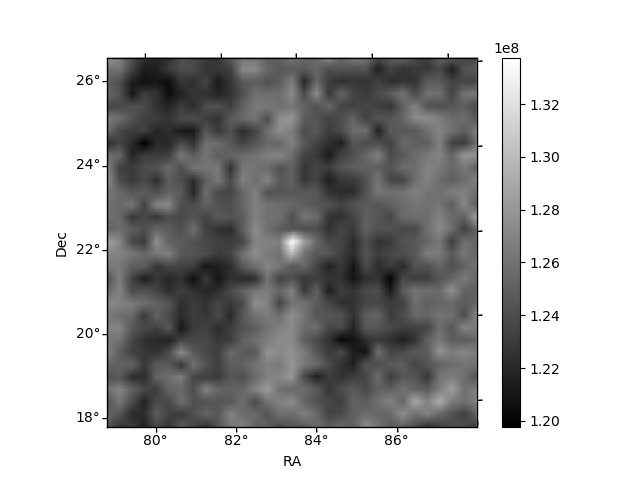
Histogram calculated using DETX and DETY for each event in the final _common_clean file
| Quadrant A | 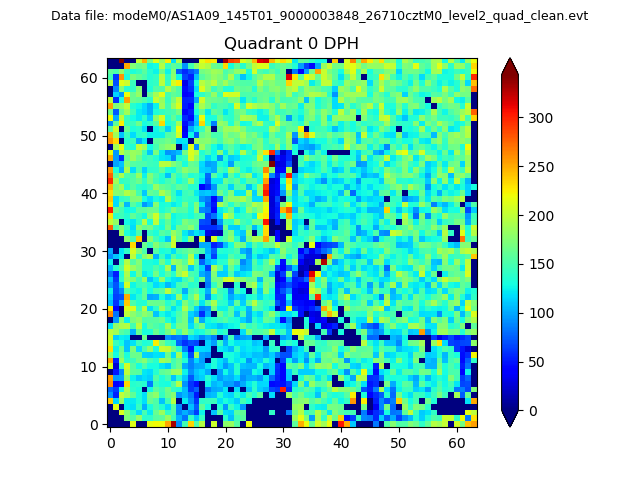 |
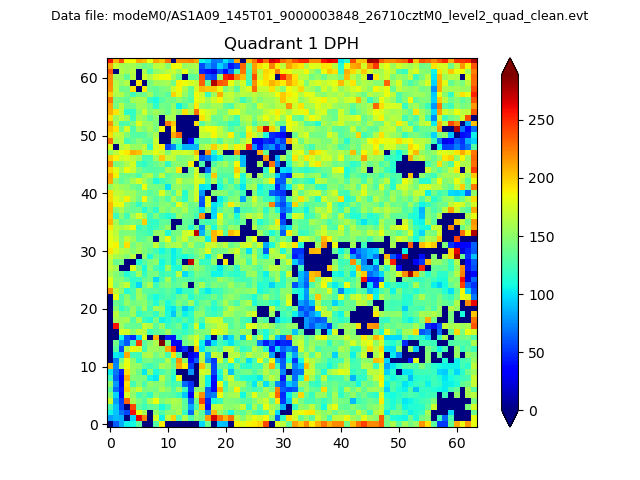 |
Quadrant B |
|---|---|---|---|
| Quadrant D | 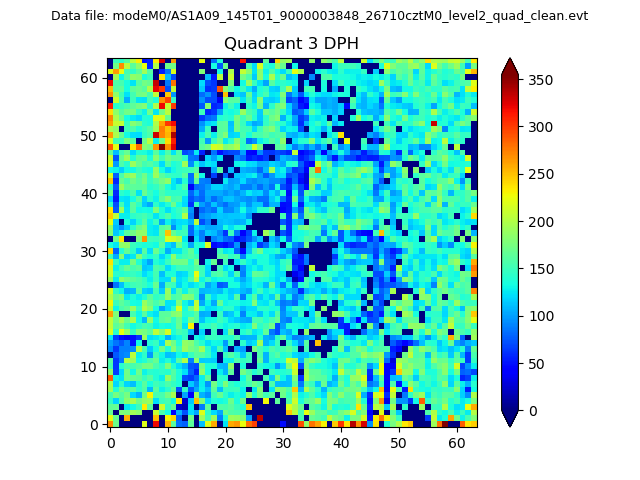 |
 |
Quadrant C |
| Plot type | Count rate plots | Images |
|---|---|---|
| Comparison with Poisson distribution Blue bars denote a histogram of data divided into 1 sec bins. Red curve is a Poisson curve with rate = median count rate of data. |
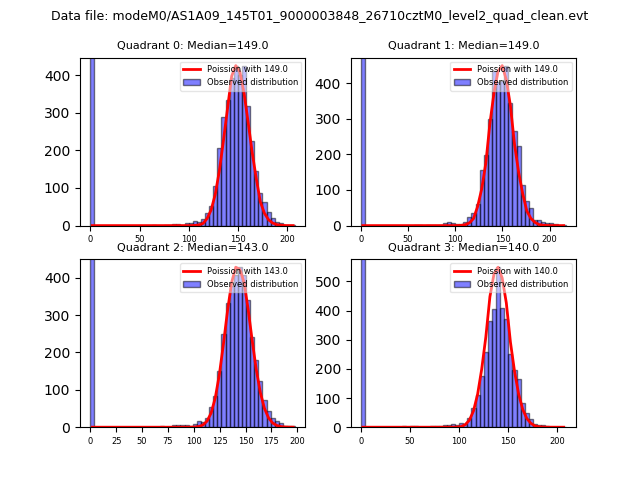 |
 |
| Quadrant-wise count rates Data is divided into 100 sec bins |
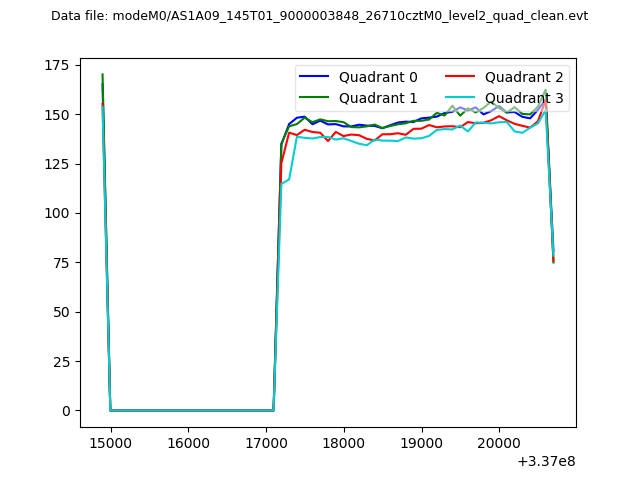 |
|
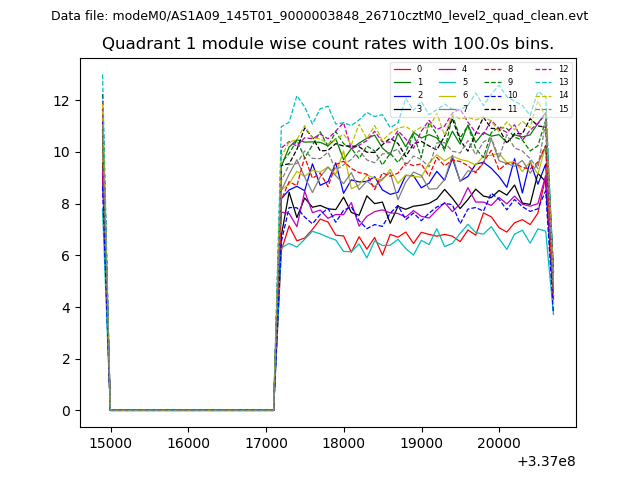
| Module-wise count rates for Quadrant A Data is divided into 100 sec bins |
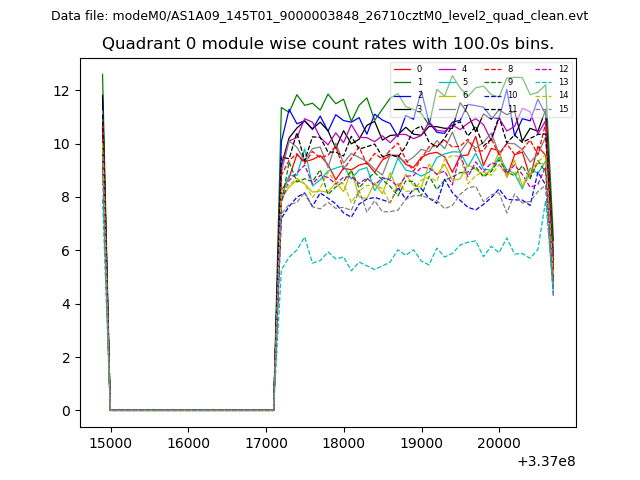 |
 |
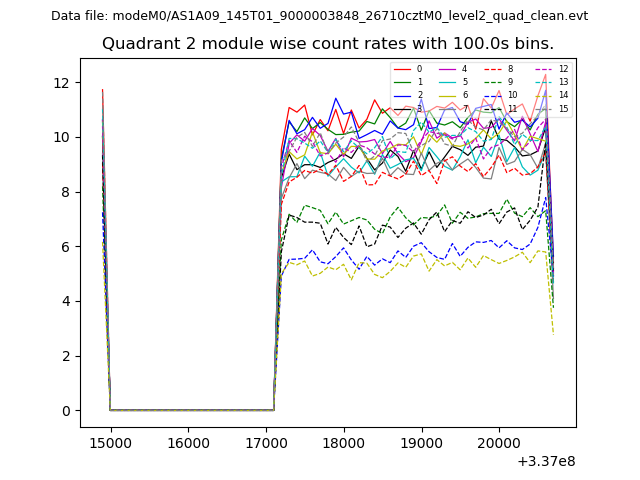
| Module-wise count rates for Quadrant B Data is divided into 100 sec bins |
 |
 |
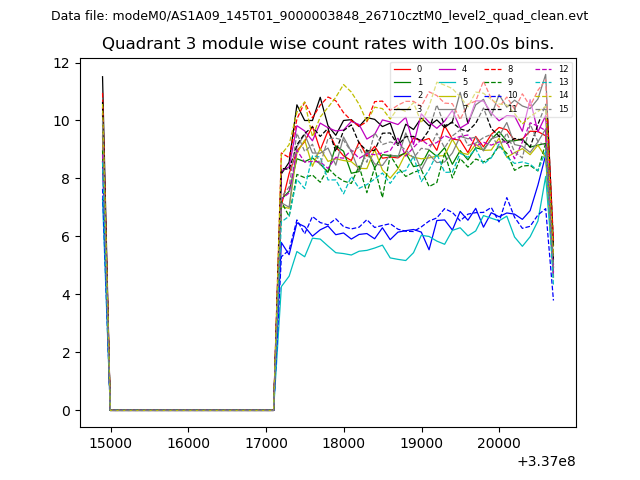
| Module-wise count rates for Quadrant C Data is divided into 100 sec bins |
 |
 |
| Module-wise count rates for Quadrant D Data is divided into 100 sec bins |
 |
 |
| Parameter | Plot |
|---|---|
| CZT HV Monitor |  |
| D_VDD | 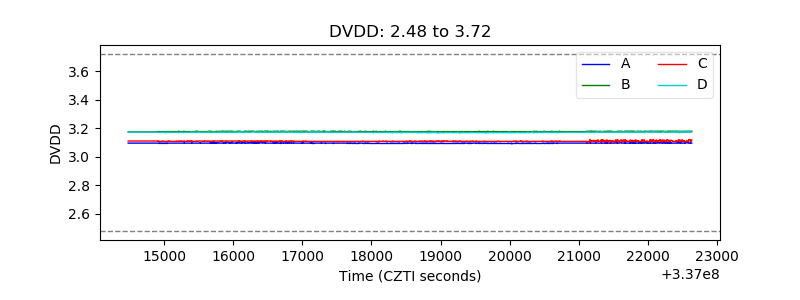 |
| Temperature 1 | 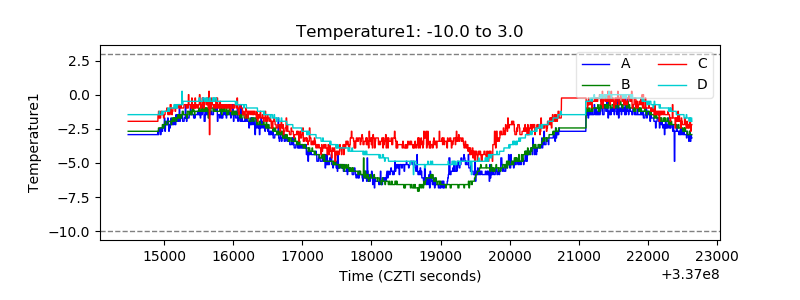 |
| Veto HV Monitor | 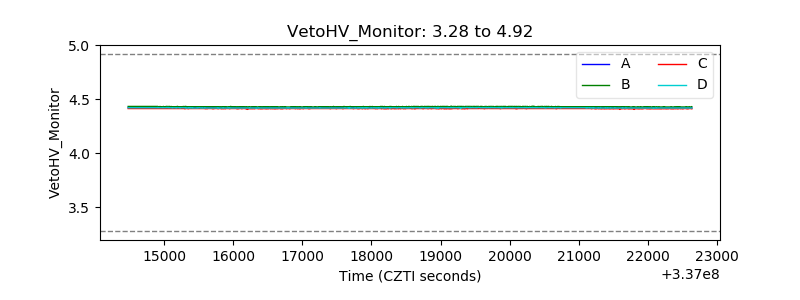 |
| Veto LLD | 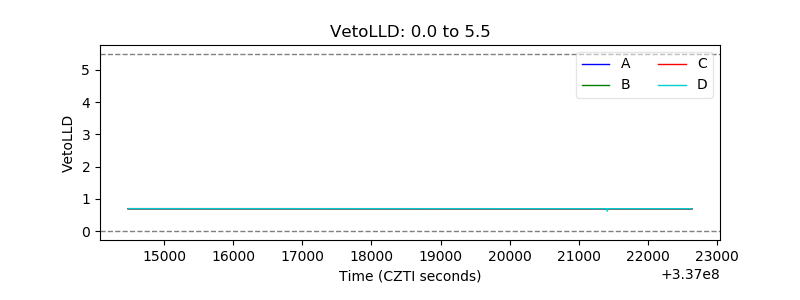 |
| Alpha Counter | 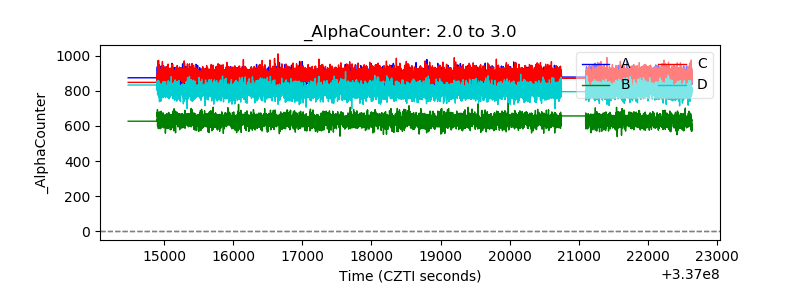 |
| _CPM_Rate | 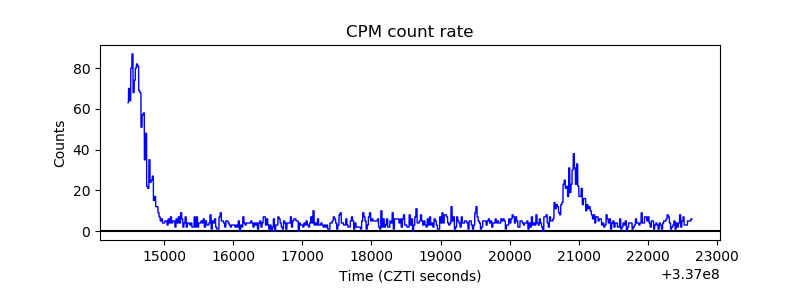 |
| CZT Counter | 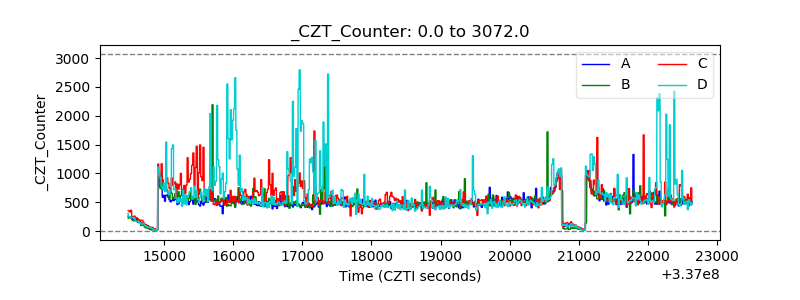 |
| +2.5 Volts monitor |  |
| +5 Volts monitor |  |
| _ROLL_ROT | 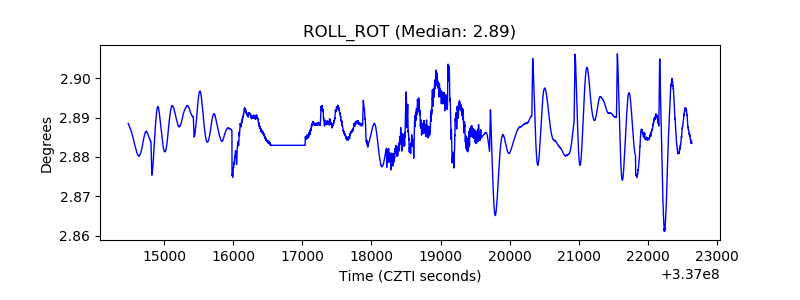 |
| _Roll_DEC | 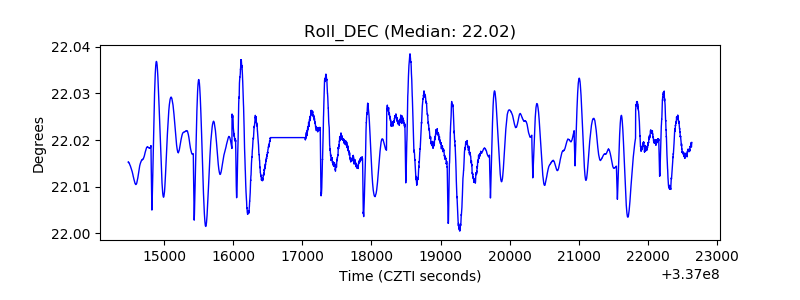 |
| _Roll_RA | 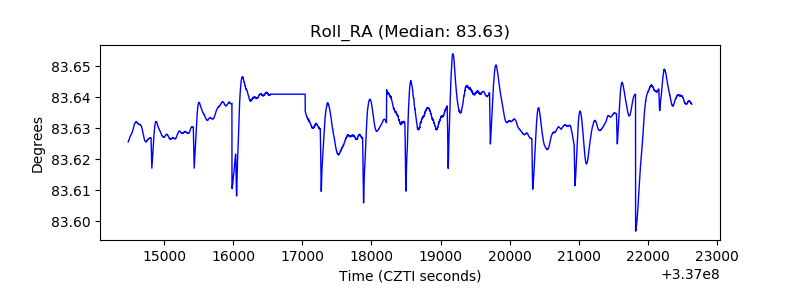 |
| Veto Counter | 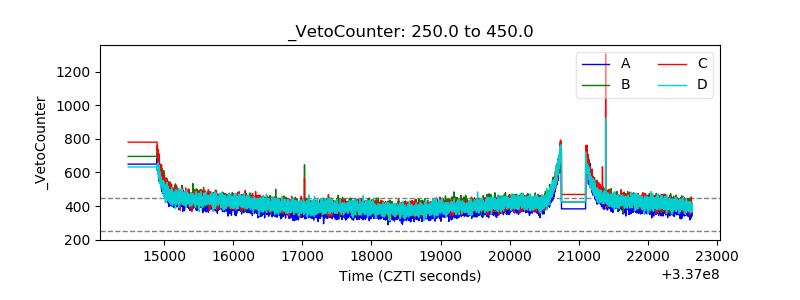 |