| Param | Original file | Final file |
|---|---|---|
| Filename | modeM0/AS1A09_145T01_9000003848_26711cztM0_level2.evt | modeM0/AS1A09_145T01_9000003848_26711cztM0_level2_quad_clean.evt |
| Size (bytes) | 620,959,680 | 86,492,160 |
| Size | 592.2 MB | 82.5 MB |
| Events in quadrant A | 4,202,218 | 536,740 |
| Events in quadrant B | 3,951,312 | 541,657 |
| Events in quadrant C | 4,580,456 | 517,191 |
| Events in quadrant D | 5,558,421 | 496,321 |
| Mode M0 | |||
|---|---|---|---|
| Quadrant | BADHDUFLAG | Total packets | Discarded packets |
| A | 0 | 17148 | 0 |
| B | 0 | 16308 | 0 |
| C | 0 | 18326 | 0 |
| D | 0 | 21485 | 0 |
| Mode M9 | |||
|---|---|---|---|
| Quadrant | BADHDUFLAG | Total packets | Discarded packets |
| A | 0 | 7 | 0 |
| B | 0 | 7 | 0 |
| C | 0 | 7 | 0 |
| D | 0 | 7 | 0 |
| Quadrant | Total seconds | Saturated seconds | Saturation percentage |
|---|---|---|---|
| A | 7580 | 211 | 2.783641% |
| B | 7580 | 162 | 2.137203% |
| C | 7580 | 365 | 4.815303% |
| D | 7581 | 553 | 7.294552% |
Noise dominated data is calculated using 1-second bins in cleaned event files. If a bin has >2000 counts, and if more than 50% of those come from <1% of pixels, then it is considered to be noise-dominated and hence unusable.
| Quadrant | # 1 sec bins | Bins with >0 counts | Bins with >2000 counts | High rate bins dominated by noise | Noise dominated (total time) | Noise dominated (detector-on time) | Marked lightcurve |
|---|---|---|---|---|---|---|---|
| A | 8220 | 7582 | 42 | 42 | 0.51% | 0.55% | 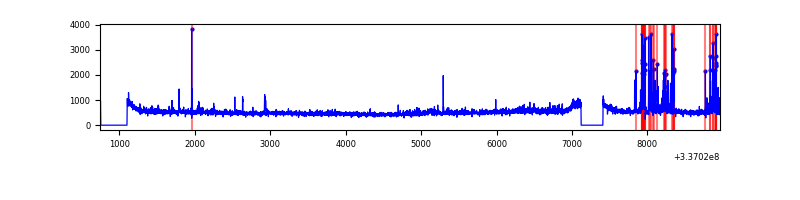 |
| B | 8220 | 7582 | 5 | 5 | 0.06% | 0.07% | 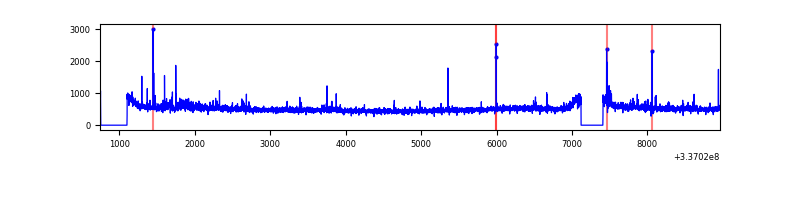 |
| C | 8220 | 7582 | 28 | 28 | 0.34% | 0.37% | 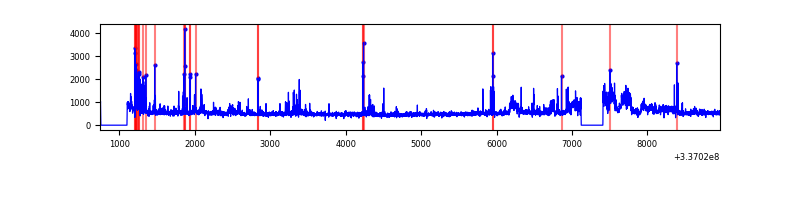 |
| D | 8221 | 7583 | 326 | 326 | 3.97% | 4.30% | 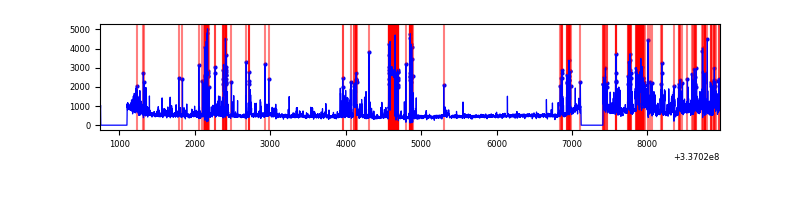 |
Top three noisy pixels from each quadrant. If the there are fewer than three noisy pixels in the level2.evt file, extra rows are filled as -1
| Pixel properties | Quadrant properties | ||||||
|---|---|---|---|---|---|---|---|
| Quadrant | DetID | PixID | Counts | Sigma | Mean | Median | Sigma |
| A | 0 | 13 | 400524 | 1997.33 | 976 | 954 | 200.1 |
| A | 6 | 16 | 19144 | 90.93 | 976 | 954 | 200.1 |
| A | 12 | 96 | 18839 | 89.4 | 976 | 954 | 200.1 |
| B | 0 | 189 | 57215 | 302.76 | 966 | 943 | 185.9 |
| B | 10 | 246 | 27280 | 141.7 | 966 | 943 | 185.9 |
| B | 0 | 219 | 23919 | 123.62 | 966 | 943 | 185.9 |
| C | 3 | 233 | 477003 | 2206.47 | 922 | 928 | 215.8 |
| C | 1 | 0 | 293645 | 1356.66 | 922 | 928 | 215.8 |
| C | 14 | 238 | 144709 | 666.38 | 922 | 928 | 215.8 |
| D | 1 | 52 | 1022031 | 4464.18 | 925 | 899 | 228.7 |
| D | 7 | 80 | 539691 | 2355.49 | 925 | 899 | 228.7 |
| D | 15 | 0 | 194558 | 846.64 | 925 | 899 | 228.7 |
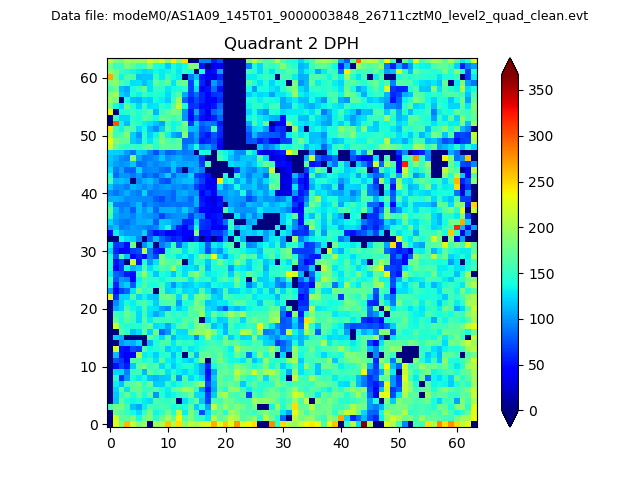
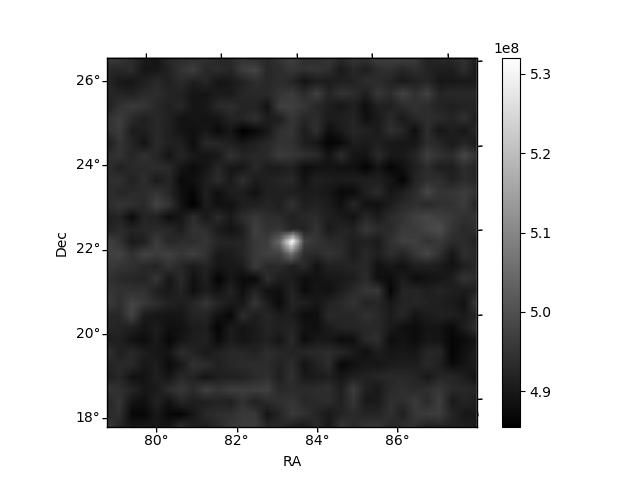
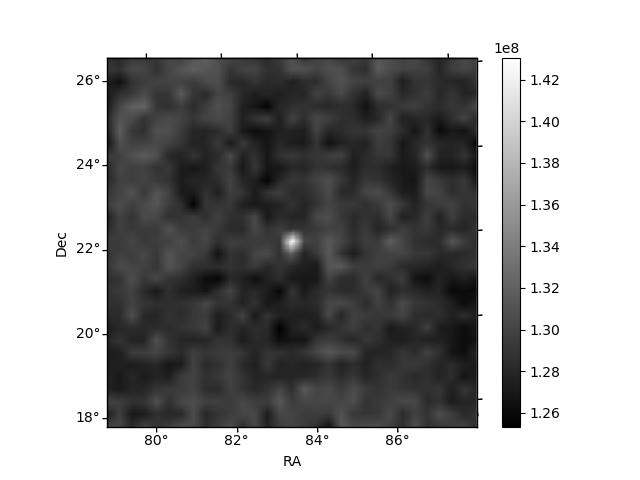
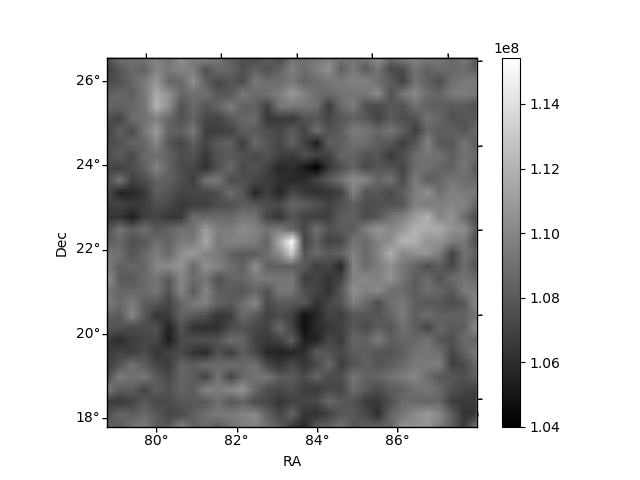
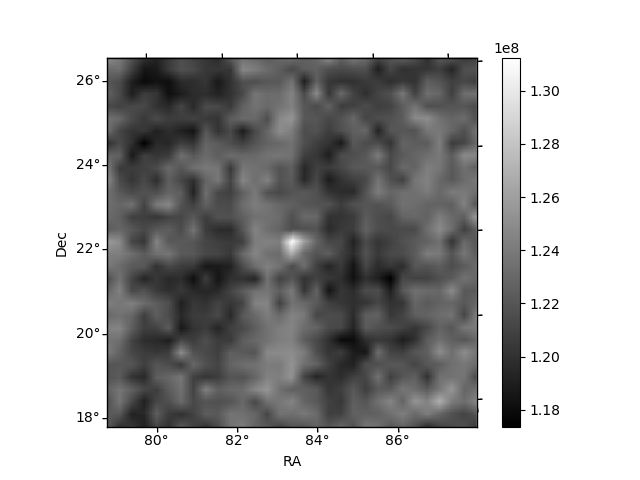
Histogram calculated using DETX and DETY for each event in the final _common_clean file
| Quadrant A | 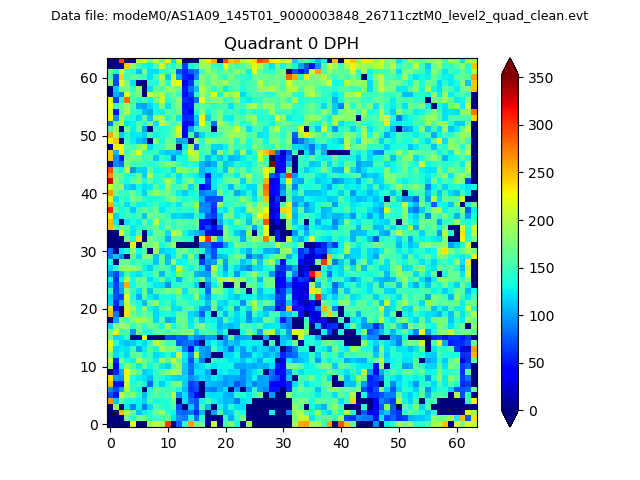 |
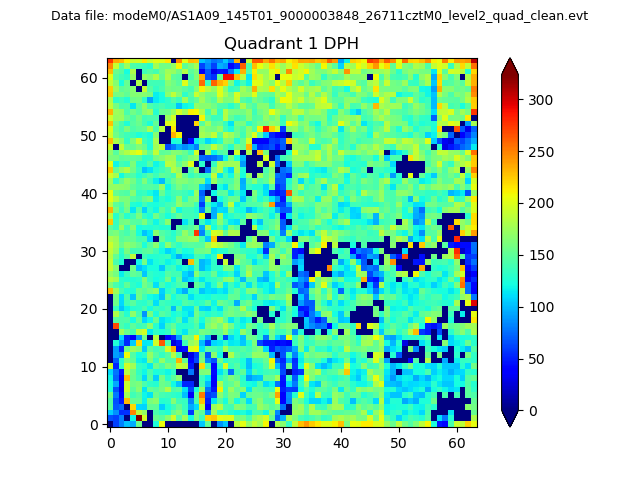 |
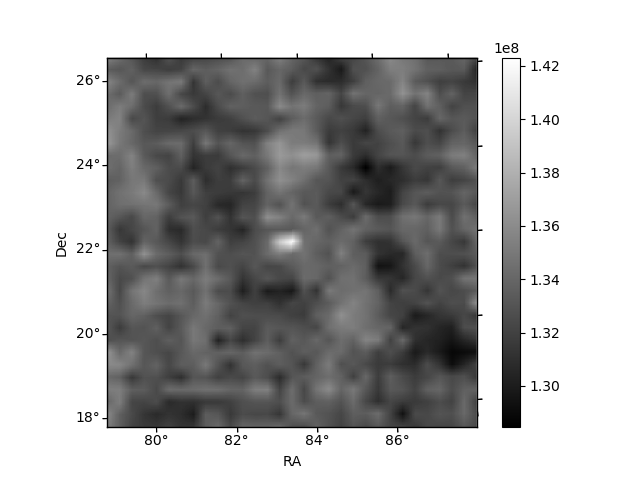
Quadrant B |
|---|---|---|---|
| Quadrant D | 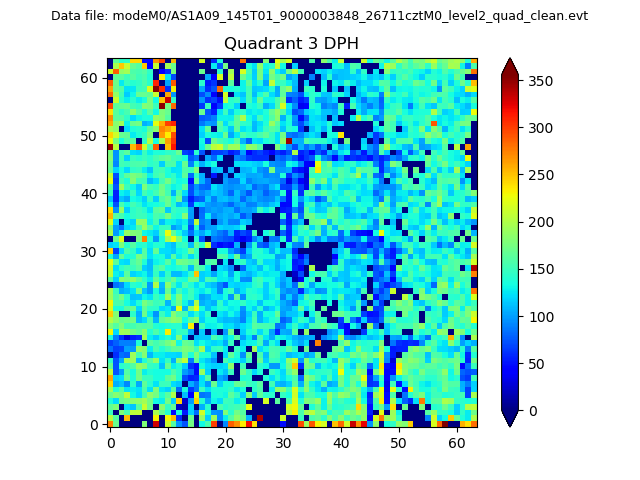 |
 |
Quadrant C |
| Plot type | Count rate plots | Images |
|---|---|---|
| Comparison with Poisson distribution Blue bars denote a histogram of data divided into 1 sec bins. Red curve is a Poisson curve with rate = median count rate of data. |
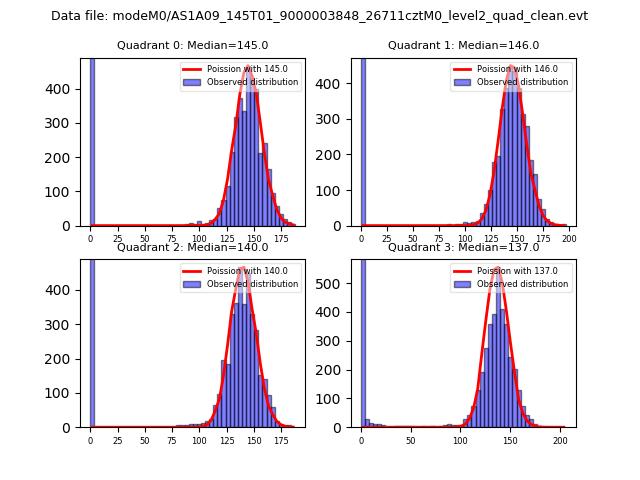 |
 |
| Quadrant-wise count rates Data is divided into 100 sec bins |
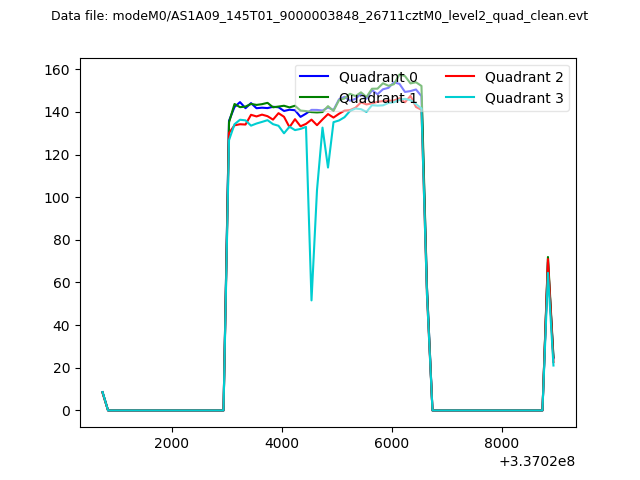 |
|
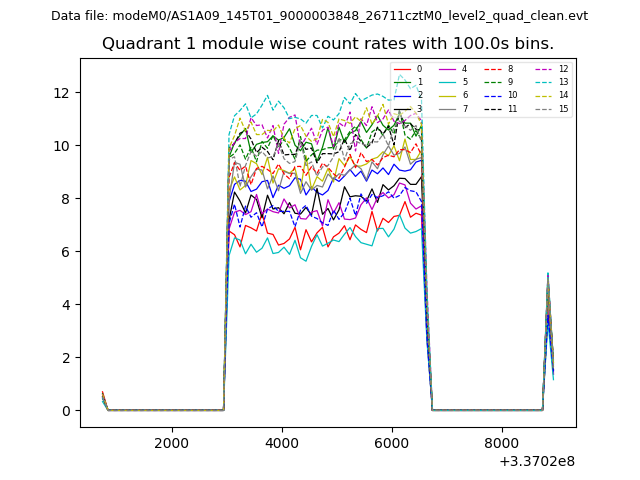
| Module-wise count rates for Quadrant A Data is divided into 100 sec bins |
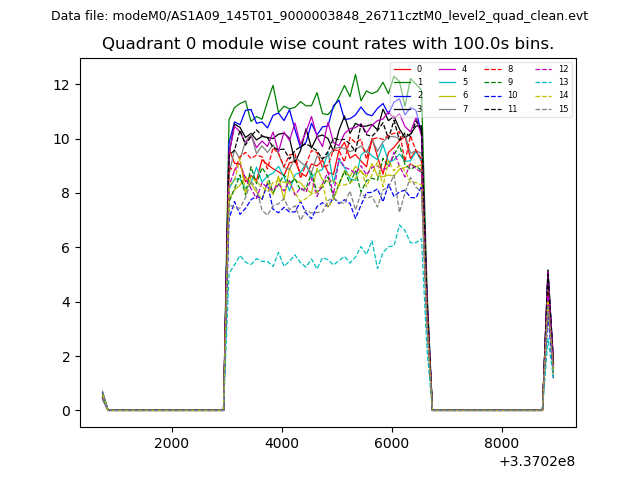 |
 |
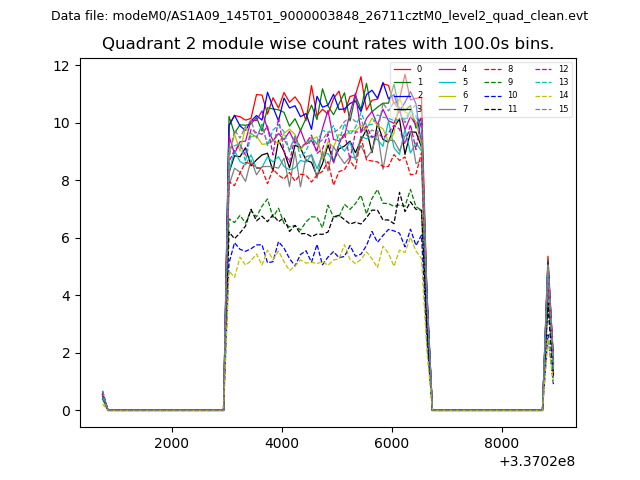
| Module-wise count rates for Quadrant B Data is divided into 100 sec bins |
 |
 |
| Module-wise count rates for Quadrant C Data is divided into 100 sec bins |
 |
 |
| Module-wise count rates for Quadrant D Data is divided into 100 sec bins |
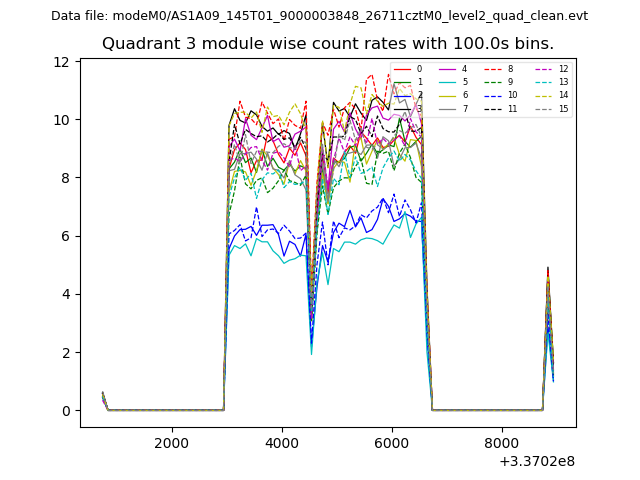 |
 |
| Parameter | Plot |
|---|---|
| CZT HV Monitor | 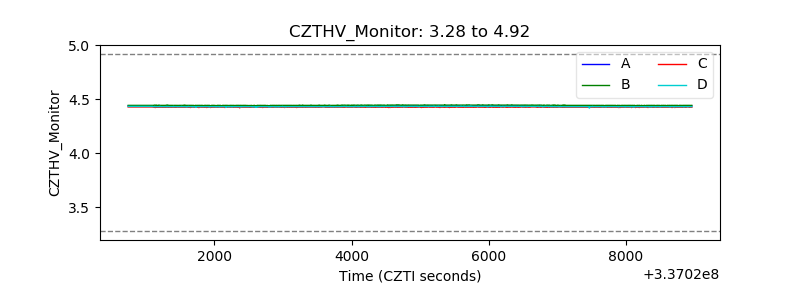 |
| D_VDD | 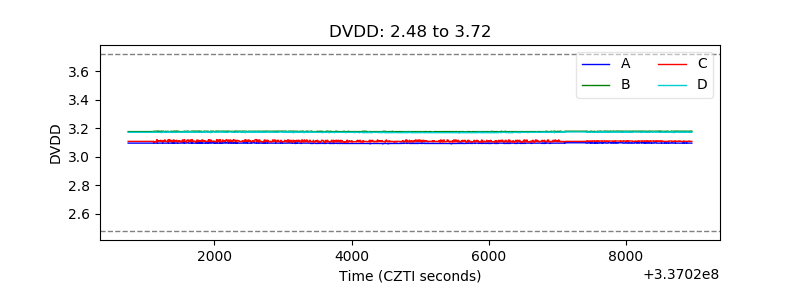 |
| Temperature 1 | 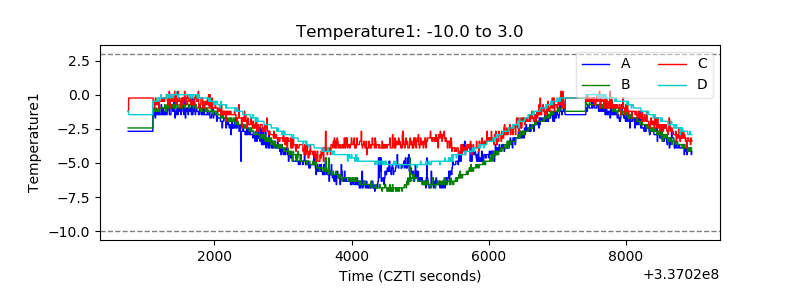 |
| Veto HV Monitor | 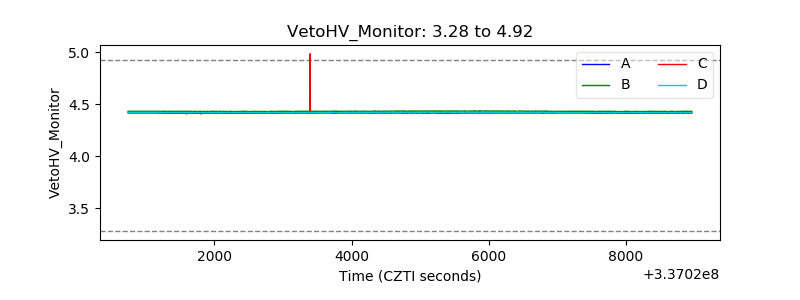 |
| Veto LLD | 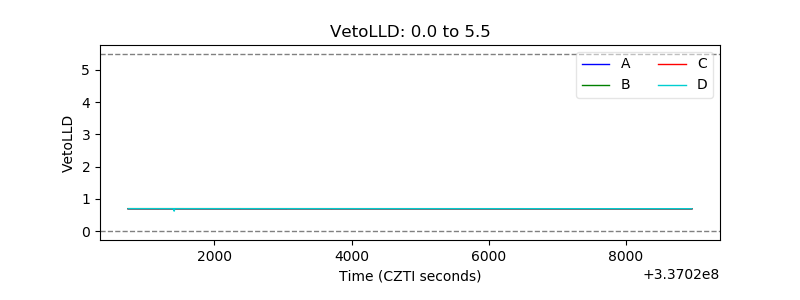 |
| Alpha Counter | 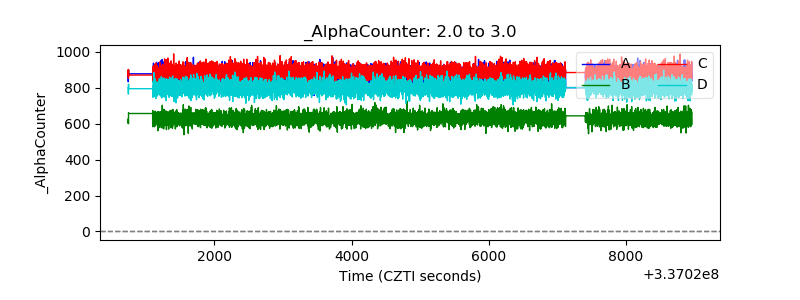 |
| _CPM_Rate | 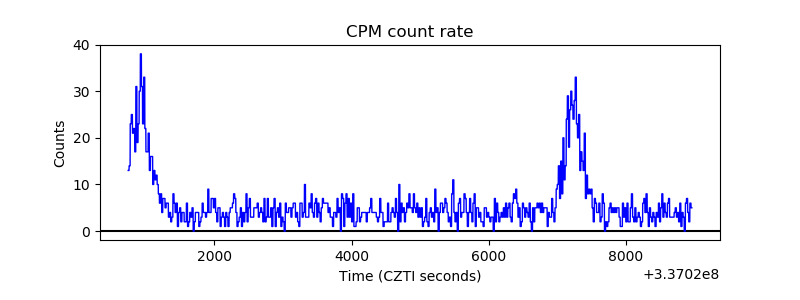 |
| CZT Counter | 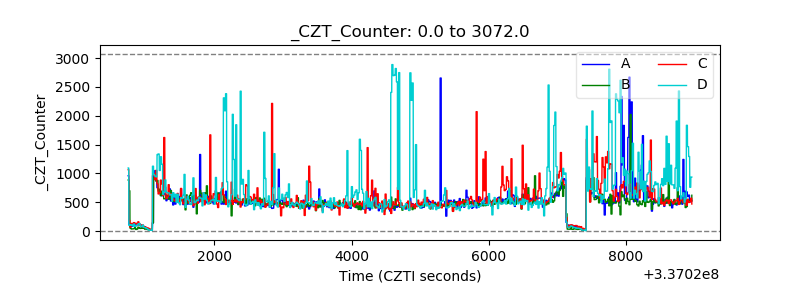 |
| +2.5 Volts monitor |  |
| +5 Volts monitor |  |
| _ROLL_ROT | 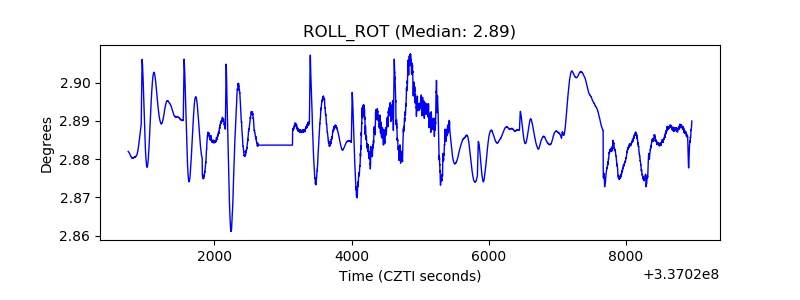 |
| _Roll_DEC | 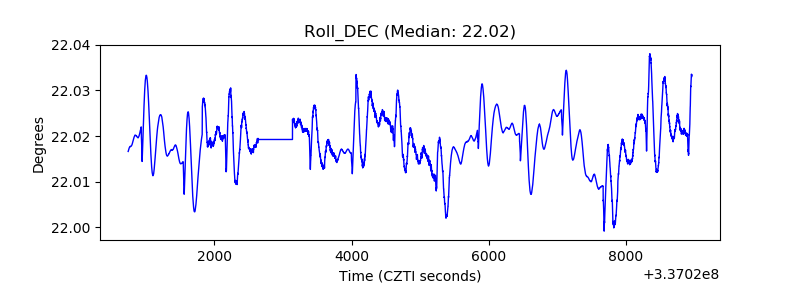 |
| _Roll_RA | 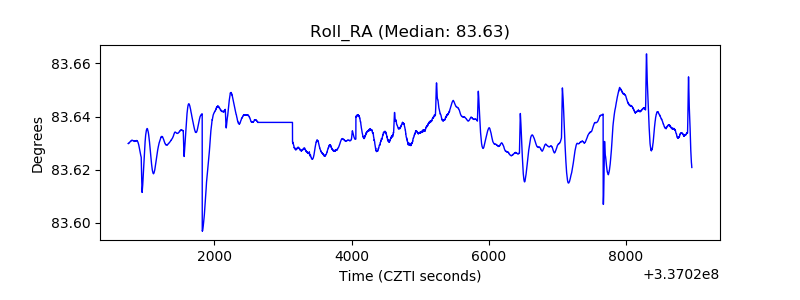 |
| Veto Counter | 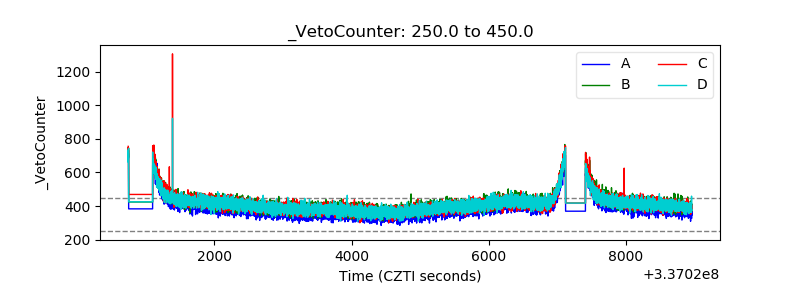 |