| Param | Original file | Final file |
|---|---|---|
| Filename | modeM0/AS1A09_145T01_9000003848_26712cztM0_level2.evt | modeM0/AS1A09_145T01_9000003848_26712cztM0_level2_quad_clean.evt |
| Size (bytes) | 684,815,040 | 94,536,000 |
| Size | 653.1 MB | 90.2 MB |
| Events in quadrant A | 4,243,616 | 598,453 |
| Events in quadrant B | 4,031,146 | 604,031 |
| Events in quadrant C | 4,188,726 | 580,319 |
| Events in quadrant D | 7,765,600 | 554,841 |
| Mode M0 | |||
|---|---|---|---|
| Quadrant | BADHDUFLAG | Total packets | Discarded packets |
| A | 0 | 17266 | 0 |
| B | 0 | 16547 | 0 |
| C | 0 | 17087 | 0 |
| D | 0 | 28422 | 0 |
| Mode M9 | |||
|---|---|---|---|
| Quadrant | BADHDUFLAG | Total packets | Discarded packets |
| A | 0 | 7 | 0 |
| B | 0 | 7 | 0 |
| C | 0 | 7 | 0 |
| D | 0 | 7 | 0 |
| Quadrant | Total seconds | Saturated seconds | Saturation percentage |
|---|---|---|---|
| A | 7544 | 231 | 3.062036% |
| B | 7544 | 198 | 2.624602% |
| C | 7545 | 305 | 4.042412% |
| D | 7544 | 939 | 12.446978% |
Noise dominated data is calculated using 1-second bins in cleaned event files. If a bin has >2000 counts, and if more than 50% of those come from <1% of pixels, then it is considered to be noise-dominated and hence unusable.
| Quadrant | # 1 sec bins | Bins with >0 counts | Bins with >2000 counts | High rate bins dominated by noise | Noise dominated (total time) | Noise dominated (detector-on time) | Marked lightcurve |
|---|---|---|---|---|---|---|---|
| A | 8314 | 7546 | 64 | 64 | 0.77% | 0.85% | 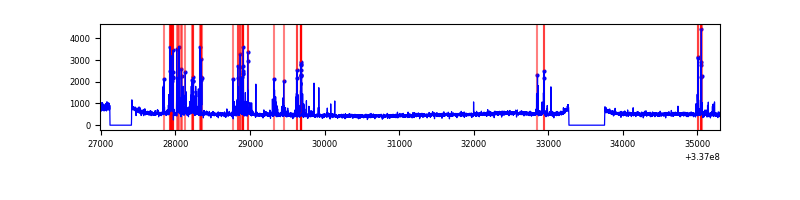 |
| B | 8314 | 7546 | 23 | 23 | 0.28% | 0.30% | 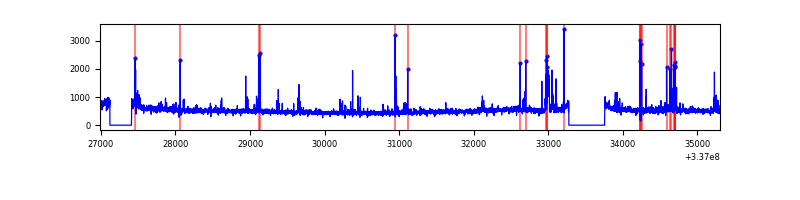 |
| C | 8315 | 7547 | 5 | 5 | 0.06% | 0.07% | 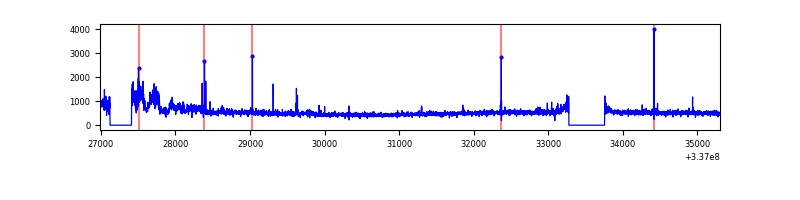 |
| D | 8314 | 7546 | 513 | 513 | 6.17% | 6.80% | 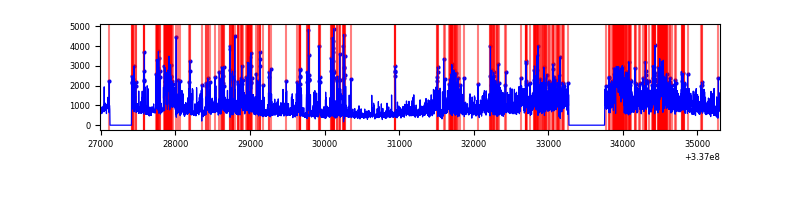 |
Top three noisy pixels from each quadrant. If the there are fewer than three noisy pixels in the level2.evt file, extra rows are filled as -1
| Pixel properties | Quadrant properties | ||||||
|---|---|---|---|---|---|---|---|
| Quadrant | DetID | PixID | Counts | Sigma | Mean | Median | Sigma |
| A | 0 | 13 | 512037 | 2608.16 | 963 | 943 | 196.0 |
| A | 13 | 254 | 13319 | 63.15 | 963 | 943 | 196.0 |
| A | 3 | 137 | 8989 | 41.06 | 963 | 943 | 196.0 |
| B | 5 | 172 | 121784 | 652.25 | 960 | 937 | 185.3 |
| B | 10 | 246 | 88546 | 472.85 | 960 | 937 | 185.3 |
| B | 12 | 111 | 21821 | 112.72 | 960 | 937 | 185.3 |
| C | 3 | 233 | 404490 | 1862.88 | 917 | 923 | 216.6 |
| C | 14 | 238 | 145535 | 667.53 | 917 | 923 | 216.6 |
| C | 15 | 208 | 27962 | 124.81 | 917 | 923 | 216.6 |
| D | 1 | 52 | 3342362 | 15005.78 | 906 | 881 | 222.7 |
| D | 2 | 250 | 340353 | 1524.48 | 906 | 881 | 222.7 |
| D | 7 | 80 | 273717 | 1225.24 | 906 | 881 | 222.7 |
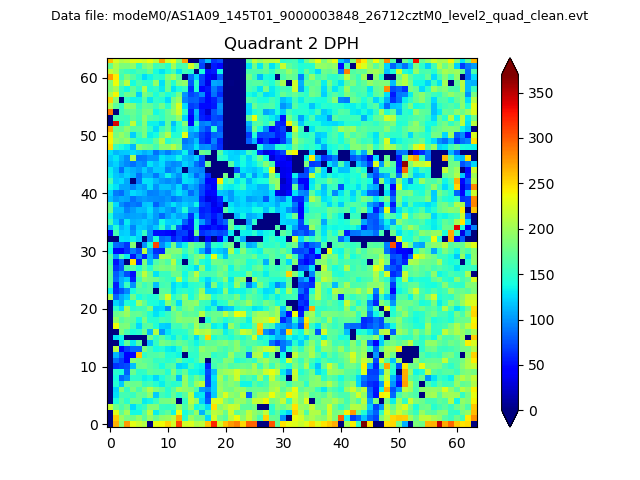
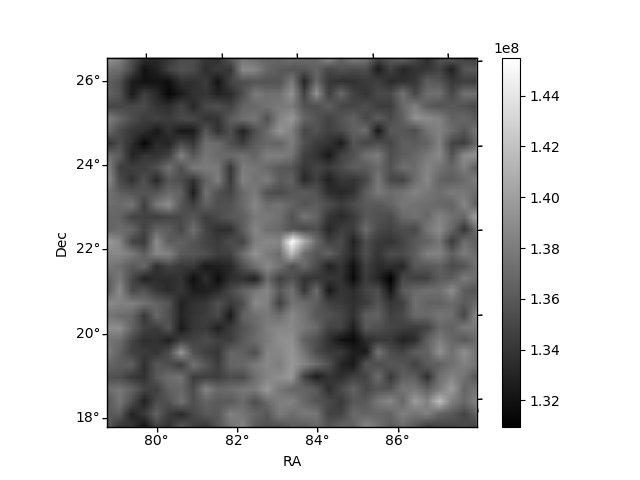
Histogram calculated using DETX and DETY for each event in the final _common_clean file
| Quadrant A | 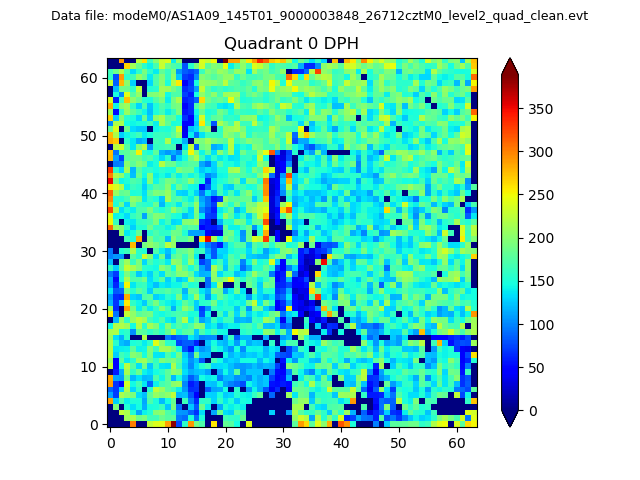 |
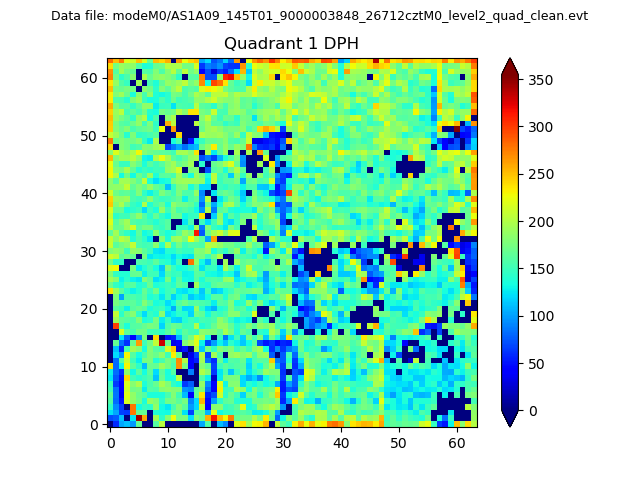 |
Quadrant B |
|---|---|---|---|
| Quadrant D | 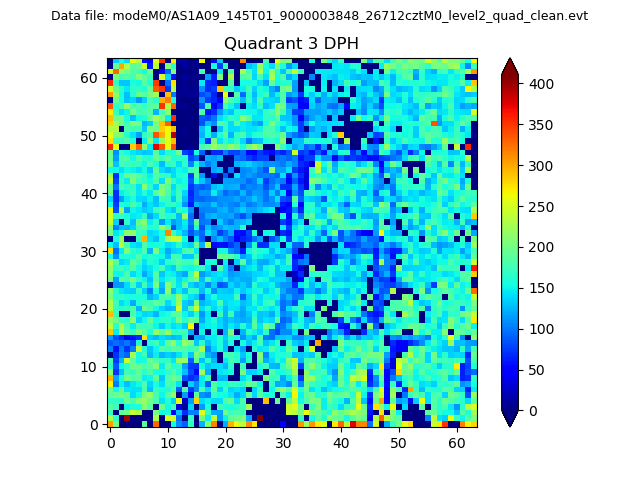 |
 |
Quadrant C |
| Plot type | Count rate plots | Images |
|---|---|---|
| Comparison with Poisson distribution Blue bars denote a histogram of data divided into 1 sec bins. Red curve is a Poisson curve with rate = median count rate of data. |
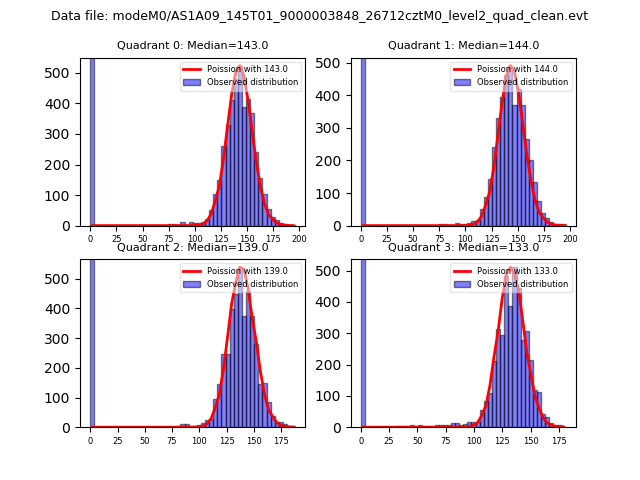 |
 |
| Quadrant-wise count rates Data is divided into 100 sec bins |
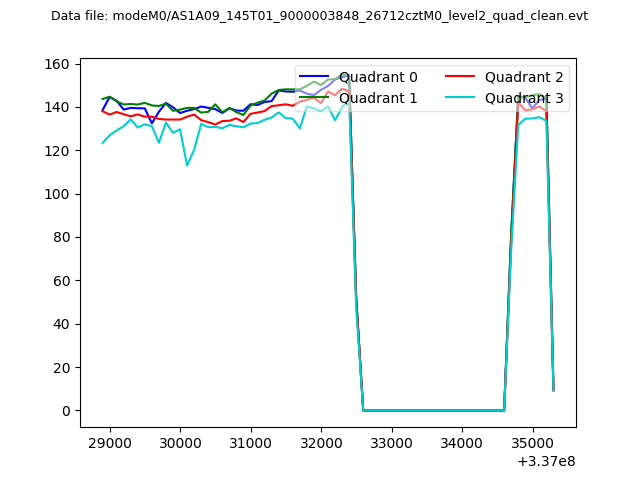 |
|
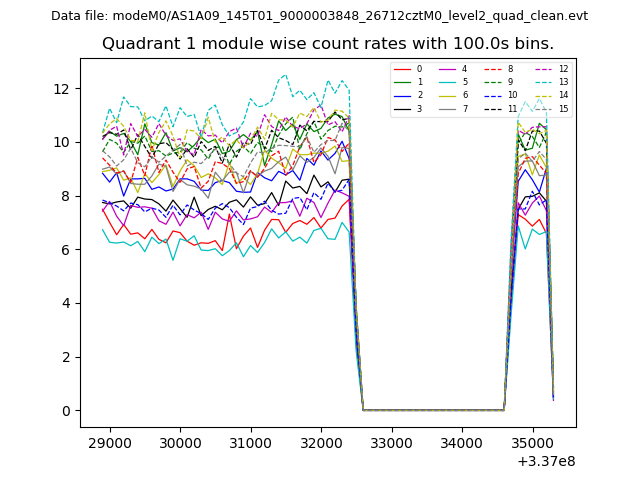
| Module-wise count rates for Quadrant A Data is divided into 100 sec bins |
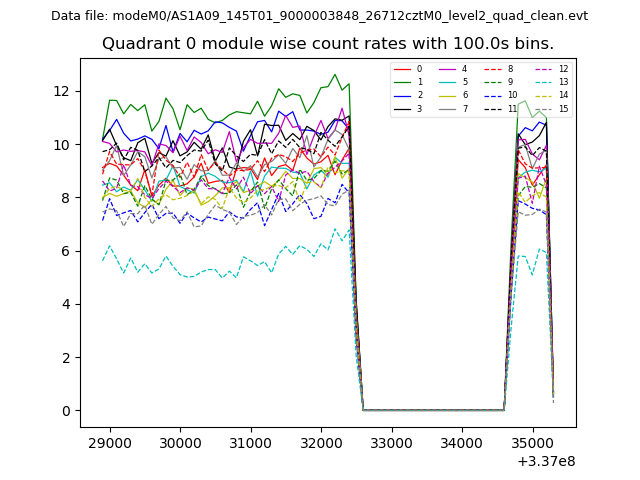 |
 |
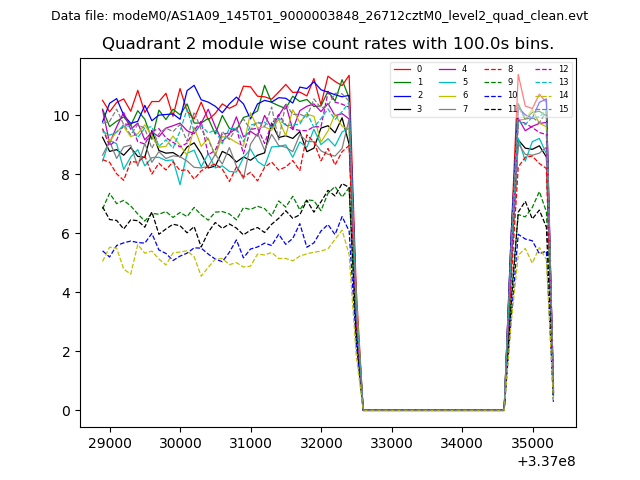
| Module-wise count rates for Quadrant B Data is divided into 100 sec bins |
 |
 |
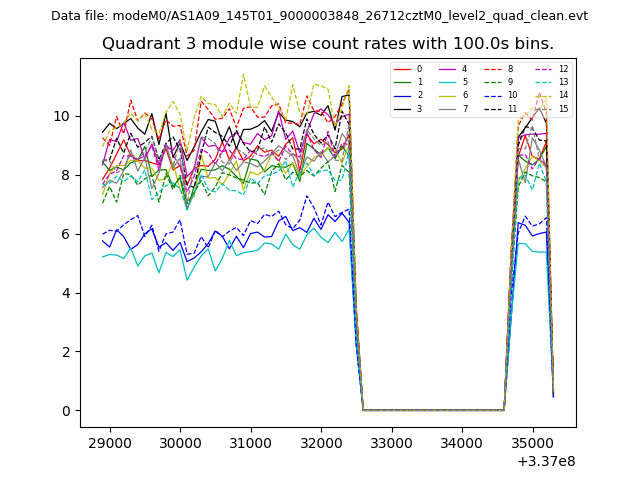
| Module-wise count rates for Quadrant C Data is divided into 100 sec bins |
 |
 |
| Module-wise count rates for Quadrant D Data is divided into 100 sec bins |
 |
 |
| Parameter | Plot |
|---|---|
| CZT HV Monitor | 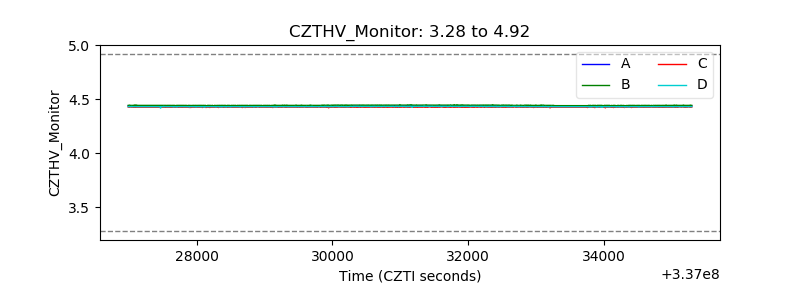 |
| D_VDD | 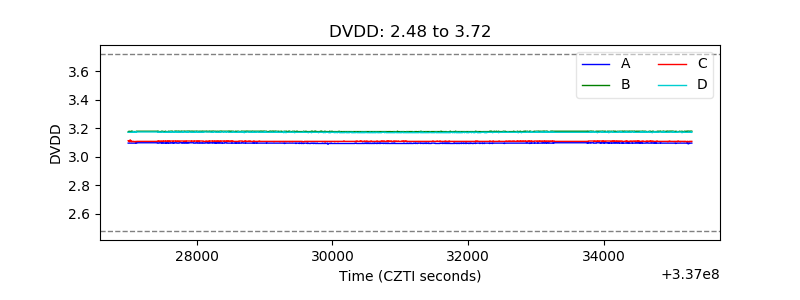 |
| Temperature 1 |  |
| Veto HV Monitor | 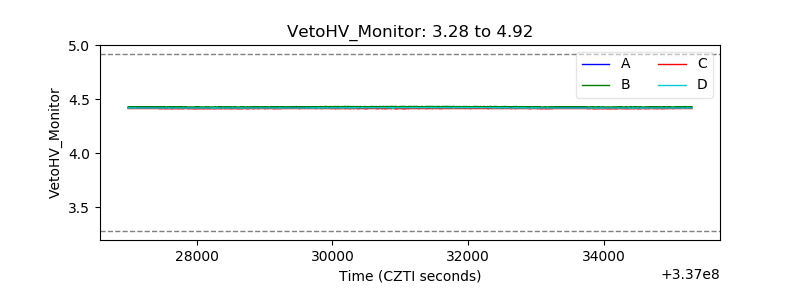 |
| Veto LLD | 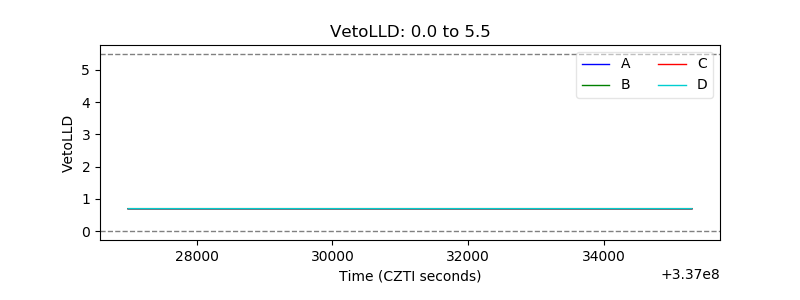 |
| Alpha Counter | 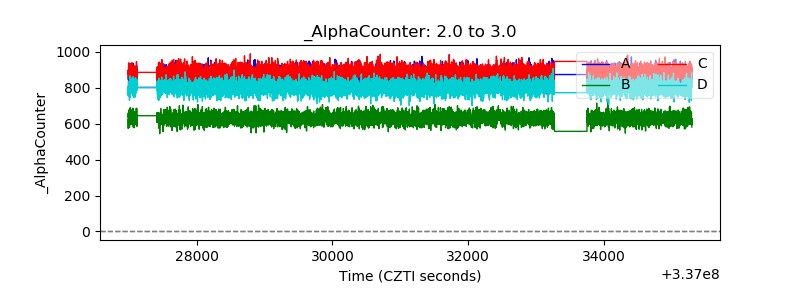 |
| _CPM_Rate | 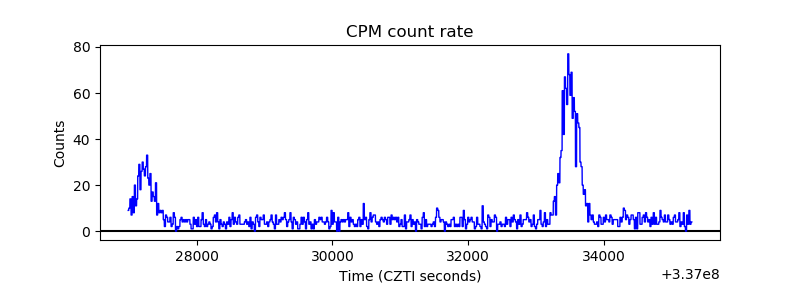 |
| CZT Counter |  |
| +2.5 Volts monitor |  |
| +5 Volts monitor |  |
| _ROLL_ROT | 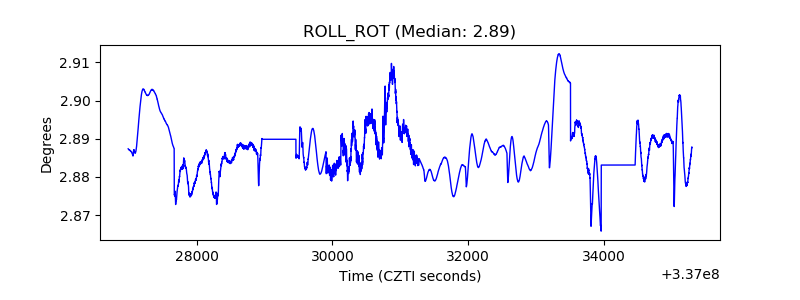 |
| _Roll_DEC | 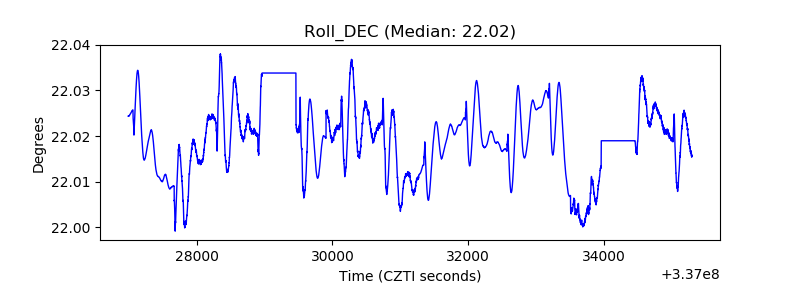 |
| _Roll_RA | 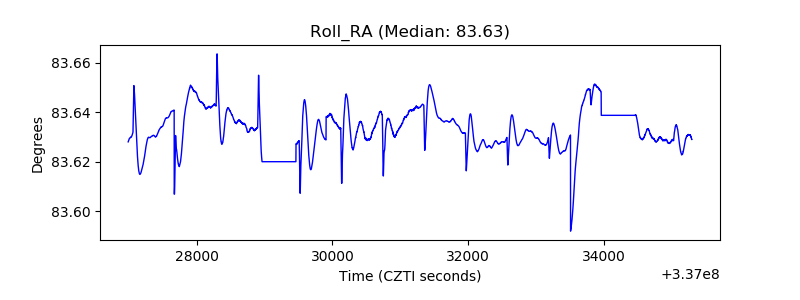 |
| Veto Counter | 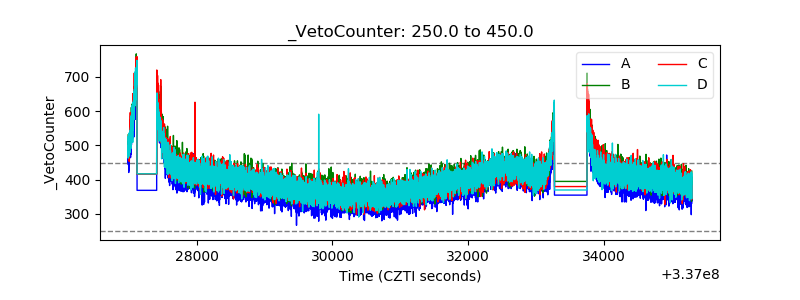 |