| Param | Original file | Final file |
|---|---|---|
| Filename | modeM0/AS1A09_145T01_9000003848_26715cztM0_level2.evt | modeM0/AS1A09_145T01_9000003848_26715cztM0_level2_quad_clean.evt |
| Size (bytes) | 1,084,849,920 | 188,542,080 |
| Size | 1.0 GB | 179.8 MB |
| Events in quadrant A | 7,274,582 | 1,229,164 |
| Events in quadrant B | 7,295,194 | 1,235,430 |
| Events in quadrant C | 6,329,640 | 1,204,470 |
| Events in quadrant D | 11,092,555 | 1,158,365 |
| Mode M0 | |||
|---|---|---|---|
| Quadrant | BADHDUFLAG | Total packets | Discarded packets |
| A | 0 | 29600 | 0 |
| B | 0 | 29652 | 0 |
| C | 0 | 26589 | 0 |
| D | 0 | 41810 | 0 |
| Mode M9 | |||
|---|---|---|---|
| Quadrant | BADHDUFLAG | Total packets | Discarded packets |
| A | 0 | 17 | 0 |
| B | 0 | 17 | 0 |
| C | 0 | 17 | 0 |
| D | 0 | 17 | 0 |
| Quadrant | Total seconds | Saturated seconds | Saturation percentage |
|---|---|---|---|
| A | 12763 | 359 | 2.812818% |
| B | 12764 | 473 | 3.705735% |
| C | 12764 | 203 | 1.590411% |
| D | 12764 | 980 | 7.677844% |
Noise dominated data is calculated using 1-second bins in cleaned event files. If a bin has >2000 counts, and if more than 50% of those come from <1% of pixels, then it is considered to be noise-dominated and hence unusable.
| Quadrant | # 1 sec bins | Bins with >0 counts | Bins with >2000 counts | High rate bins dominated by noise | Noise dominated (total time) | Noise dominated (detector-on time) | Marked lightcurve |
|---|---|---|---|---|---|---|---|
| A | 14638 | 12766 | 162 | 162 | 1.11% | 1.27% | 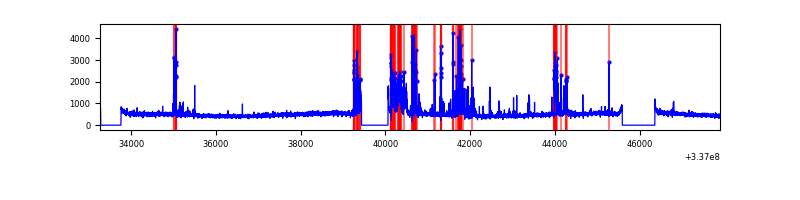 |
| B | 14639 | 12767 | 196 | 196 | 1.34% | 1.54% | 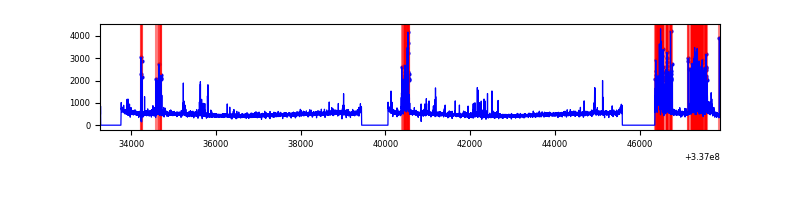 |
| C | 14639 | 12767 | 4 | 4 | 0.03% | 0.03% | 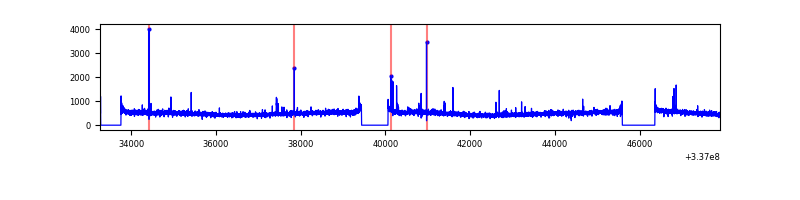 |
| D | 14639 | 12767 | 535 | 535 | 3.65% | 4.19% | 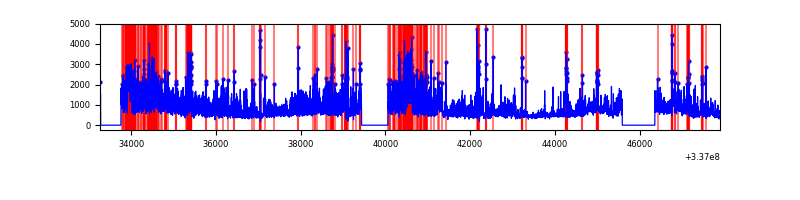 |
Top three noisy pixels from each quadrant. If the there are fewer than three noisy pixels in the level2.evt file, extra rows are filled as -1
| Pixel properties | Quadrant properties | ||||||
|---|---|---|---|---|---|---|---|
| Quadrant | DetID | PixID | Counts | Sigma | Mean | Median | Sigma |
| A | 0 | 13 | 1130801 | 3506.65 | 1586 | 1559 | 322.0 |
| A | 12 | 96 | 23459 | 68.01 | 1586 | 1559 | 322.0 |
| A | 13 | 254 | 22057 | 63.65 | 1586 | 1559 | 322.0 |
| B | 0 | 189 | 728452 | 2437.42 | 1575 | 1538 | 298.2 |
| B | 10 | 246 | 293598 | 979.31 | 1575 | 1538 | 298.2 |
| B | 12 | 111 | 36041 | 115.69 | 1575 | 1538 | 298.2 |
| C | 14 | 238 | 244461 | 671.5 | 1532 | 1546 | 361.7 |
| C | 15 | 208 | 44795 | 119.56 | 1532 | 1546 | 361.7 |
| C | 2 | 16 | 38087 | 101.01 | 1532 | 1546 | 361.7 |
| D | 1 | 52 | 4154384 | 10737.7 | 1502 | 1466 | 386.8 |
| D | 2 | 250 | 514235 | 1325.81 | 1502 | 1466 | 386.8 |
| D | 7 | 80 | 355504 | 915.39 | 1502 | 1466 | 386.8 |
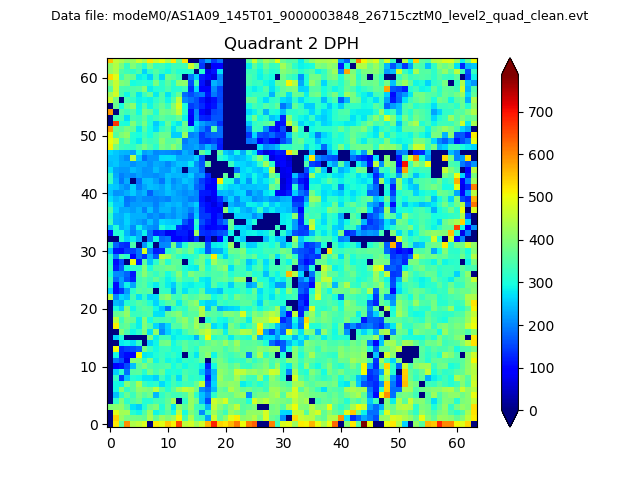
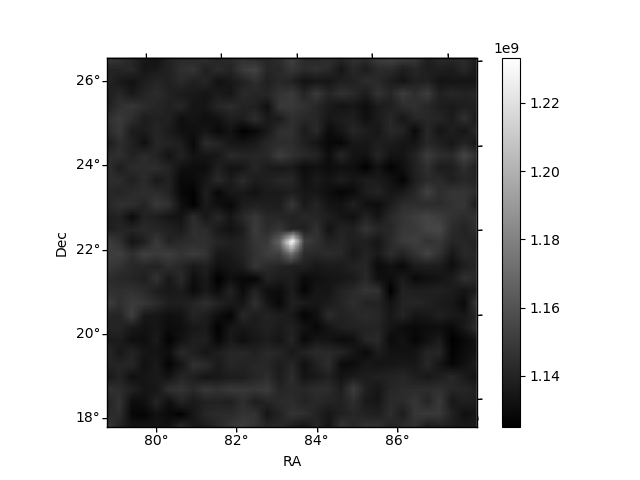
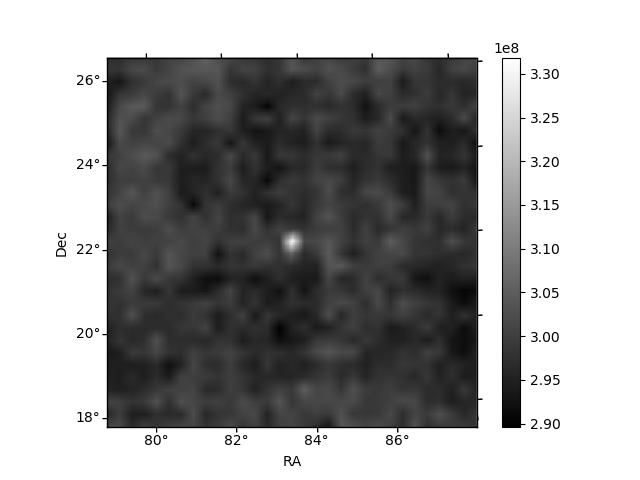
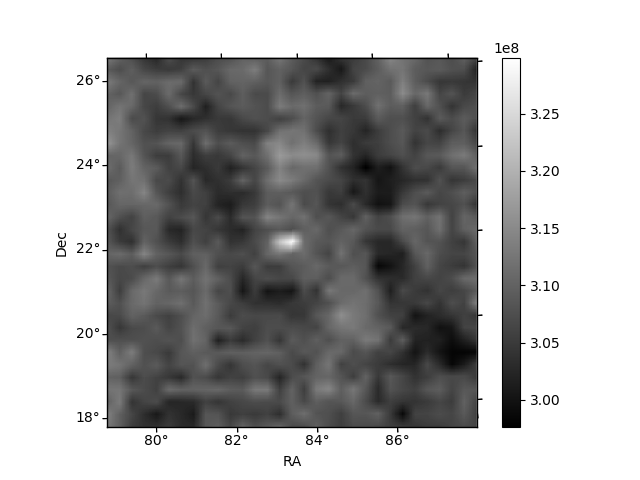
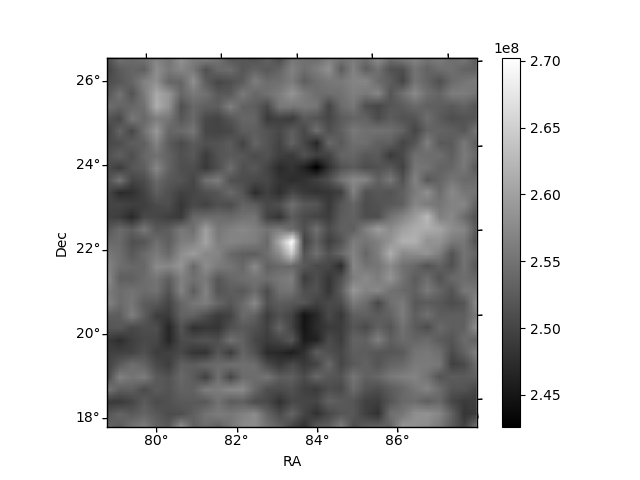
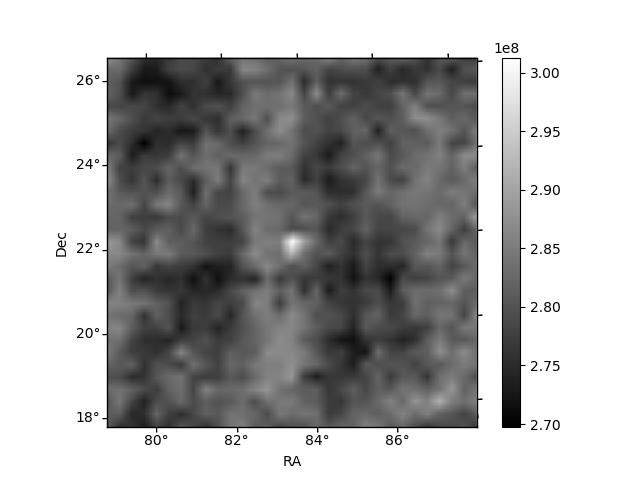
Histogram calculated using DETX and DETY for each event in the final _common_clean file
| Quadrant A | 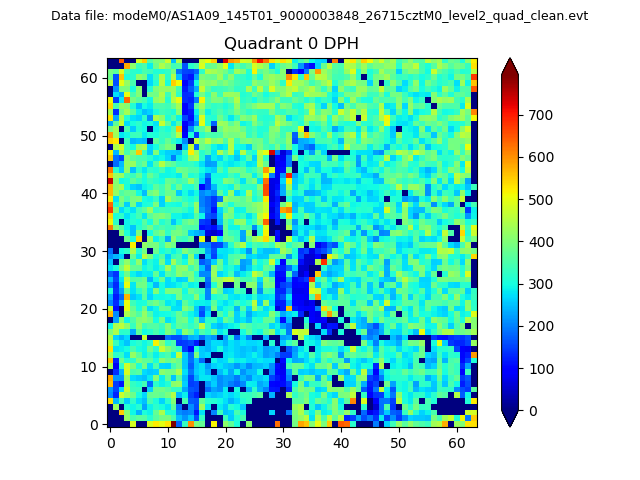 |
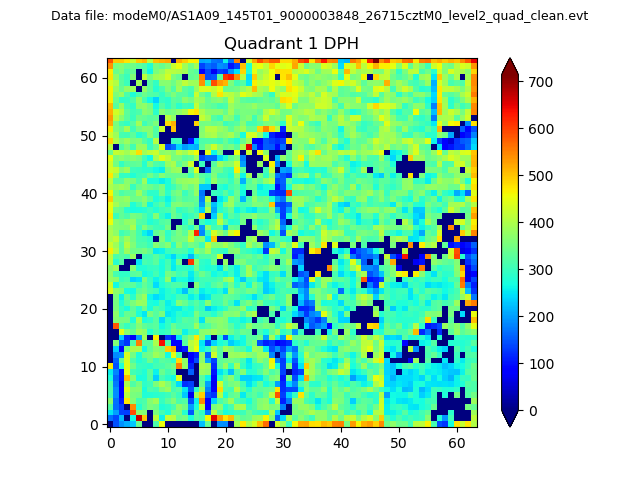 |
Quadrant B |
|---|---|---|---|
| Quadrant D | 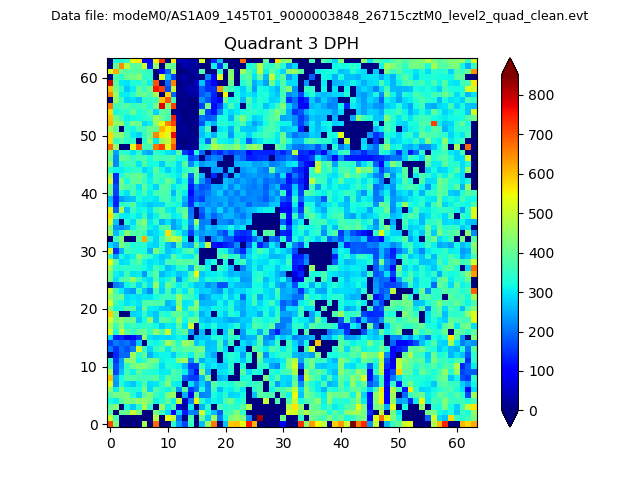 |
 |
Quadrant C |
| Plot type | Count rate plots | Images |
|---|---|---|
| Comparison with Poisson distribution Blue bars denote a histogram of data divided into 1 sec bins. Red curve is a Poisson curve with rate = median count rate of data. |
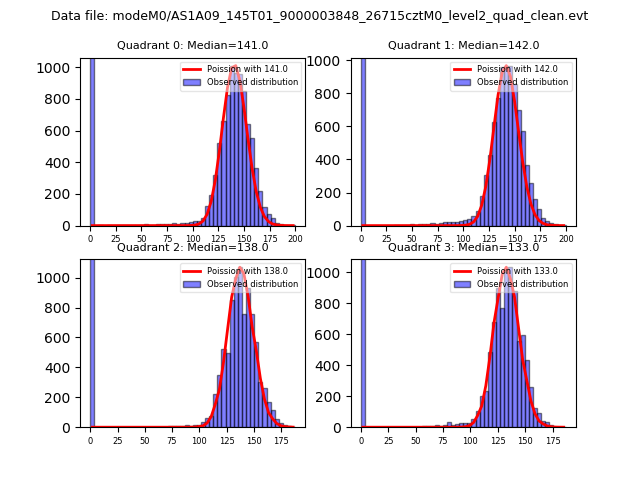 |
 |
| Quadrant-wise count rates Data is divided into 100 sec bins |
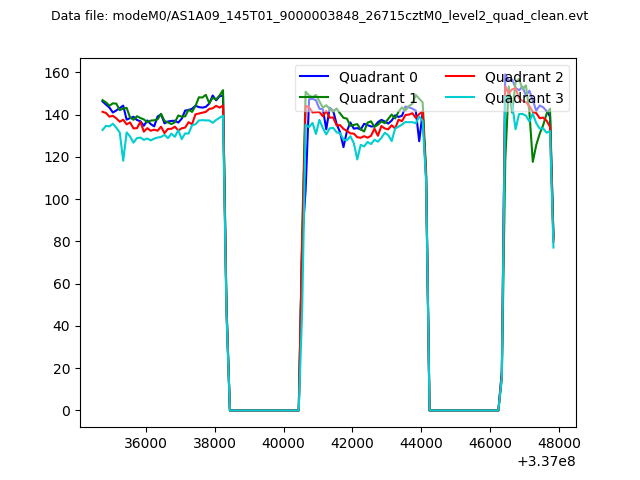 |
|
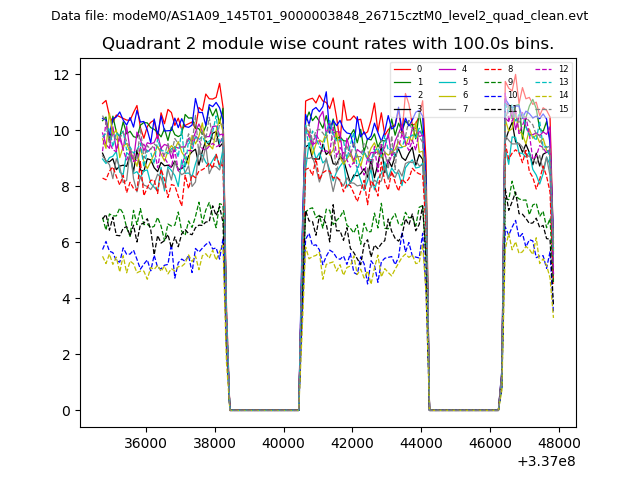
| Module-wise count rates for Quadrant A Data is divided into 100 sec bins |
 |
 |
| Module-wise count rates for Quadrant B Data is divided into 100 sec bins |
 |
 |
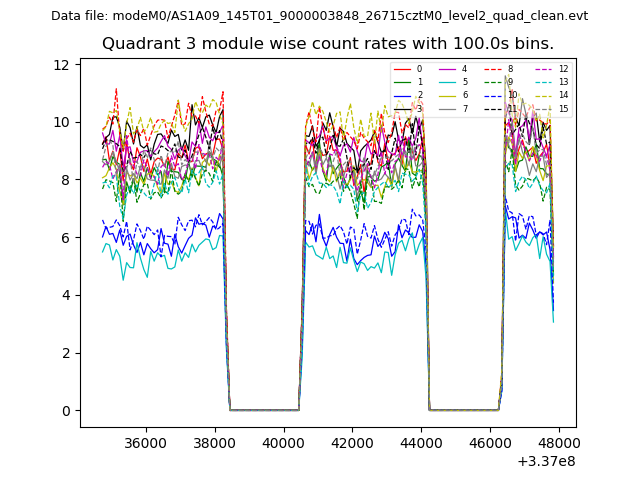
| Module-wise count rates for Quadrant C Data is divided into 100 sec bins |
 |
 |
| Module-wise count rates for Quadrant D Data is divided into 100 sec bins |
 |
 |
| Parameter | Plot |
|---|---|
| CZT HV Monitor |  |
| D_VDD | 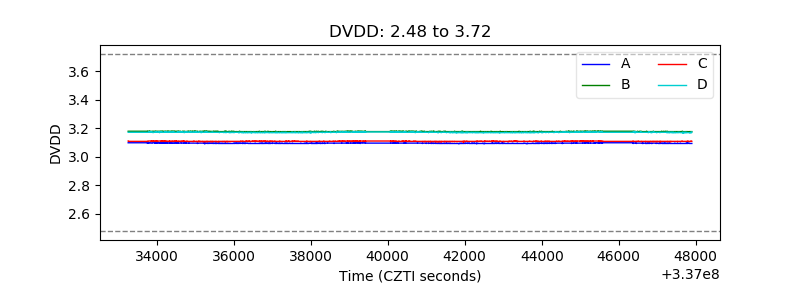 |
| Temperature 1 | 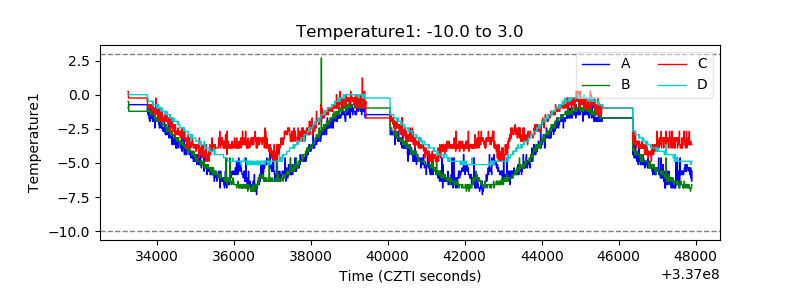 |
| Veto HV Monitor |  |
| Veto LLD | 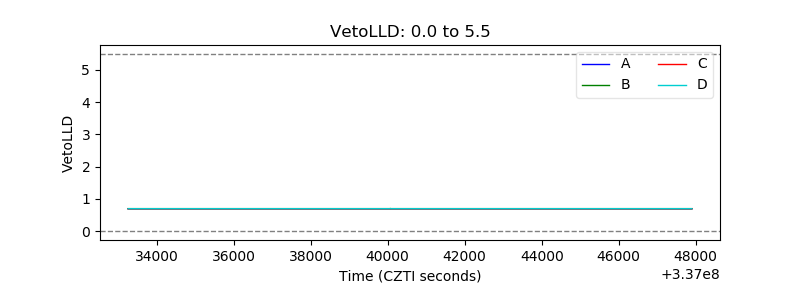 |
| Alpha Counter | 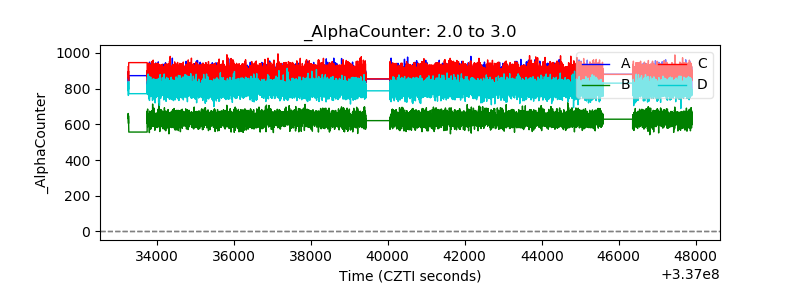 |
| _CPM_Rate | 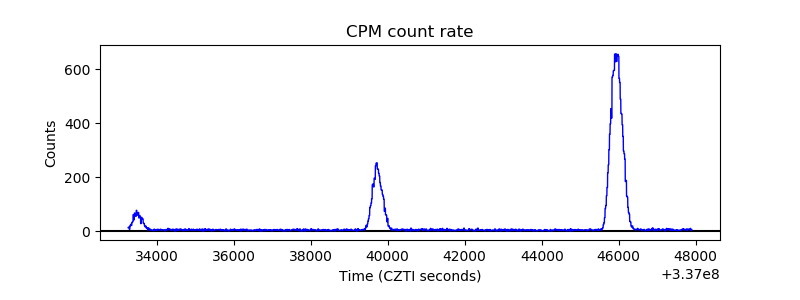 |
| CZT Counter | 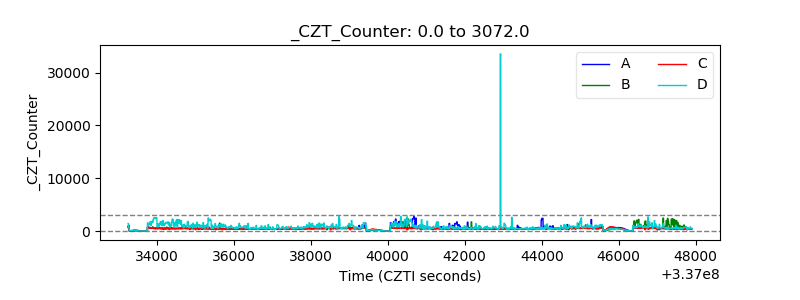 |
| +2.5 Volts monitor |  |
| +5 Volts monitor |  |
| _ROLL_ROT | 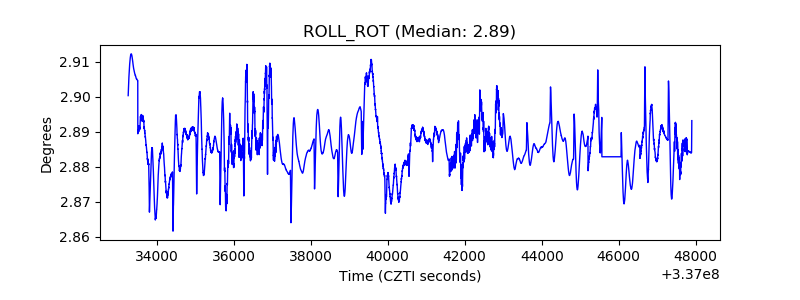 |
| _Roll_DEC | 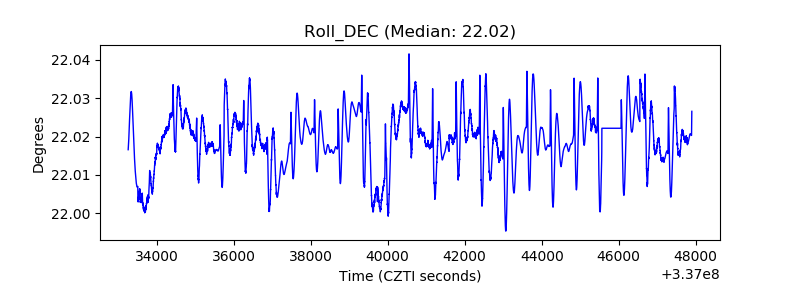 |
| _Roll_RA | 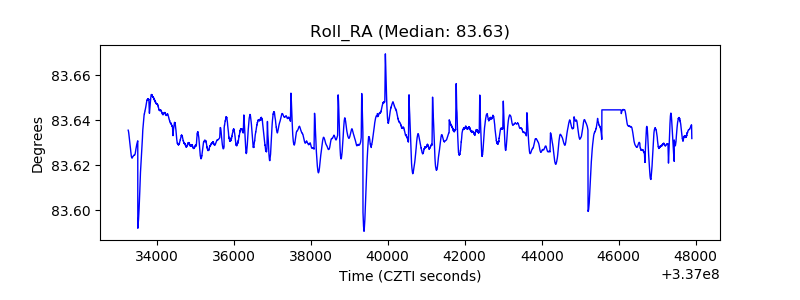 |
| Veto Counter | 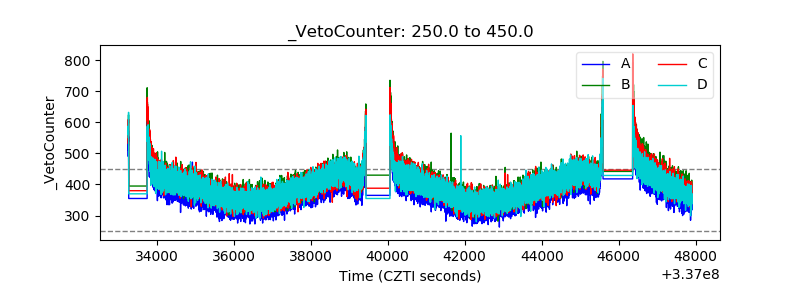 |