| Param | Original file | Final file |
|---|---|---|
| Filename | modeM0/AS1A09_145T01_9000003848_26719cztM0_level2.evt | modeM0/AS1A09_145T01_9000003848_26719cztM0_level2_quad_clean.evt |
| Size (bytes) | 1,007,576,640 | 186,894,720 |
| Size | 960.9 MB | 178.2 MB |
| Events in quadrant A | 6,883,154 | 1,228,959 |
| Events in quadrant B | 6,879,164 | 1,235,538 |
| Events in quadrant C | 5,922,812 | 1,204,569 |
| Events in quadrant D | 10,015,657 | 1,158,431 |
| Mode M0 | |||
|---|---|---|---|
| Quadrant | BADHDUFLAG | Total packets | Discarded packets |
| A | 0 | 28038 | 0 |
| B | 0 | 27987 | 0 |
| C | 0 | 24961 | 0 |
| D | 0 | 38100 | 0 |
| Mode M9 | |||
|---|---|---|---|
| Quadrant | BADHDUFLAG | Total packets | Discarded packets |
| A | 0 | 13 | 0 |
| B | 0 | 13 | 0 |
| C | 0 | 13 | 0 |
| D | 0 | 13 | 0 |
| Quadrant | Total seconds | Saturated seconds | Saturation percentage |
|---|---|---|---|
| A | 12039 | 341 | 2.832461% |
| B | 12040 | 443 | 3.679402% |
| C | 12040 | 168 | 1.395349% |
| D | 12040 | 699 | 5.805648% |
Noise dominated data is calculated using 1-second bins in cleaned event files. If a bin has >2000 counts, and if more than 50% of those come from <1% of pixels, then it is considered to be noise-dominated and hence unusable.
| Quadrant | # 1 sec bins | Bins with >0 counts | Bins with >2000 counts | High rate bins dominated by noise | Noise dominated (total time) | Noise dominated (detector-on time) | Marked lightcurve |
|---|---|---|---|---|---|---|---|
| A | 13434 | 12041 | 162 | 162 | 1.21% | 1.35% | 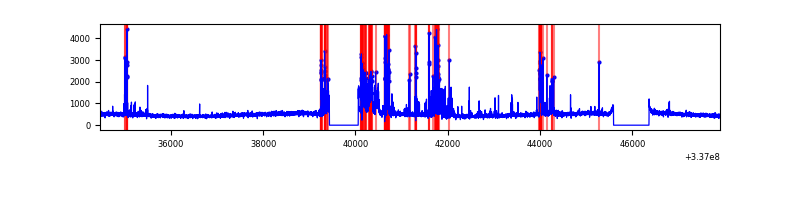 |
| B | 13435 | 12042 | 192 | 192 | 1.43% | 1.59% | 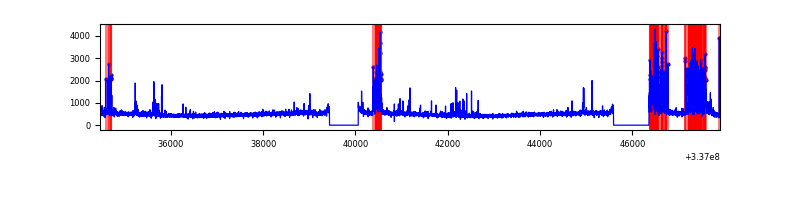 |
| C | 13435 | 12042 | 3 | 3 | 0.02% | 0.02% | 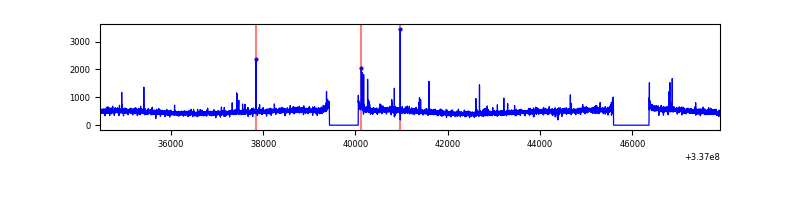 |
| D | 13435 | 12042 | 388 | 388 | 2.89% | 3.22% | 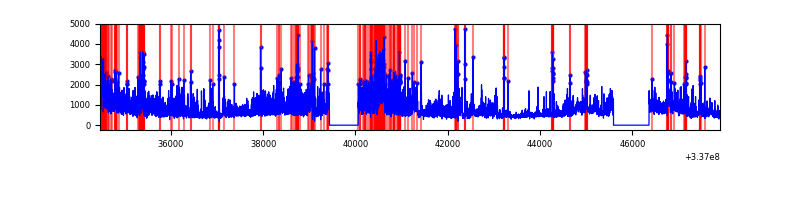 |
Top three noisy pixels from each quadrant. If the there are fewer than three noisy pixels in the level2.evt file, extra rows are filled as -1
| Pixel properties | Quadrant properties | ||||||
|---|---|---|---|---|---|---|---|
| Quadrant | DetID | PixID | Counts | Sigma | Mean | Median | Sigma |
| A | 0 | 13 | 1129694 | 3734.68 | 1485 | 1458 | 302.1 |
| A | 12 | 96 | 23345 | 72.45 | 1485 | 1458 | 302.1 |
| A | 13 | 254 | 20774 | 63.94 | 1485 | 1458 | 302.1 |
| B | 0 | 189 | 728393 | 2591.83 | 1475 | 1440 | 280.5 |
| B | 10 | 246 | 287870 | 1021.22 | 1475 | 1440 | 280.5 |
| B | 12 | 111 | 33778 | 115.29 | 1475 | 1440 | 280.5 |
| C | 14 | 238 | 229331 | 672.03 | 1436 | 1451 | 339.1 |
| C | 15 | 208 | 44679 | 127.48 | 1436 | 1451 | 339.1 |
| C | 3 | 233 | 29496 | 82.71 | 1436 | 1451 | 339.1 |
| D | 1 | 52 | 3436111 | 9436.9 | 1416 | 1382 | 364.0 |
| D | 2 | 250 | 501861 | 1375.06 | 1416 | 1382 | 364.0 |
| D | 7 | 80 | 353818 | 968.32 | 1416 | 1382 | 364.0 |
Histogram calculated using DETX and DETY for each event in the final _common_clean file
| Quadrant A | 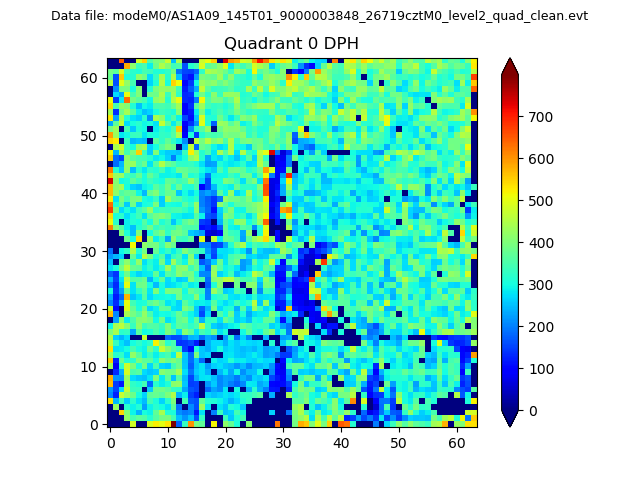 |
 |
Quadrant B |
|---|---|---|---|
| Quadrant D | 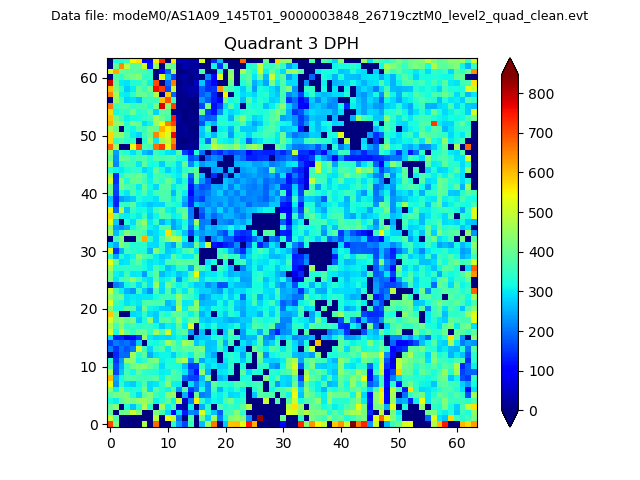 |
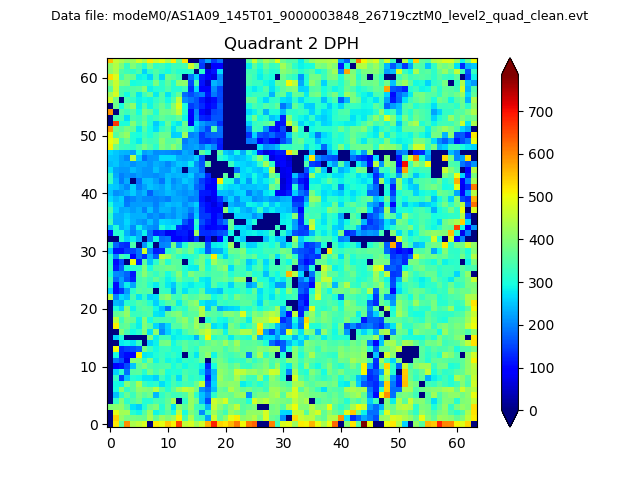 |
Quadrant C |
| Plot type | Count rate plots | Images |
|---|---|---|
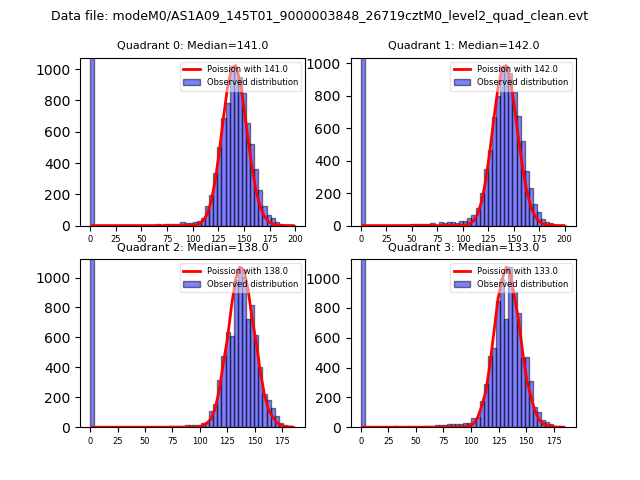
| Comparison with Poisson distribution Blue bars denote a histogram of data divided into 1 sec bins. Red curve is a Poisson curve with rate = median count rate of data. |
 |
 |
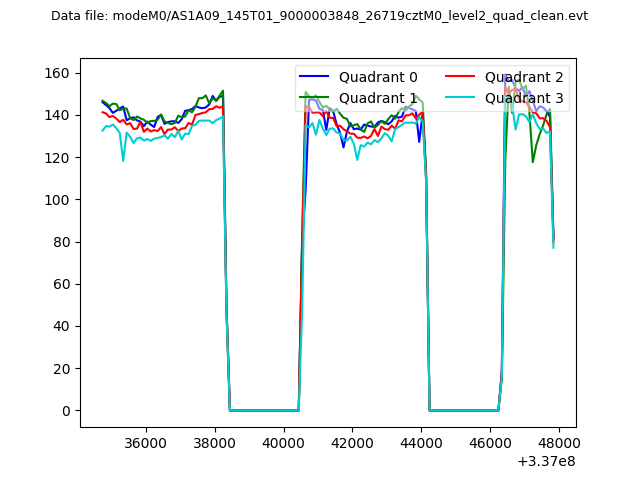
| Quadrant-wise count rates Data is divided into 100 sec bins |
 |
|
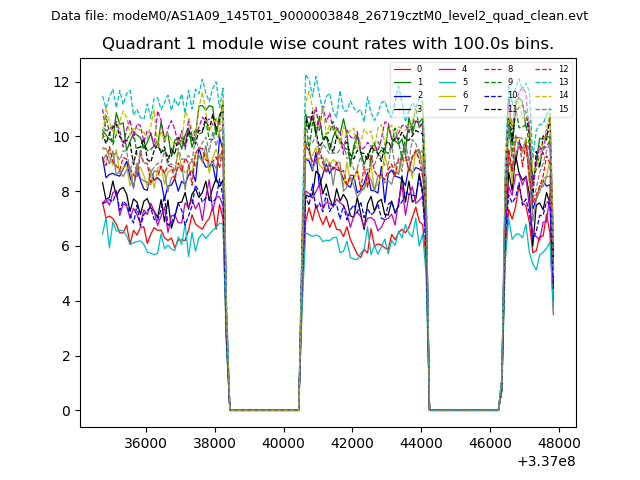
| Module-wise count rates for Quadrant A Data is divided into 100 sec bins |
 |
 |
| Module-wise count rates for Quadrant B Data is divided into 100 sec bins |
 |
 |
| Module-wise count rates for Quadrant C Data is divided into 100 sec bins |
 |
 |
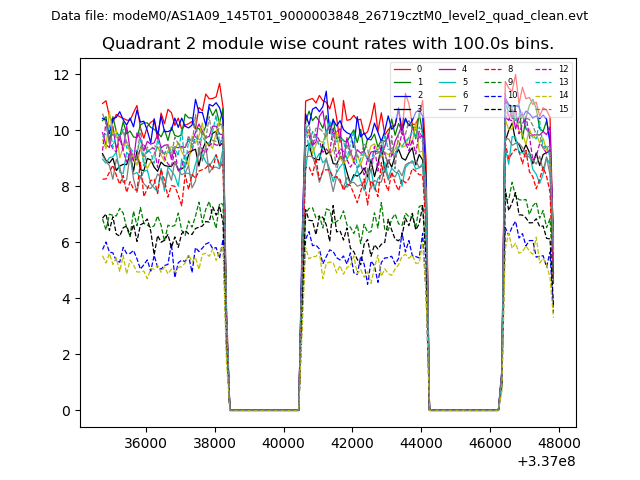
| Module-wise count rates for Quadrant D Data is divided into 100 sec bins |
 |
 |
| Parameter | Plot |
|---|---|
| CZT HV Monitor |  |
| D_VDD | 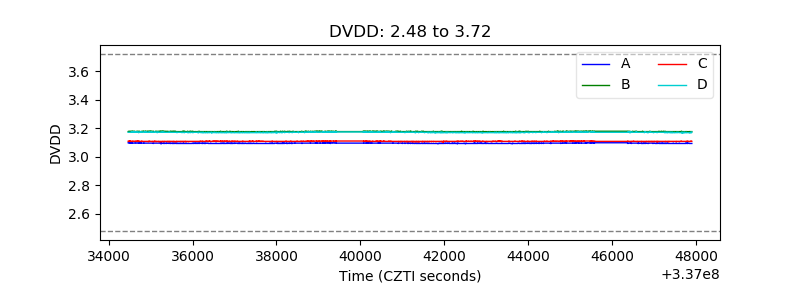 |
| Temperature 1 | 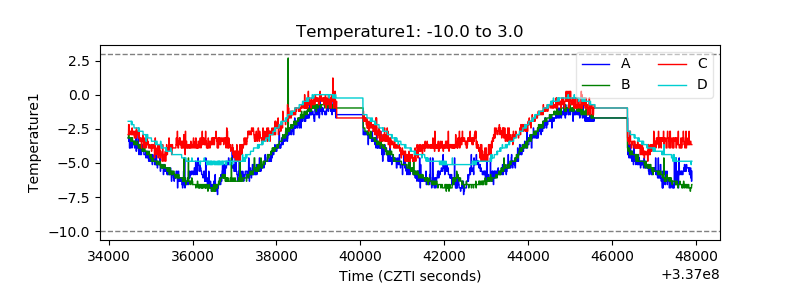 |
| Veto HV Monitor | 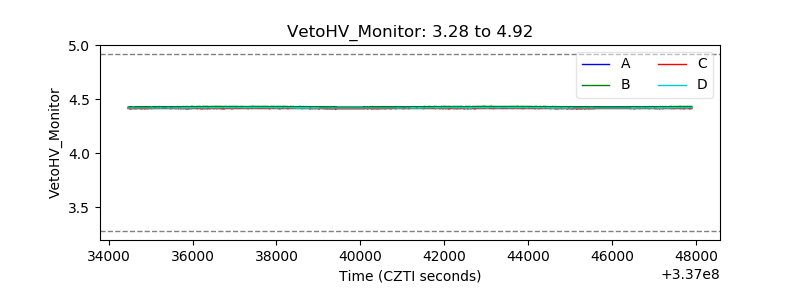 |
| Veto LLD | 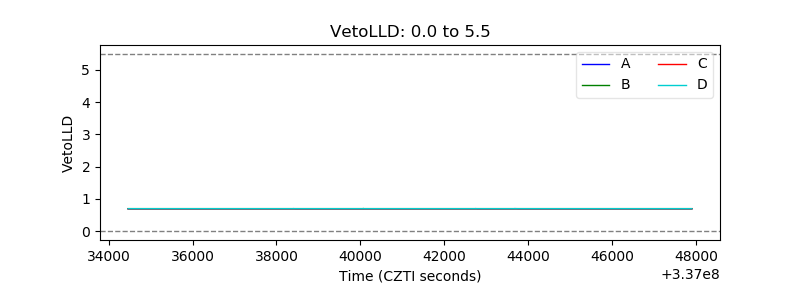 |
| Alpha Counter | 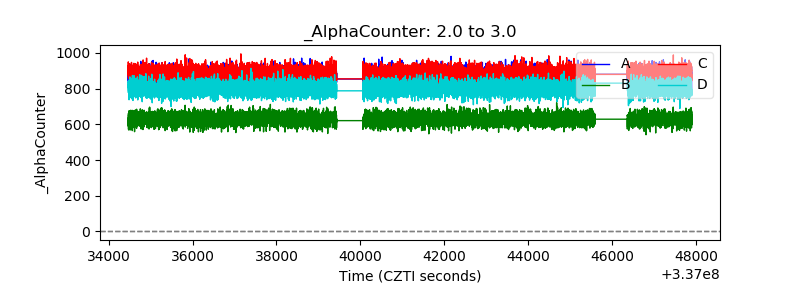 |
| _CPM_Rate | 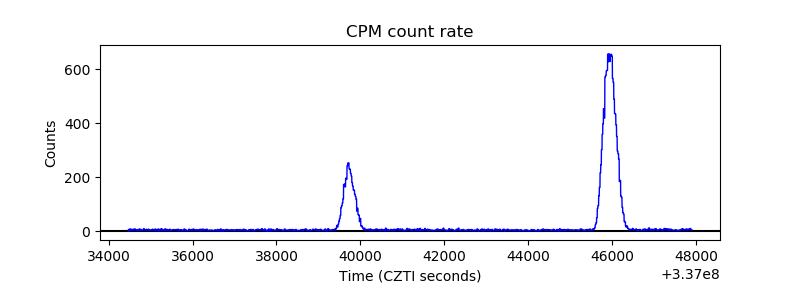 |
| CZT Counter | 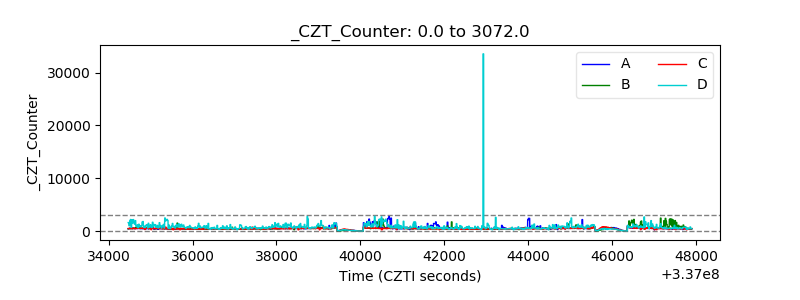 |
| +2.5 Volts monitor |  |
| +5 Volts monitor |  |
| _ROLL_ROT | 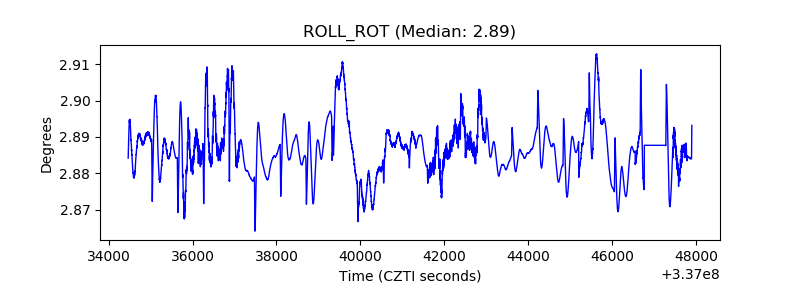 |
| _Roll_DEC | 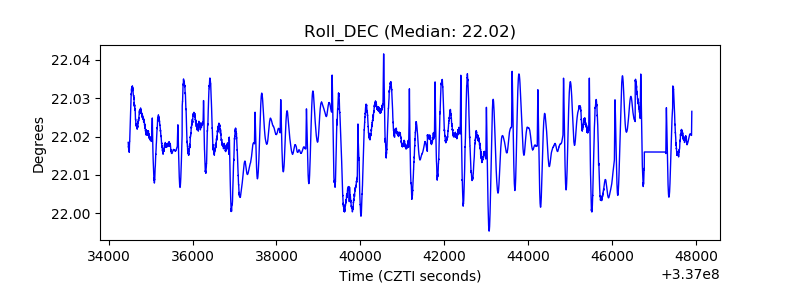 |
| _Roll_RA | 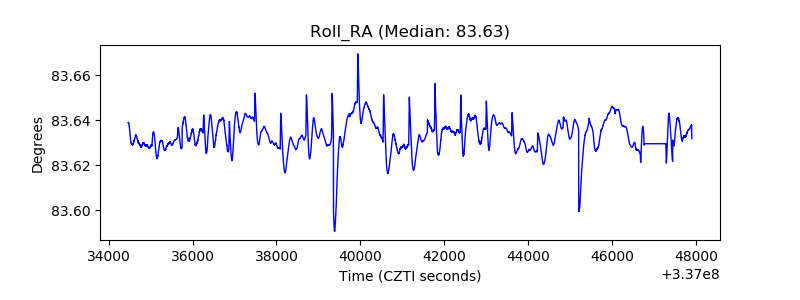 |
| Veto Counter | 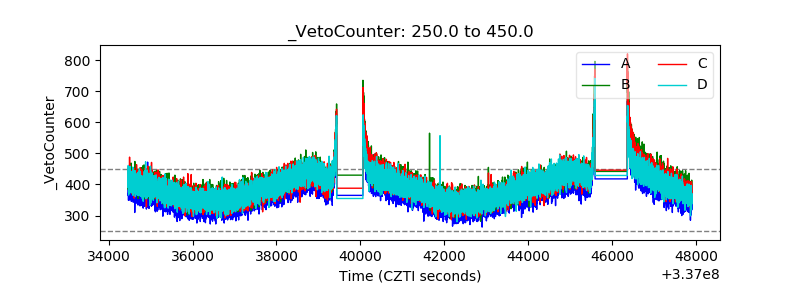 |