| Param | Original file | Final file |
|---|---|---|
| Filename | modeM0/AS1T03_223T01_9000003850cztM0_level2.fits | modeM0/AS1T03_223T01_9000003850cztM0_level2_quad_clean.evt |
| Size (bytes) | 1,986,494,400 | 1,571,114,880 |
| Size | 1.9 GB | 1.5 GB |
| Events in quadrant A | 12,852,278 | 9,266,106 |
| Events in quadrant B | 10,464,486 | 7,489,057 |
| Events in quadrant C | 12,399,884 | 9,036,332 |
| Events in quadrant D | 10,365,912 | 7,739,444 |
| Mode SS | |||
|---|---|---|---|
| Quadrant | BADHDUFLAG | Total packets | Discarded packets |
| A | 0 | 4169 | 0 |
| B | 0 | 4182 | 0 |
| C | 0 | 4176 | 0 |
| D | 0 | 4173 | 0 |
| Mode M9 | |||
|---|---|---|---|
| Quadrant | BADHDUFLAG | Total packets | Discarded packets |
| A | 0 | 334 | 0 |
| B | 0 | 335 | 0 |
| C | 0 | 331 | 0 |
| D | 0 | 333 | 0 |
| Mode M0 | |||
|---|---|---|---|
| Quadrant | BADHDUFLAG | Total packets | Discarded packets |
| A | 0 | 459169 | 0 |
| B | 0 | 800086 | 0 |
| C | 0 | 436270 | 0 |
| D | 0 | 674697 | 0 |
| Quadrant | Total seconds | Saturated seconds | Saturation percentage |
|---|---|---|---|
| A | 205166 | 3402 | 1.658169% |
| B | 204824 | 52192 | 25.481389% |
| C | 205177 | 3883 | 1.892512% |
| D | 204984 | 22749 | 11.097939% |
Noise dominated data is calculated using 1-second bins in cleaned event files. If a bin has >2000 counts, and if more than 50% of those come from <1% of pixels, then it is considered to be noise-dominated and hence unusable.
| Quadrant | # 1 sec bins | Bins with >0 counts | Bins with >2000 counts | High rate bins dominated by noise | Noise dominated (total time) | Noise dominated (detector-on time) | Marked lightcurve |
|---|---|---|---|---|---|---|---|
| A | 244015 | 205374 | 0 | 0 | 0.00% | 0.00% | 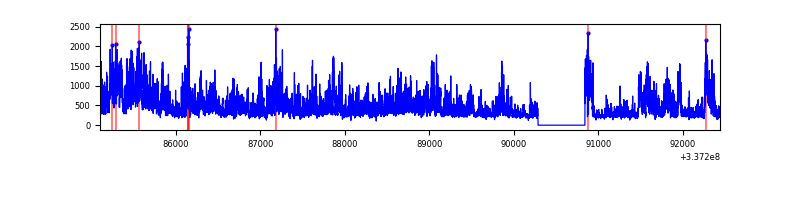 |
| B | 244015 | 202730 | 0 | 0 | 0.00% | 0.00% | 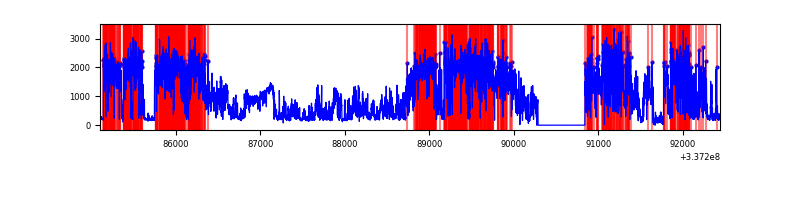 |
| C | 244015 | 205393 | 0 | 0 | 0.00% | 0.00% | 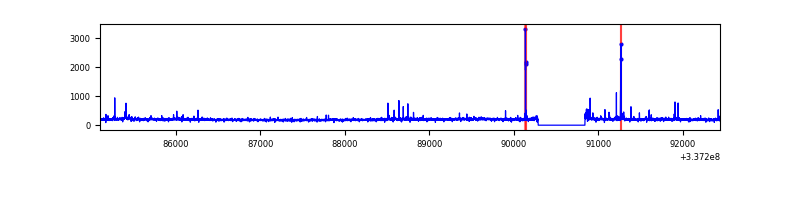 |
| D | 244015 | 204722 | 0 | 0 | 0.00% | 0.00% | 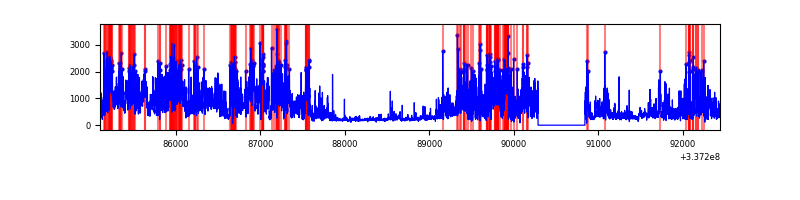 |
Top three noisy pixels from each quadrant. If the there are fewer than three noisy pixels in the level2.evt file, extra rows are filled as -1
| Pixel properties | Quadrant properties | ||||||
|---|---|---|---|---|---|---|---|
| Quadrant | DetID | PixID | Counts | Sigma | Mean | Median | Sigma |
| A | 0 | 29 | 10578 | 9.25 | 3349 | 3149 | 803.3 |
| A | 7 | 110 | 10128 | 8.69 | 3349 | 3149 | 803.3 |
| A | 9 | 19 | 9606 | 8.04 | 3349 | 3149 | 803.3 |
| B | 2 | 9 | 8484 | 10.92 | 2766 | 2647 | 534.7 |
| B | 2 | 8 | 6997 | 8.14 | 2766 | 2647 | 534.7 |
| B | 5 | 255 | 6826 | 7.82 | 2766 | 2647 | 534.7 |
| C | 1 | 81 | 9609 | 7.99 | 3274 | 3073 | 817.6 |
| C | 1 | 80 | 9508 | 7.87 | 3274 | 3073 | 817.6 |
| C | 12 | 241 | 8753 | 6.95 | 3274 | 3073 | 817.6 |
| D | 3 | 14 | 7570 | 6.26 | 2959 | 2704 | 777.5 |
| D | 10 | 189 | 7267 | 5.87 | 2959 | 2704 | 777.5 |
| D | 15 | 46 | 7232 | 5.82 | 2959 | 2704 | 777.5 |
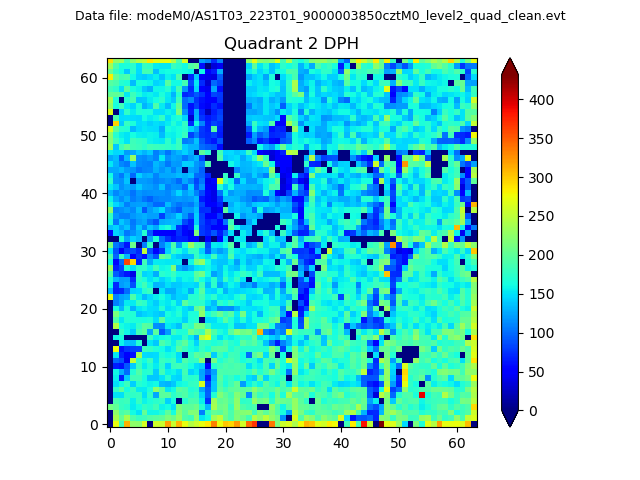
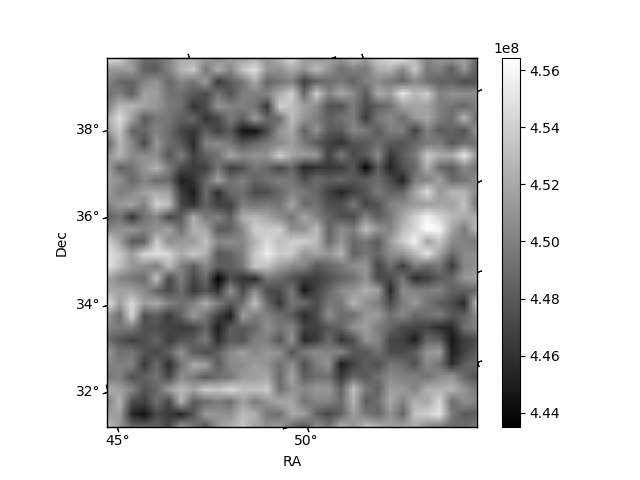
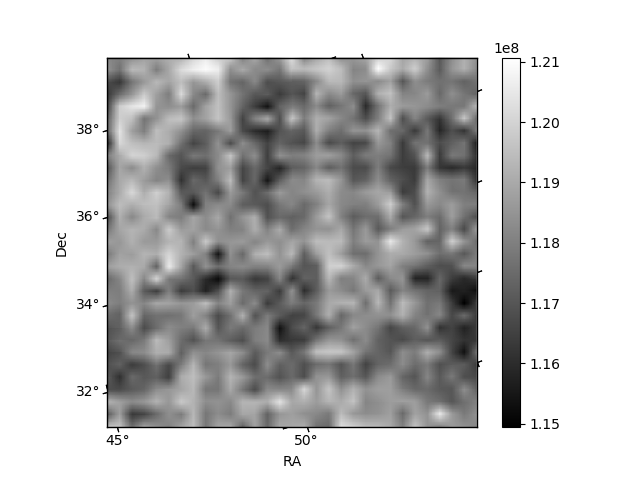
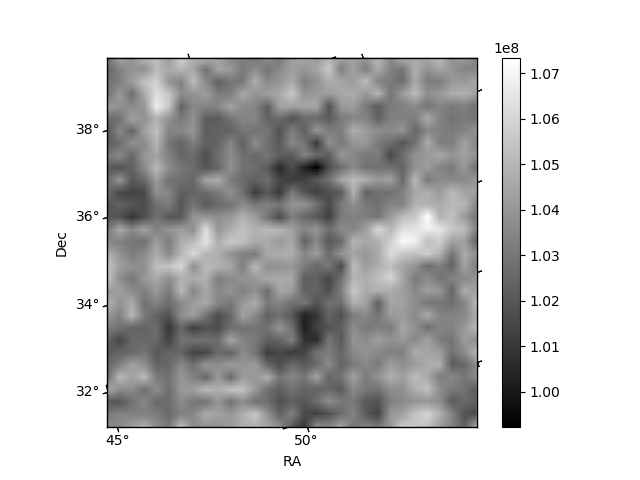
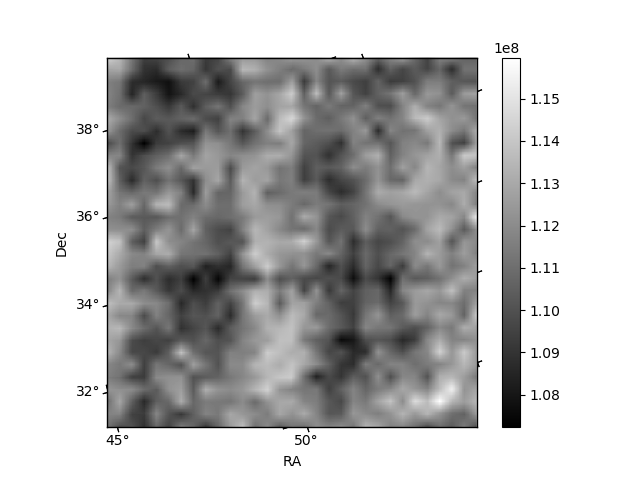
Histogram calculated using DETX and DETY for each event in the final _common_clean file
| Quadrant A | 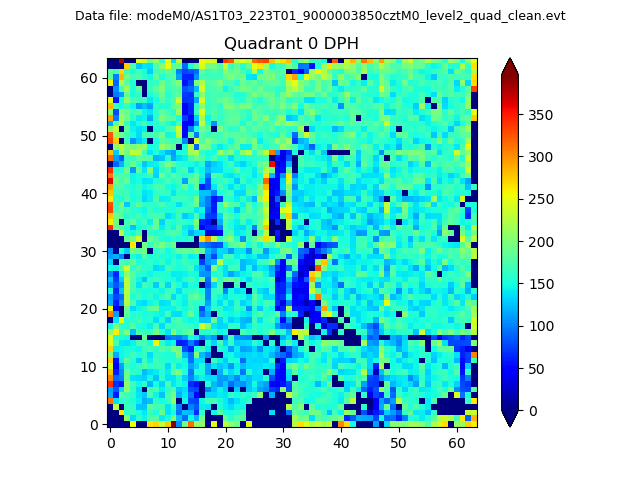 |
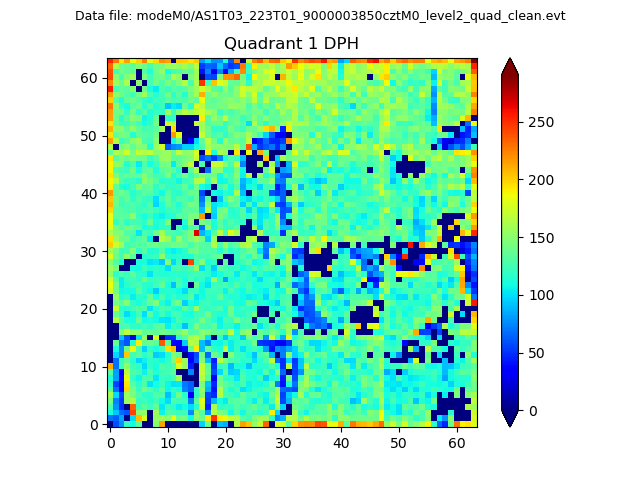 |
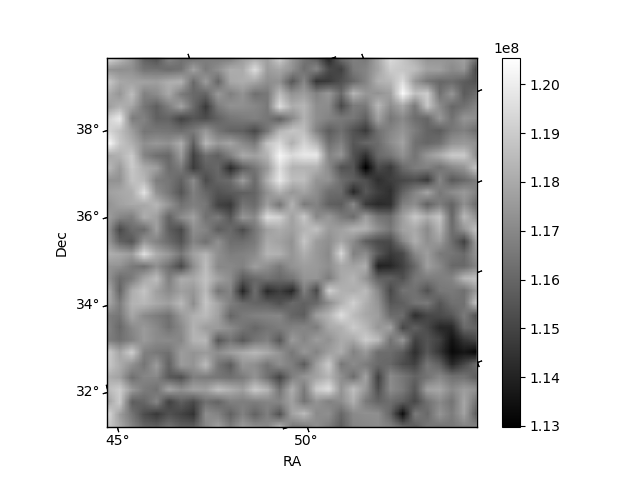
Quadrant B |
|---|---|---|---|
| Quadrant D | 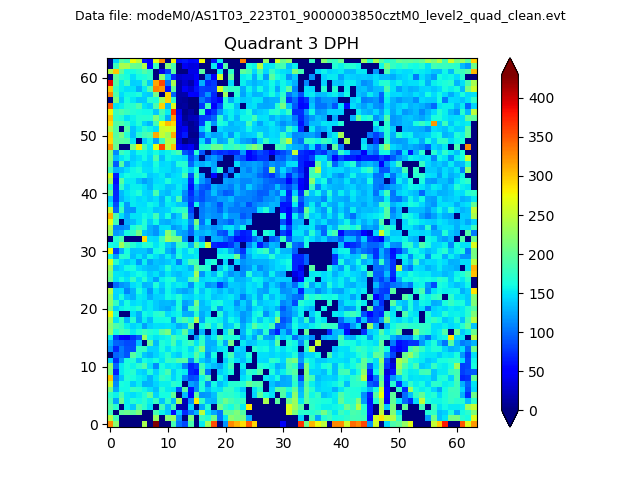 |
 |
Quadrant C |
| Plot type | Count rate plots | Images |
|---|---|---|
| Comparison with Poisson distribution Blue bars denote a histogram of data divided into 1 sec bins. Red curve is a Poisson curve with rate = median count rate of data. |
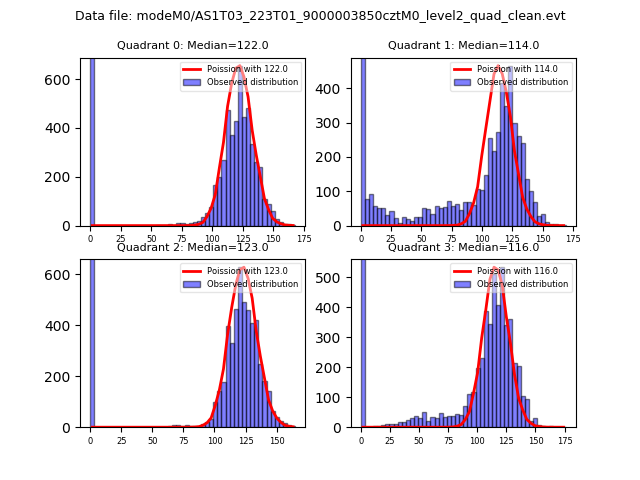 |
 |
| Quadrant-wise count rates Data is divided into 100 sec bins |
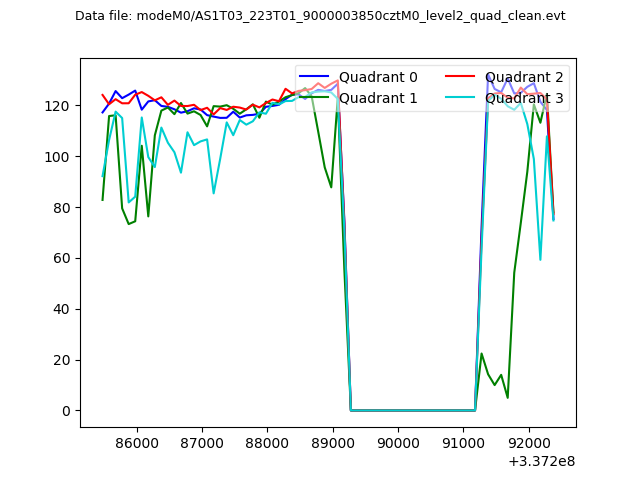 |
|
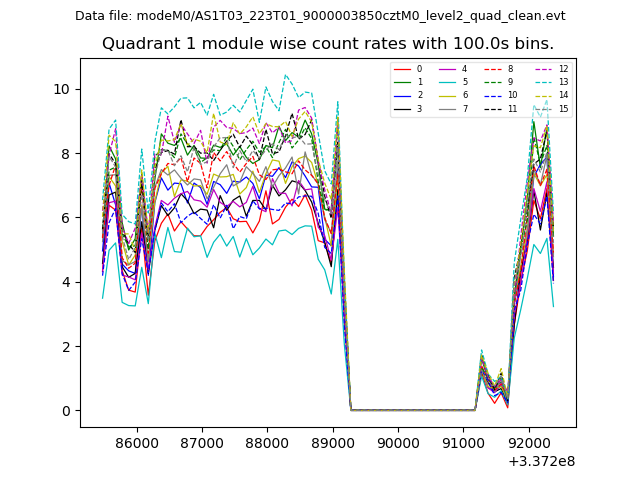
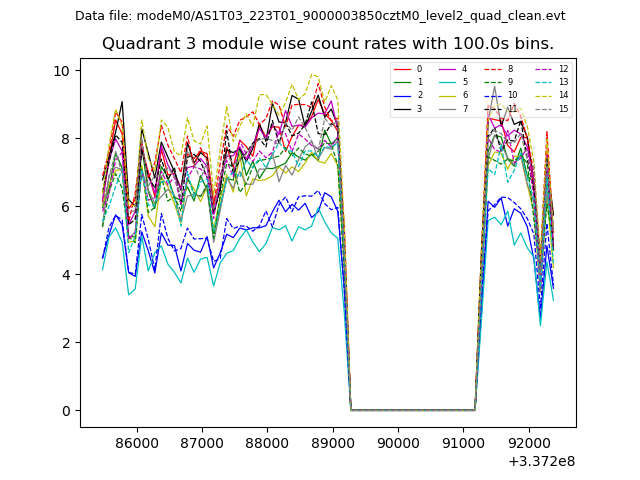
| Module-wise count rates for Quadrant A Data is divided into 100 sec bins |
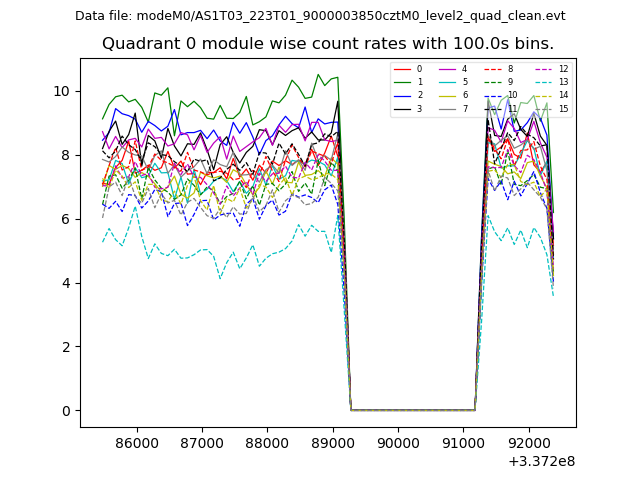 |
 |
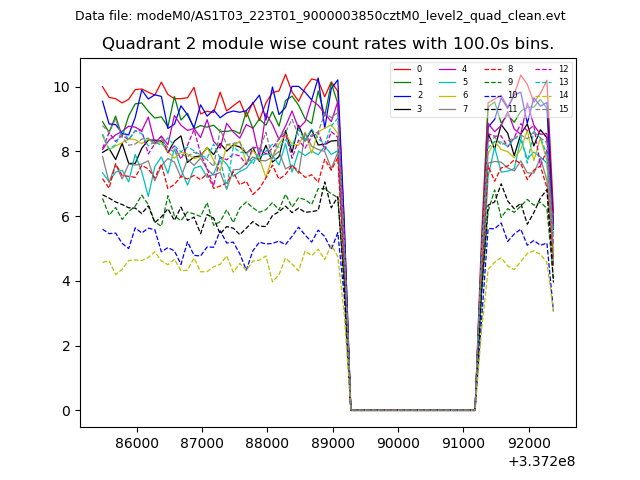
| Module-wise count rates for Quadrant B Data is divided into 100 sec bins |
 |
 |
| Module-wise count rates for Quadrant C Data is divided into 100 sec bins |
 |
 |
| Module-wise count rates for Quadrant D Data is divided into 100 sec bins |
 |
 |
| Parameter | Plot |
|---|---|
| CZT HV Monitor | 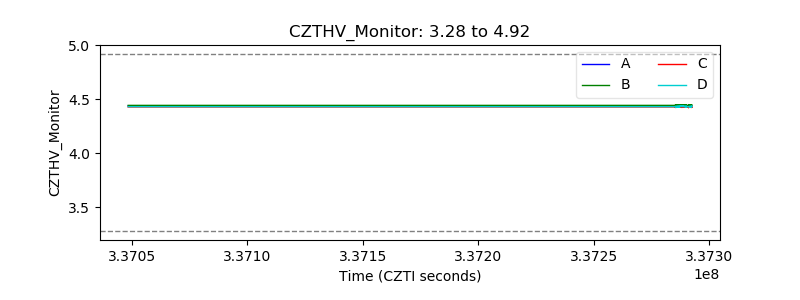 |
| D_VDD | 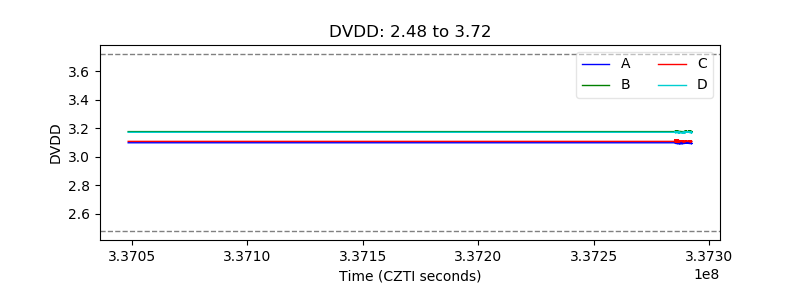 |
| Temperature 1 | 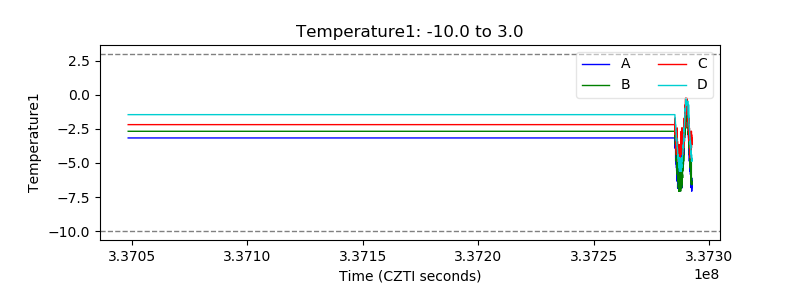 |
| Veto HV Monitor | 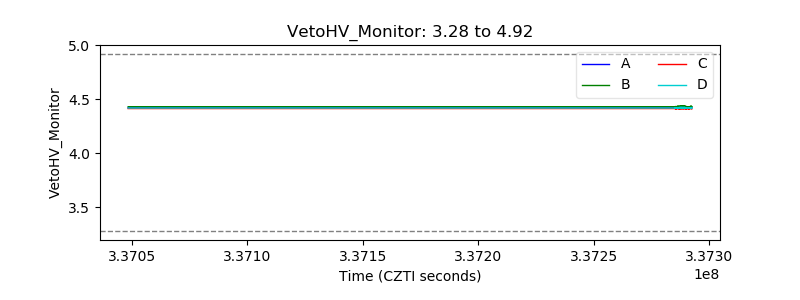 |
| Veto LLD | 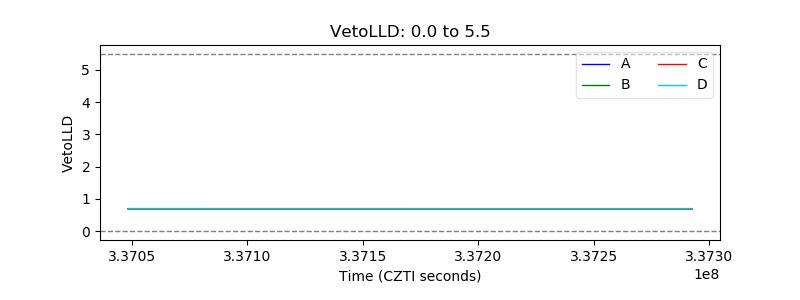 |
| Alpha Counter | 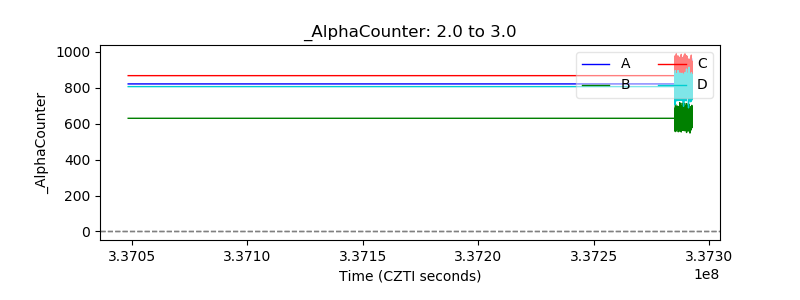 |
| _CPM_Rate | 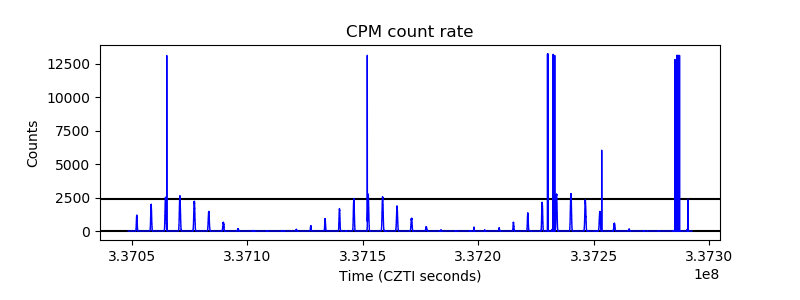 |
| CZT Counter | 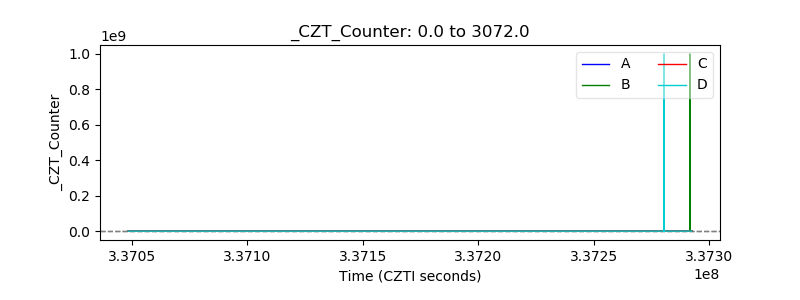 |
| +2.5 Volts monitor | 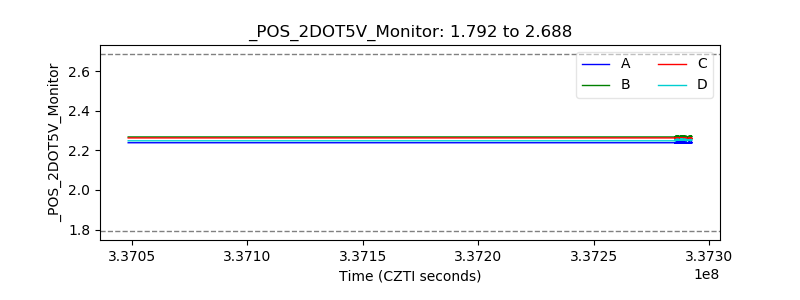 |
| +5 Volts monitor | 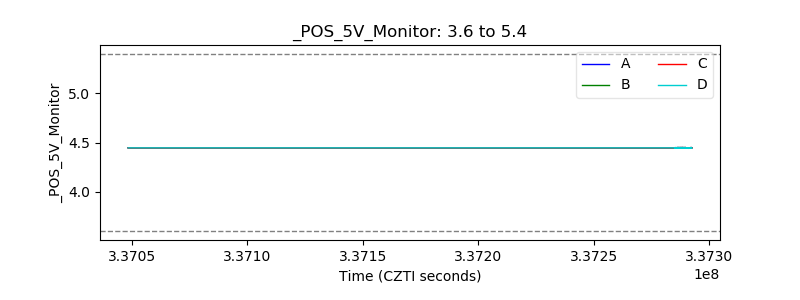 |
| _ROLL_ROT | 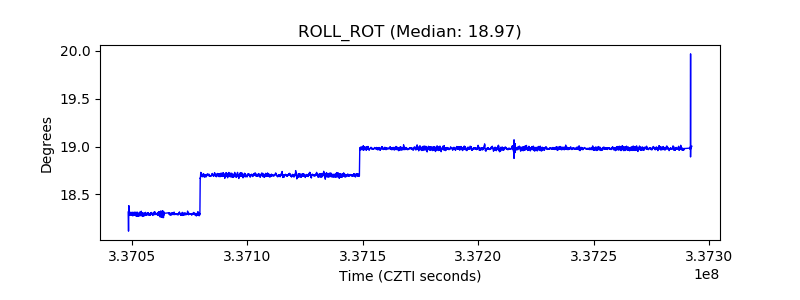 |
| _Roll_DEC | 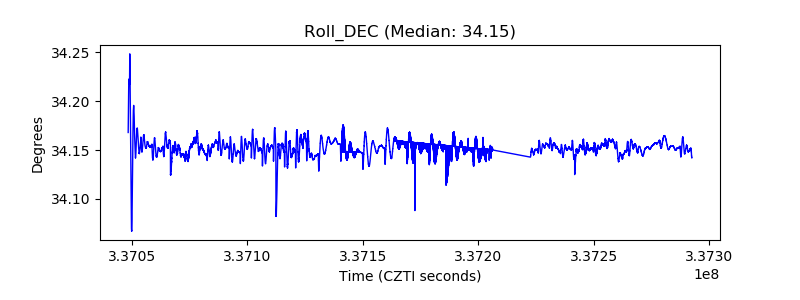 |
| _Roll_RA | 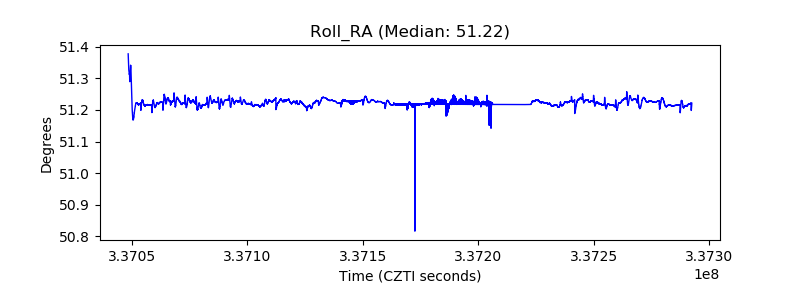 |
| Veto Counter | 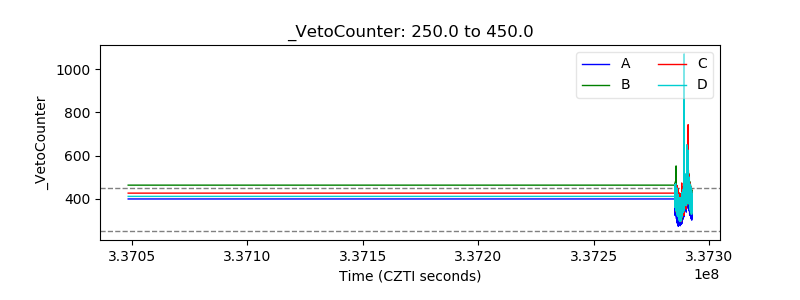 |