| Param | Original file | Final file |
|---|---|---|
| Filename | modeM0/AS1T03_223T01_9000003850_26716cztM0_level2.evt | modeM0/AS1T03_223T01_9000003850_26716cztM0_level2_quad_clean.evt |
| Size (bytes) | 363,216,960 | 52,770,240 |
| Size | 346.4 MB | 50.3 MB |
| Events in quadrant A | 2,281,360 | 328,793 |
| Events in quadrant B | 3,448,461 | 319,561 |
| Events in quadrant C | 2,178,086 | 325,064 |
| Events in quadrant D | 2,784,184 | 306,250 |
| Mode M9 | |||
|---|---|---|---|
| Quadrant | BADHDUFLAG | Total packets | Discarded packets |
| A | 0 | 11 | 0 |
| B | 0 | 11 | 0 |
| C | 0 | 11 | 0 |
| D | 0 | 11 | 0 |
| Mode M0 | |||
|---|---|---|---|
| Quadrant | BADHDUFLAG | Total packets | Discarded packets |
| A | 0 | 9457 | 0 |
| B | 0 | 13057 | 0 |
| C | 0 | 9148 | 0 |
| D | 0 | 11227 | 0 |
| Quadrant | Total seconds | Saturated seconds | Saturation percentage |
|---|---|---|---|
| A | 4405 | 46 | 1.044268% |
| B | 4349 | 346 | 7.955852% |
| C | 4416 | 53 | 1.200181% |
| D | 4366 | 80 | 1.832341% |
Noise dominated data is calculated using 1-second bins in cleaned event files. If a bin has >2000 counts, and if more than 50% of those come from <1% of pixels, then it is considered to be noise-dominated and hence unusable.
| Quadrant | # 1 sec bins | Bins with >0 counts | Bins with >2000 counts | High rate bins dominated by noise | Noise dominated (total time) | Noise dominated (detector-on time) | Marked lightcurve |
|---|---|---|---|---|---|---|---|
| A | 7707 | 4640 | 10 | 10 | 0.13% | 0.22% | 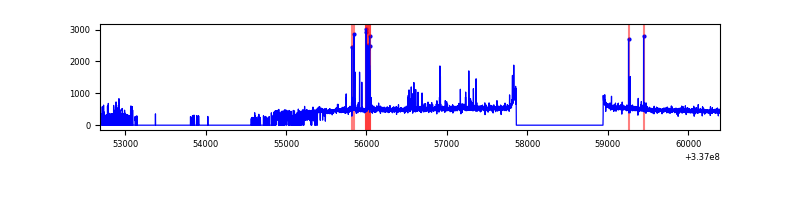 |
| B | 7689 | 4553 | 190 | 190 | 2.47% | 4.17% | 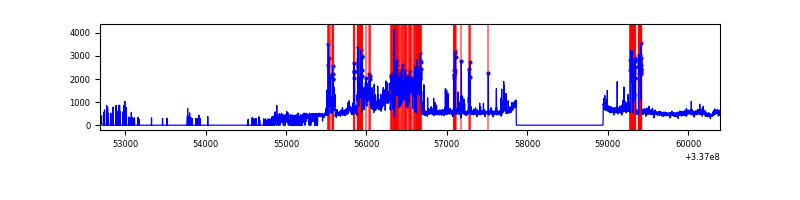 |
| C | 7685 | 4643 | 1 | 1 | 0.01% | 0.02% | 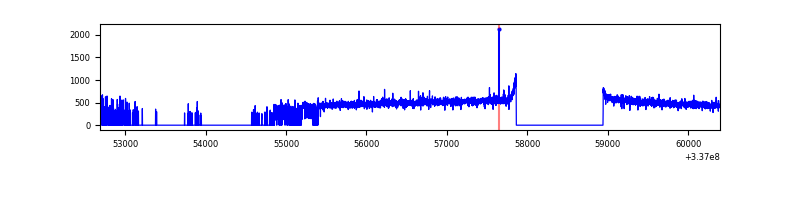 |
| D | 7687 | 4601 | 29 | 29 | 0.38% | 0.63% | 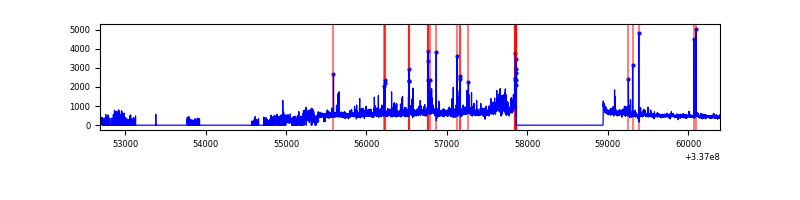 |
Top three noisy pixels from each quadrant. If the there are fewer than three noisy pixels in the level2.evt file, extra rows are filled as -1
| Pixel properties | Quadrant properties | ||||||
|---|---|---|---|---|---|---|---|
| Quadrant | DetID | PixID | Counts | Sigma | Mean | Median | Sigma |
| A | 0 | 13 | 128987 | 1145.01 | 556 | 543 | 112.2 |
| A | 13 | 254 | 7894 | 65.53 | 556 | 543 | 112.2 |
| A | 3 | 137 | 5091 | 40.54 | 556 | 543 | 112.2 |
| B | 0 | 189 | 913276 | 8923.97 | 531 | 518 | 102.3 |
| B | 10 | 246 | 446456 | 4359.9 | 531 | 518 | 102.3 |
| B | 12 | 111 | 12198 | 114.19 | 531 | 518 | 102.3 |
| C | 14 | 238 | 85928 | 683.04 | 532 | 534 | 125.0 |
| C | 3 | 233 | 12871 | 98.68 | 532 | 534 | 125.0 |
| C | 15 | 208 | 5997 | 43.7 | 532 | 534 | 125.0 |
| D | 1 | 52 | 610216 | 4235.98 | 523 | 511 | 143.9 |
| D | 2 | 250 | 91747 | 633.87 | 523 | 511 | 143.9 |
| D | 12 | 233 | 54854 | 377.55 | 523 | 511 | 143.9 |
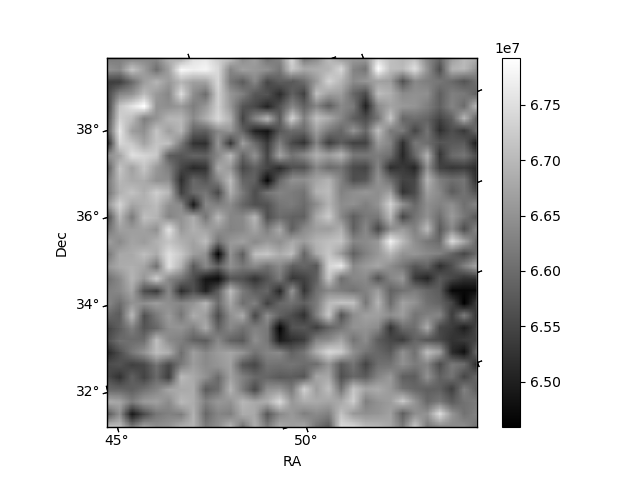
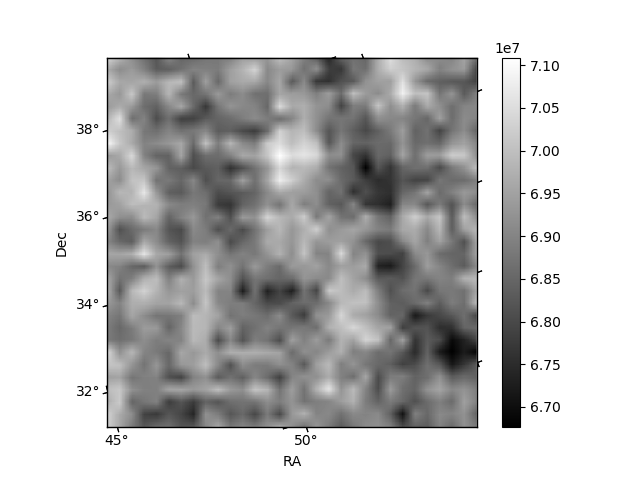
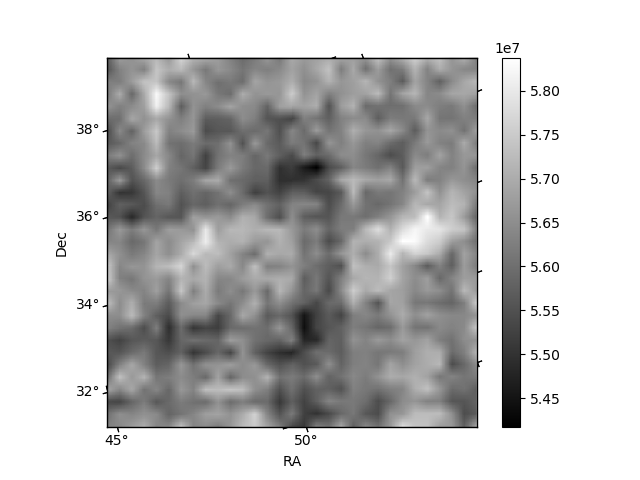
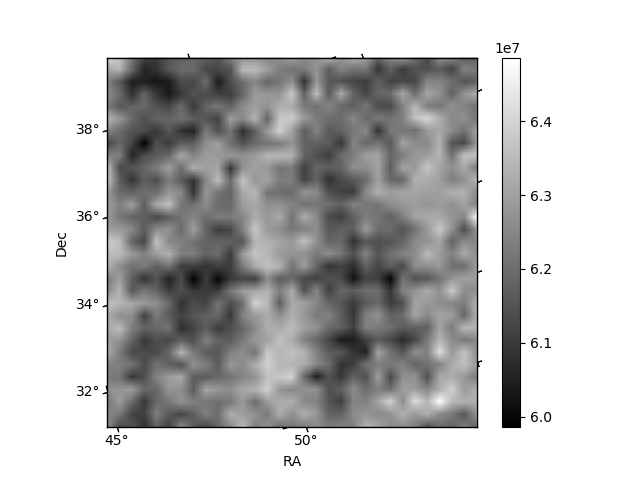
Histogram calculated using DETX and DETY for each event in the final _common_clean file
| Quadrant A |  |
 |
Quadrant B |
|---|---|---|---|
| Quadrant D |  |
 |
Quadrant C |
| Plot type | Count rate plots | Images |
|---|---|---|
| Comparison with Poisson distribution Blue bars denote a histogram of data divided into 1 sec bins. Red curve is a Poisson curve with rate = median count rate of data. |
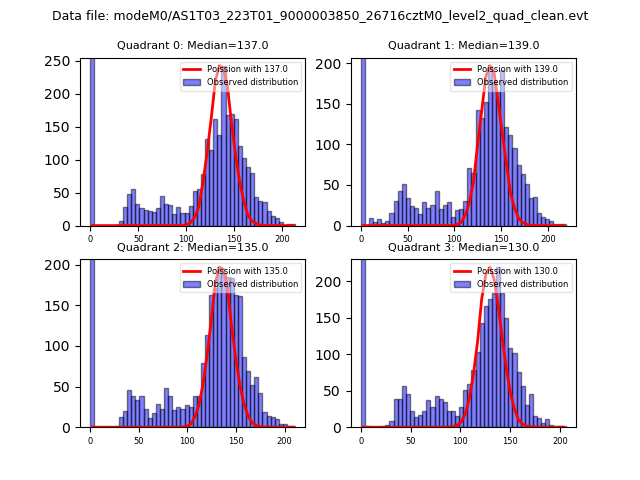 |
 |
| Quadrant-wise count rates Data is divided into 100 sec bins |
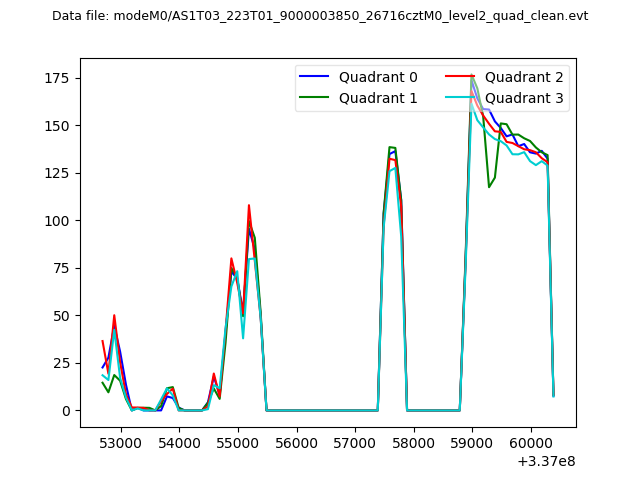 |
|
| Module-wise count rates for Quadrant A Data is divided into 100 sec bins |
 |
 |
| Module-wise count rates for Quadrant B Data is divided into 100 sec bins |
 |
 |
| Module-wise count rates for Quadrant C Data is divided into 100 sec bins |
 |
 |
| Module-wise count rates for Quadrant D Data is divided into 100 sec bins |
 |
 |
| Parameter | Plot |
|---|---|
| CZT HV Monitor |  |
| D_VDD |  |
| Temperature 1 |  |
| Veto HV Monitor |  |
| Veto LLD |  |
| Alpha Counter | 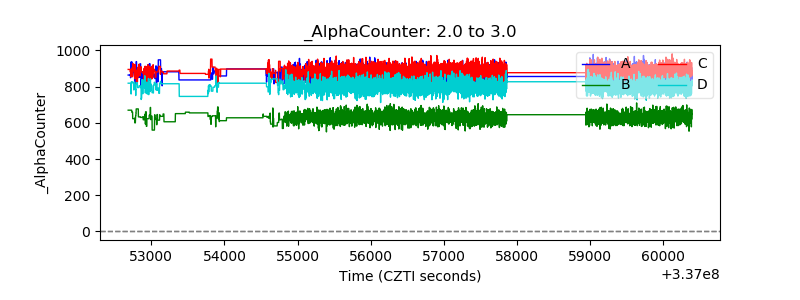 |
| _CPM_Rate | 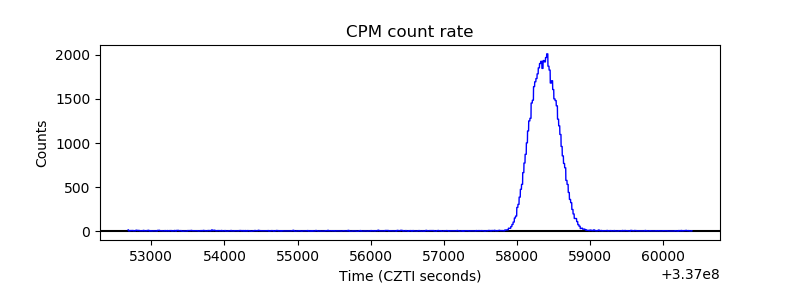 |
| CZT Counter |  |
| +2.5 Volts monitor |  |
| +5 Volts monitor |  |
| _ROLL_ROT |  |
| _Roll_DEC |  |
| _Roll_RA |  |
| Veto Counter |  |