| Param | Original file | Final file |
|---|---|---|
| Filename | modeM0/AS1T03_223T01_9000003850_26718cztM0_level2.evt | modeM0/AS1T03_223T01_9000003850_26718cztM0_level2_quad_clean.evt |
| Size (bytes) | 286,130,880 | 48,479,040 |
| Size | 272.9 MB | 46.2 MB |
| Events in quadrant A | 1,864,413 | 315,151 |
| Events in quadrant B | 2,390,745 | 315,482 |
| Events in quadrant C | 1,725,122 | 313,034 |
| Events in quadrant D | 2,444,265 | 275,326 |
| Mode M9 | |||
|---|---|---|---|
| Quadrant | BADHDUFLAG | Total packets | Discarded packets |
| A | 1 | 139660486417192 | 46 |
| B | 1 | -1 | -1 |
| C | 1 | -1 | -1 |
| D | 1 | -1 | -1 |
| Mode M0 | |||
|---|---|---|---|
| Quadrant | BADHDUFLAG | Total packets | Discarded packets |
| A | 0 | 7725 | 0 |
| B | 0 | 9176 | 0 |
| C | 0 | 7429 | 0 |
| D | 0 | 9551 | 0 |
| Quadrant | Total seconds | Saturated seconds | Saturation percentage |
|---|---|---|---|
| A | 3484 | 22 | 0.631458% |
| B | 3155 | 314 | 9.952456% |
| C | 3638 | 16 | 0.439802% |
| D | 3420 | 223 | 6.520468% |
Noise dominated data is calculated using 1-second bins in cleaned event files. If a bin has >2000 counts, and if more than 50% of those come from <1% of pixels, then it is considered to be noise-dominated and hence unusable.
| Quadrant | # 1 sec bins | Bins with >0 counts | Bins with >2000 counts | High rate bins dominated by noise | Noise dominated (total time) | Noise dominated (detector-on time) | Marked lightcurve |
|---|---|---|---|---|---|---|---|
| A | 4544 | 4012 | 7 | 7 | 0.15% | 0.17% | 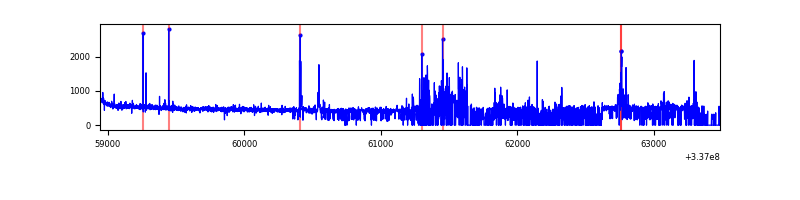 |
| B | 4411 | 3537 | 205 | 205 | 4.65% | 5.80% | 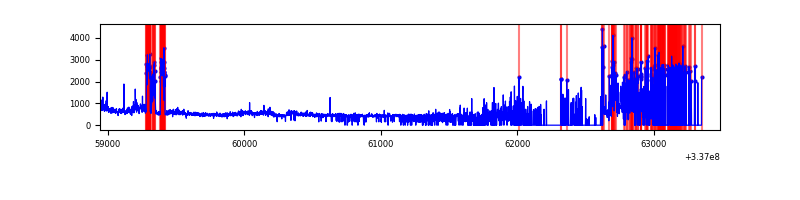 |
| C | 4539 | 4137 | 0 | 0 | 0.00% | 0.00% | 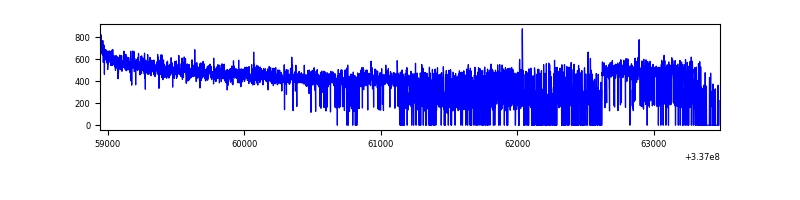 |
| D | 4523 | 3929 | 177 | 177 | 3.91% | 4.50% | 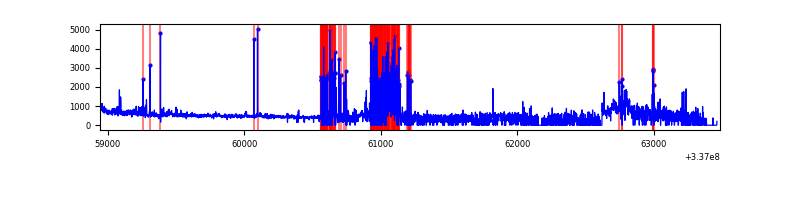 |
Top three noisy pixels from each quadrant. If the there are fewer than three noisy pixels in the level2.evt file, extra rows are filled as -1
| Pixel properties | Quadrant properties | ||||||
|---|---|---|---|---|---|---|---|
| Quadrant | DetID | PixID | Counts | Sigma | Mean | Median | Sigma |
| A | 0 | 13 | 215941 | 2491.99 | 426 | 417 | 86.5 |
| A | 13 | 254 | 5919 | 63.62 | 426 | 417 | 86.5 |
| A | 3 | 137 | 3805 | 39.17 | 426 | 417 | 86.5 |
| B | 0 | 189 | 751596 | 10854.14 | 362 | 354 | 69.2 |
| B | 10 | 246 | 214561 | 3094.92 | 362 | 354 | 69.2 |
| B | 12 | 111 | 7999 | 110.46 | 362 | 354 | 69.2 |
| C | 14 | 238 | 68360 | 689.66 | 422 | 425 | 98.5 |
| C | 3 | 233 | 4383 | 40.18 | 422 | 425 | 98.5 |
| C | 15 | 208 | 4212 | 38.44 | 422 | 425 | 98.5 |
| D | 1 | 52 | 851505 | 8245.07 | 380 | 372 | 103.2 |
| D | 2 | 250 | 71357 | 687.64 | 380 | 372 | 103.2 |
| D | 7 | 80 | 50168 | 482.38 | 380 | 372 | 103.2 |
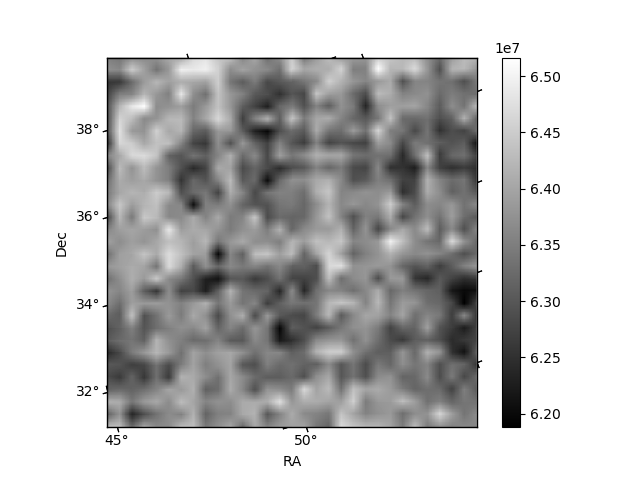
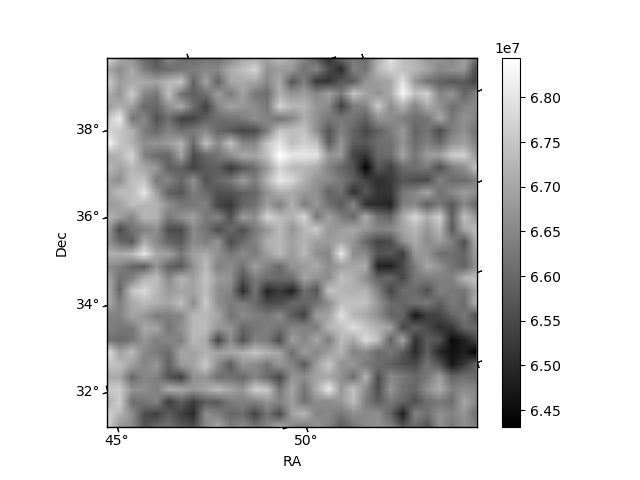
Histogram calculated using DETX and DETY for each event in the final _common_clean file
| Quadrant A |  |
 |
Quadrant B |
|---|---|---|---|
| Quadrant D |  |
 |
Quadrant C |
| Plot type | Count rate plots | Images |
|---|---|---|
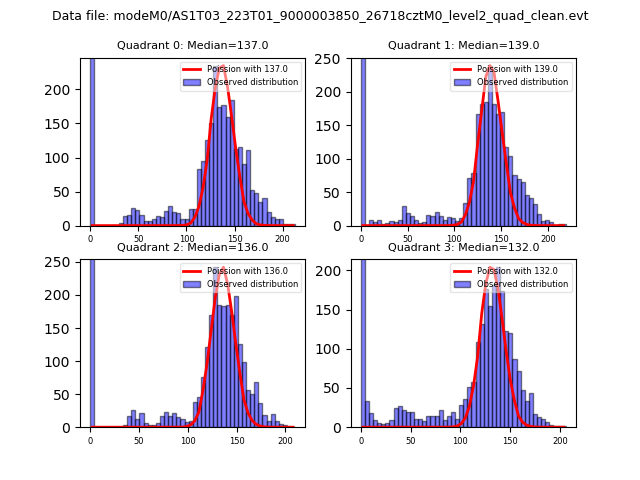
| Comparison with Poisson distribution Blue bars denote a histogram of data divided into 1 sec bins. Red curve is a Poisson curve with rate = median count rate of data. |
 |
 |
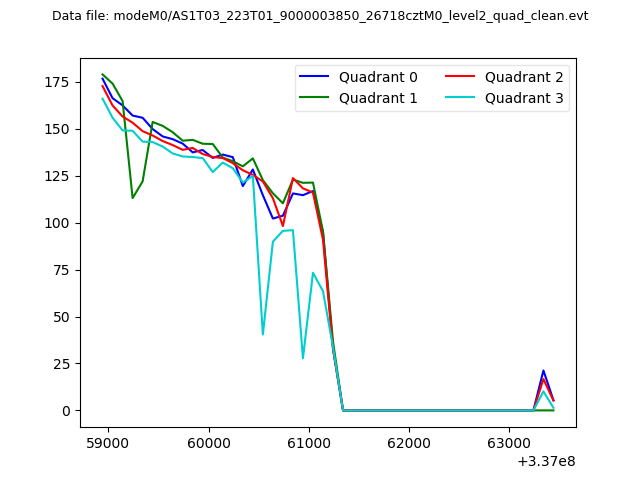
| Quadrant-wise count rates Data is divided into 100 sec bins |
 |
|
| Module-wise count rates for Quadrant A Data is divided into 100 sec bins |
 |
 |
| Module-wise count rates for Quadrant B Data is divided into 100 sec bins |
 |
 |
| Module-wise count rates for Quadrant C Data is divided into 100 sec bins |
 |
 |
| Module-wise count rates for Quadrant D Data is divided into 100 sec bins |
 |
 |
| Parameter | Plot |
|---|---|
| CZT HV Monitor |  |
| D_VDD |  |
| Temperature 1 |  |
| Veto HV Monitor |  |
| Veto LLD |  |
| Alpha Counter | 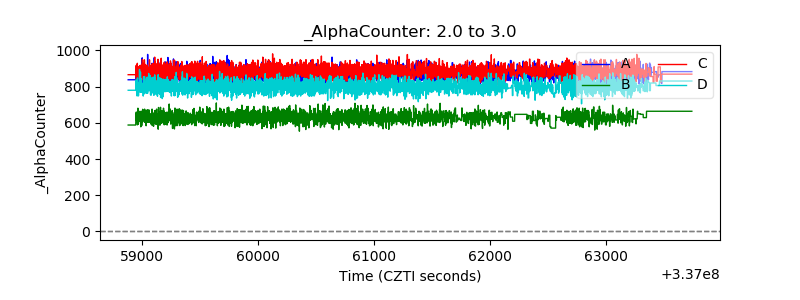 |
| _CPM_Rate | 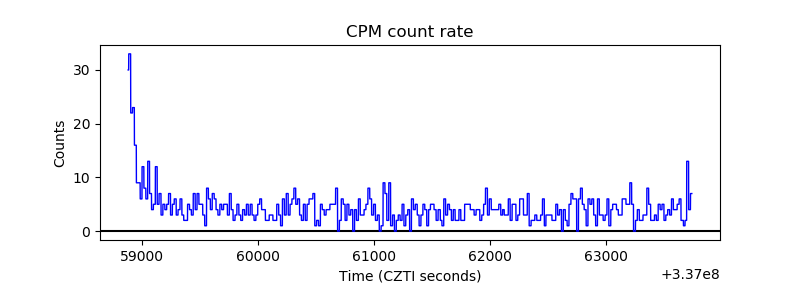 |
| CZT Counter |  |
| +2.5 Volts monitor |  |
| +5 Volts monitor |  |
| _ROLL_ROT |  |
| _Roll_DEC |  |
| _Roll_RA |  |
| Veto Counter |  |