| Param | Original file | Final file |
|---|---|---|
| Filename | modeM0/AS1T03_223T01_9000003850_26719cztM0_level2.evt | modeM0/AS1T03_223T01_9000003850_26719cztM0_level2_quad_clean.evt |
| Size (bytes) | 1,361,724,480 | 221,906,880 |
| Size | 1.3 GB | 211.6 MB |
| Events in quadrant A | 8,441,744 | 1,421,835 |
| Events in quadrant B | 11,693,817 | 1,435,385 |
| Events in quadrant C | 8,021,716 | 1,401,142 |
| Events in quadrant D | 11,979,099 | 1,334,342 |
| Mode M9 | |||
|---|---|---|---|
| Quadrant | BADHDUFLAG | Total packets | Discarded packets |
| A | 0 | 32 | 0 |
| B | 0 | 32 | 0 |
| C | 0 | 32 | 0 |
| D | 0 | 32 | 0 |
| Mode M0 | |||
|---|---|---|---|
| Quadrant | BADHDUFLAG | Total packets | Discarded packets |
| A | 0 | 35341 | 0 |
| B | 0 | 45480 | 0 |
| C | 0 | 33941 | 0 |
| D | 0 | 46608 | 0 |
| Quadrant | Total seconds | Saturated seconds | Saturation percentage |
|---|---|---|---|
| A | 16347 | 172 | 1.052181% |
| B | 16347 | 1236 | 7.561020% |
| C | 16347 | 143 | 0.874778% |
| D | 16347 | 766 | 4.685875% |
Noise dominated data is calculated using 1-second bins in cleaned event files. If a bin has >2000 counts, and if more than 50% of those come from <1% of pixels, then it is considered to be noise-dominated and hence unusable.
| Quadrant | # 1 sec bins | Bins with >0 counts | Bins with >2000 counts | High rate bins dominated by noise | Noise dominated (total time) | Noise dominated (detector-on time) | Marked lightcurve |
|---|---|---|---|---|---|---|---|
| A | 24512 | 16352 | 57 | 57 | 0.23% | 0.35% | 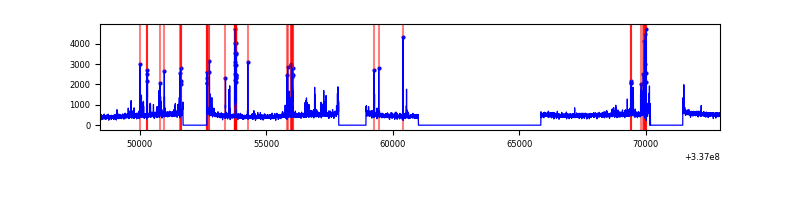 |
| B | 24512 | 16352 | 680 | 680 | 2.77% | 4.16% | 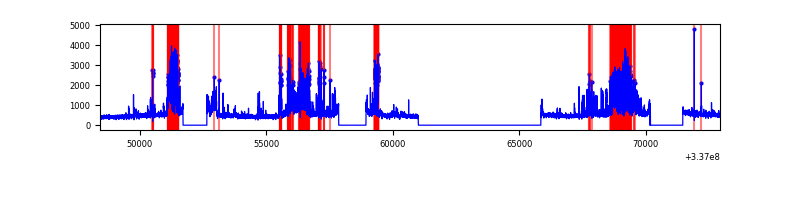 |
| C | 24512 | 16352 | 3 | 3 | 0.01% | 0.02% | 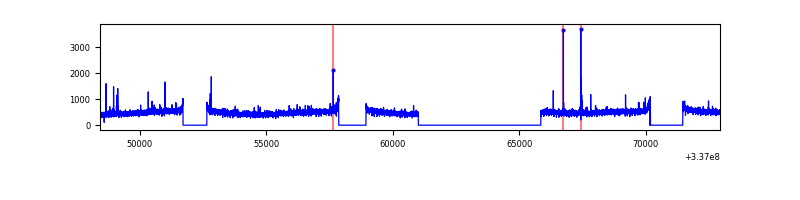 |
| D | 24512 | 16351 | 550 | 550 | 2.24% | 3.36% | 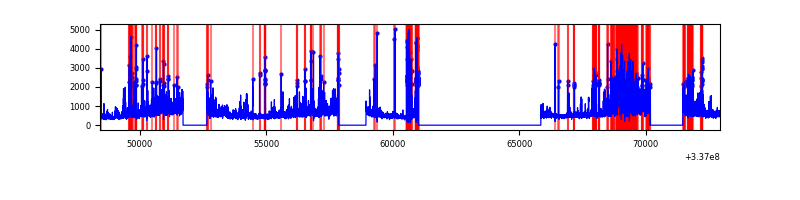 |
Top three noisy pixels from each quadrant. If the there are fewer than three noisy pixels in the level2.evt file, extra rows are filled as -1
| Pixel properties | Quadrant properties | ||||||
|---|---|---|---|---|---|---|---|
| Quadrant | DetID | PixID | Counts | Sigma | Mean | Median | Sigma |
| A | 0 | 13 | 535499 | 1323.1 | 2046 | 2006 | 403.2 |
| A | 13 | 254 | 27586 | 63.44 | 2046 | 2006 | 403.2 |
| A | 3 | 137 | 18193 | 40.14 | 2046 | 2006 | 403.2 |
| B | 0 | 189 | 3325383 | 8983.17 | 1978 | 1930 | 370.0 |
| B | 10 | 246 | 559278 | 1506.49 | 1978 | 1930 | 370.0 |
| B | 12 | 111 | 44816 | 115.92 | 1978 | 1930 | 370.0 |
| C | 14 | 238 | 316480 | 696.06 | 1947 | 1961 | 451.9 |
| C | 15 | 208 | 59722 | 127.83 | 1947 | 1961 | 451.9 |
| C | 3 | 233 | 44009 | 93.06 | 1947 | 1961 | 451.9 |
| D | 1 | 52 | 3305731 | 6442.31 | 1922 | 1881 | 512.8 |
| D | 7 | 80 | 884603 | 1721.26 | 1922 | 1881 | 512.8 |
| D | 2 | 250 | 287239 | 556.43 | 1922 | 1881 | 512.8 |
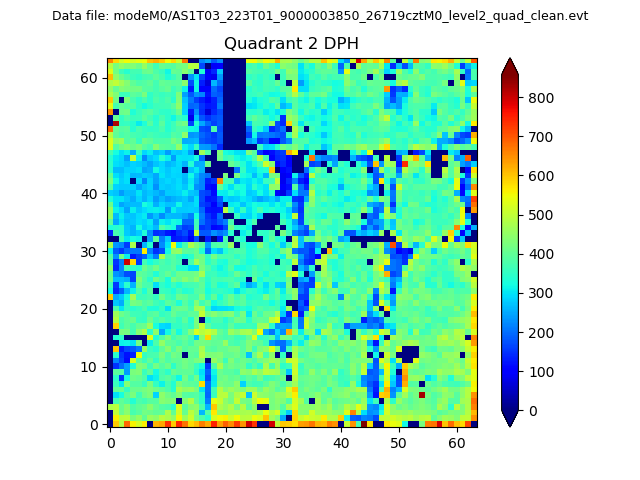
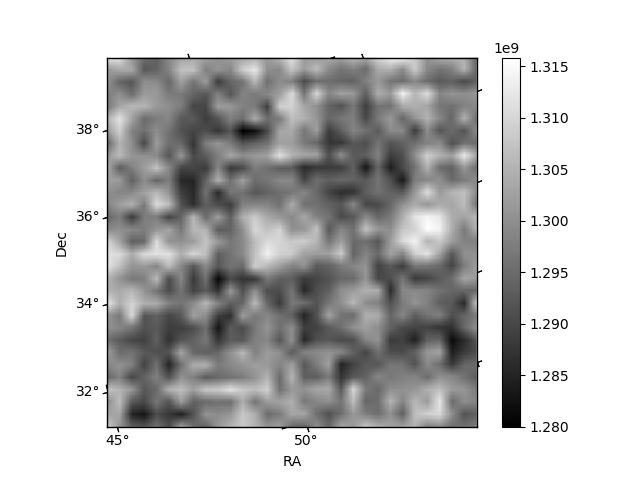
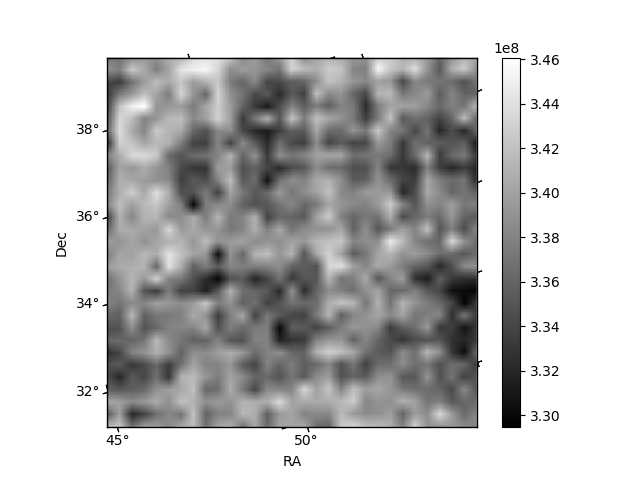
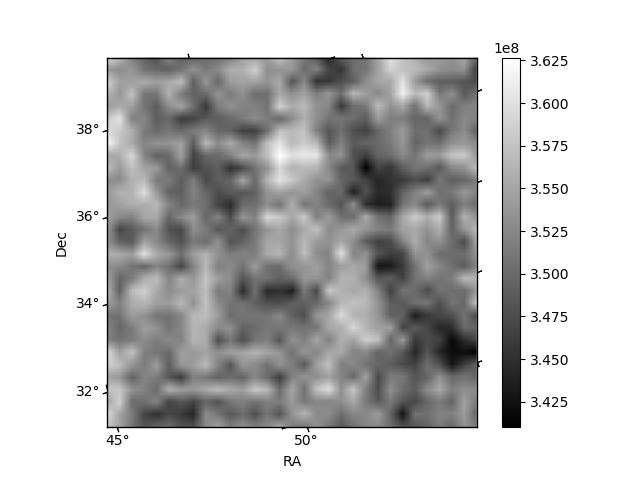
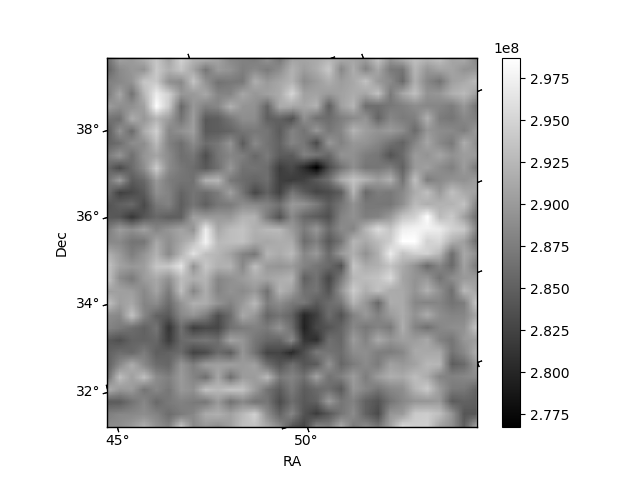
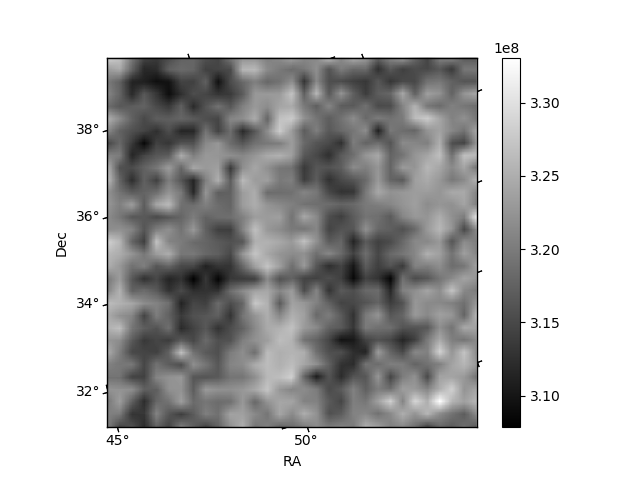
Histogram calculated using DETX and DETY for each event in the final _common_clean file
| Quadrant A | 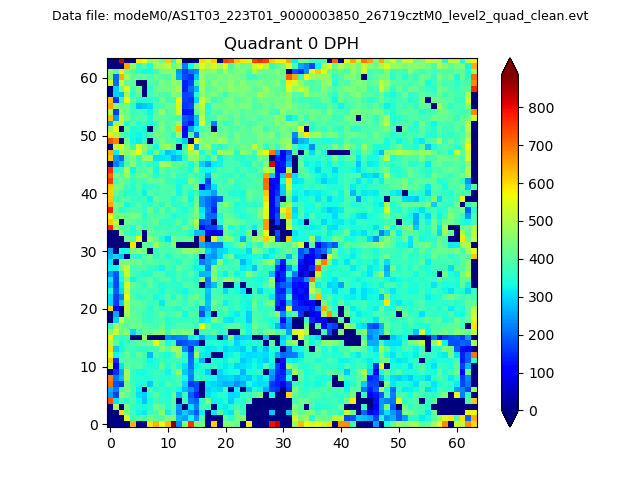 |
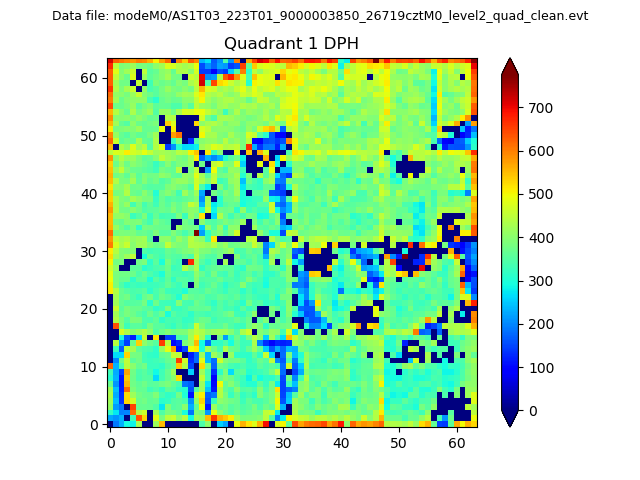 |
Quadrant B |
|---|---|---|---|
| Quadrant D | 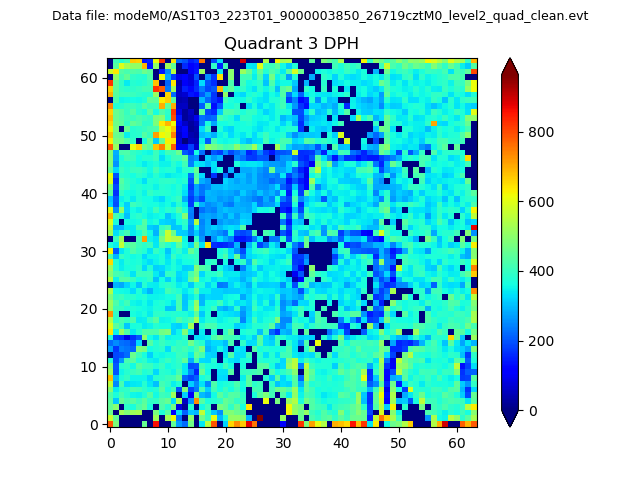 |
 |
Quadrant C |
| Plot type | Count rate plots | Images |
|---|---|---|
| Comparison with Poisson distribution Blue bars denote a histogram of data divided into 1 sec bins. Red curve is a Poisson curve with rate = median count rate of data. |
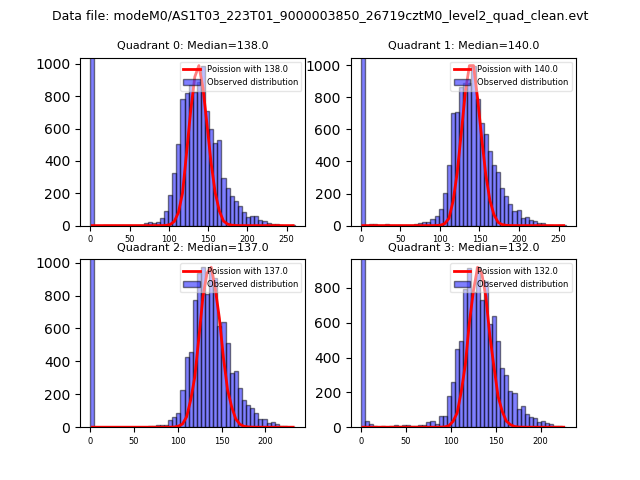 |
 |
| Quadrant-wise count rates Data is divided into 100 sec bins |
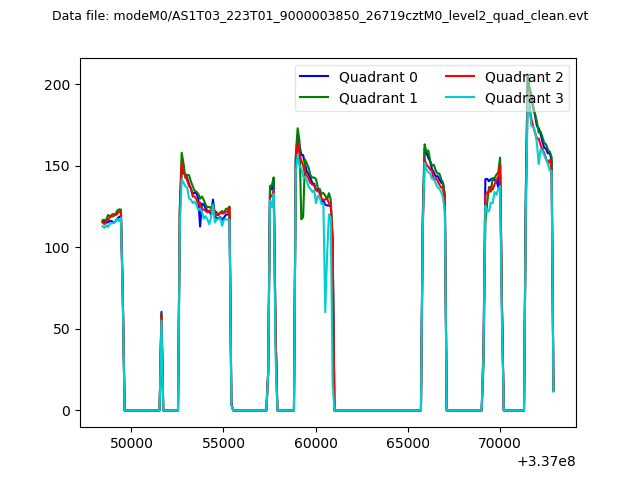 |
|
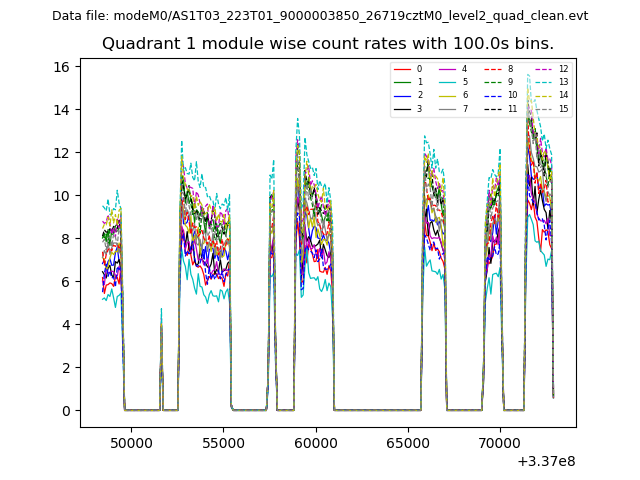
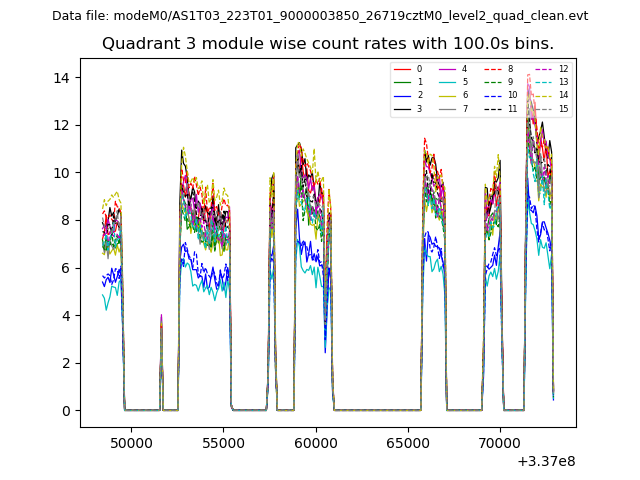
| Module-wise count rates for Quadrant A Data is divided into 100 sec bins |
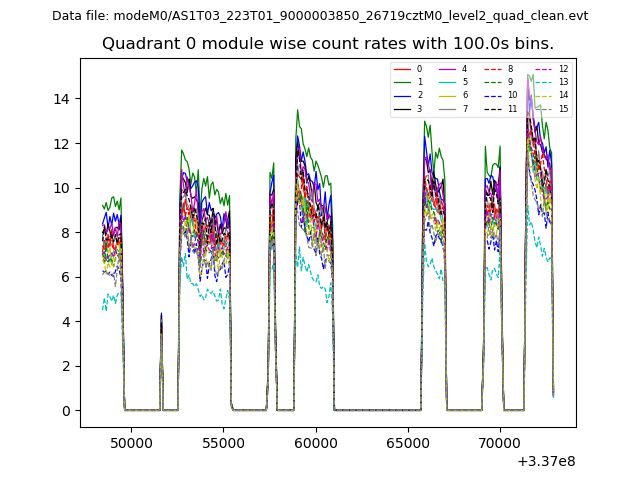 |
 |
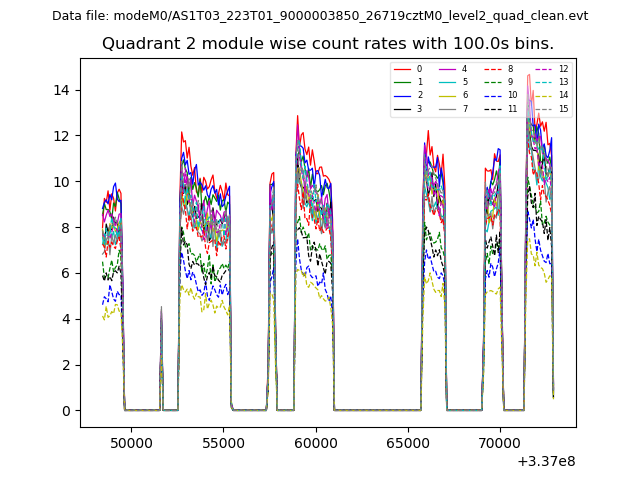
| Module-wise count rates for Quadrant B Data is divided into 100 sec bins |
 |
 |
| Module-wise count rates for Quadrant C Data is divided into 100 sec bins |
 |
 |
| Module-wise count rates for Quadrant D Data is divided into 100 sec bins |
 |
 |
| Parameter | Plot |
|---|---|
| CZT HV Monitor | 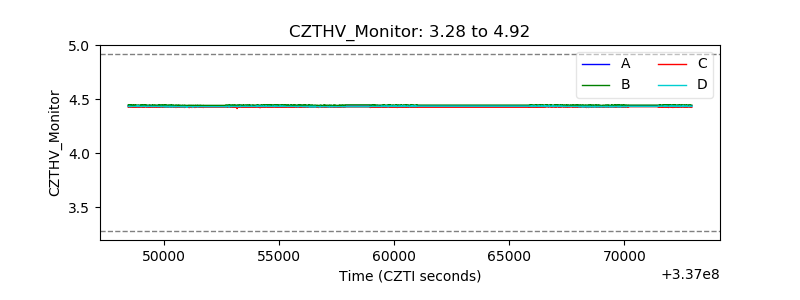 |
| D_VDD | 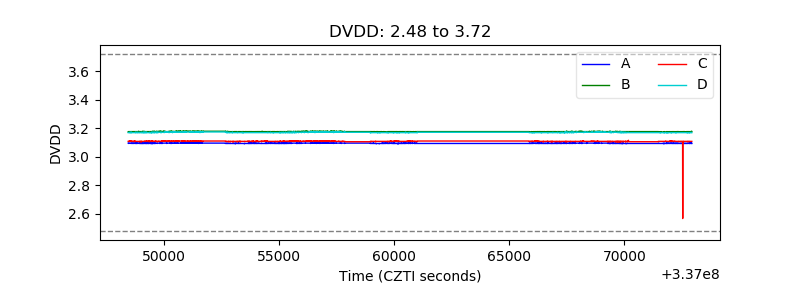 |
| Temperature 1 | 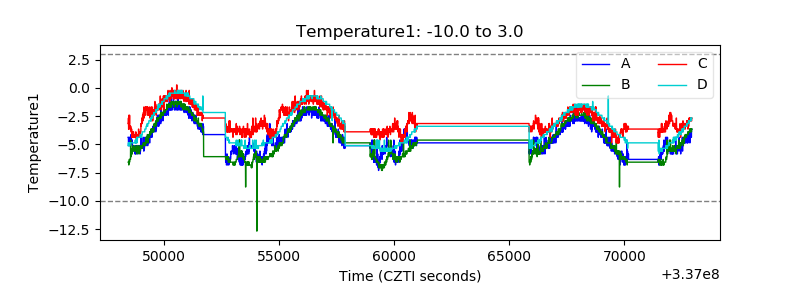 |
| Veto HV Monitor | 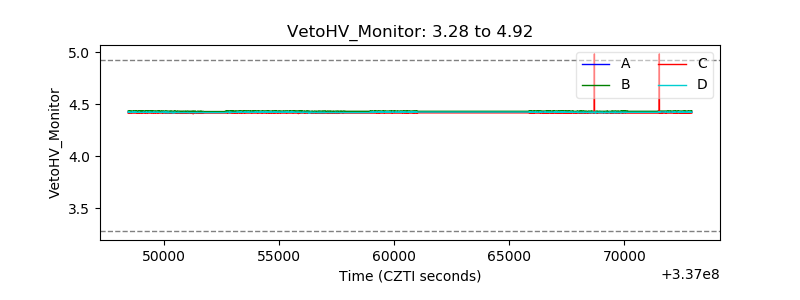 |
| Veto LLD | 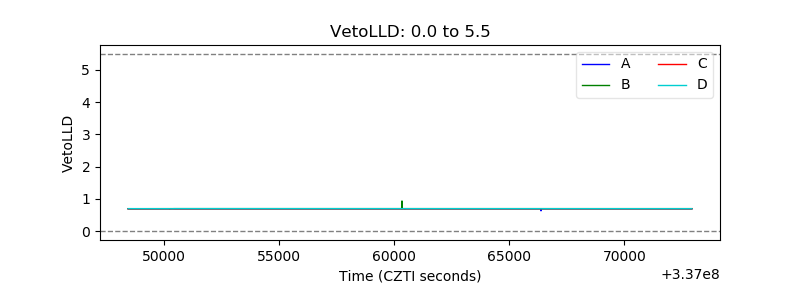 |
| Alpha Counter | 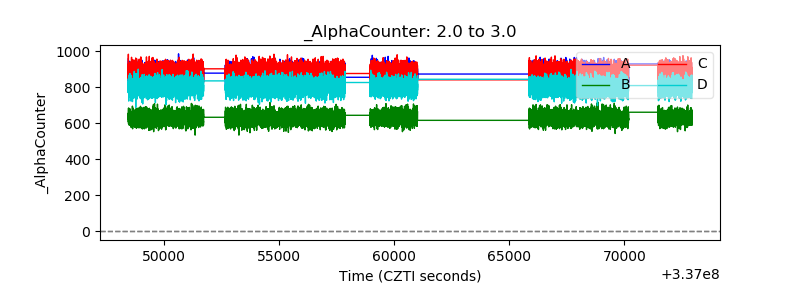 |
| _CPM_Rate |  |
| CZT Counter | 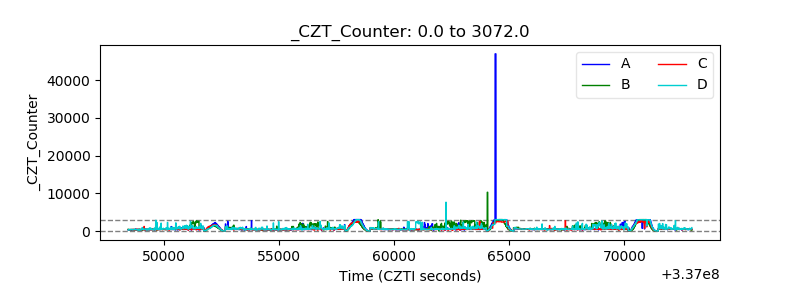 |
| +2.5 Volts monitor |  |
| +5 Volts monitor |  |
| _ROLL_ROT | 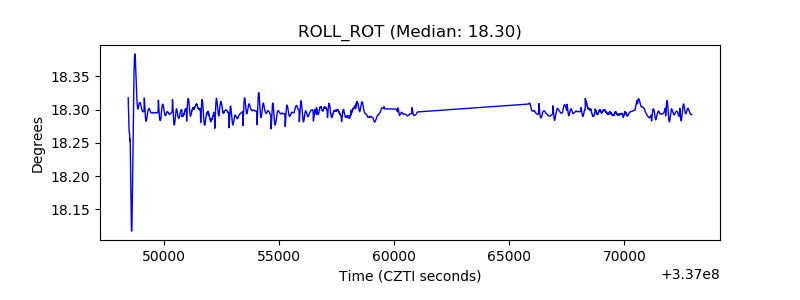 |
| _Roll_DEC | 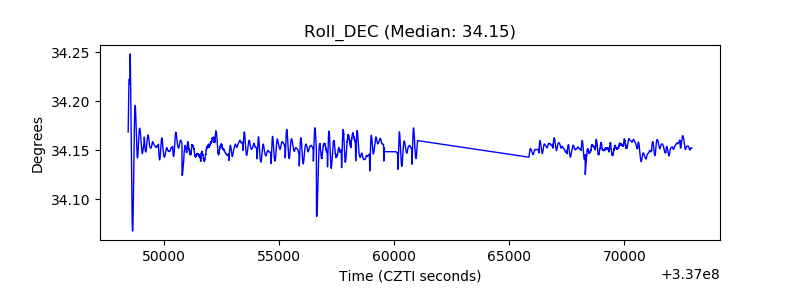 |
| _Roll_RA | 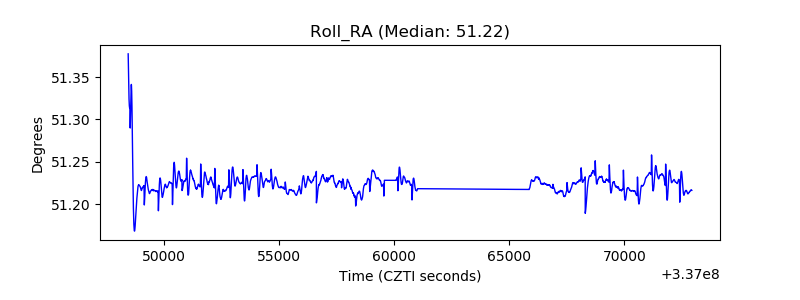 |
| Veto Counter | 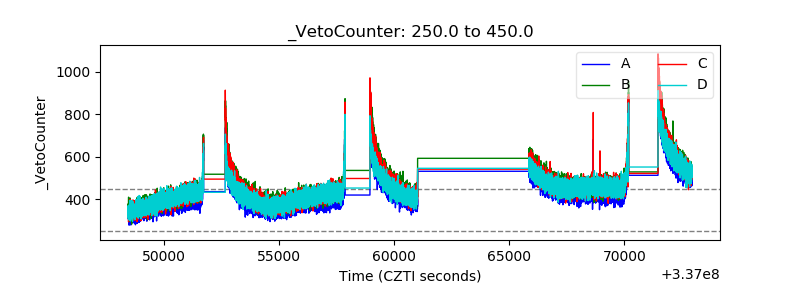 |