| Param | Original file | Final file |
|---|---|---|
| Filename | modeM0/AS1T03_223T01_9000003850_26720cztM0_level2.evt | modeM0/AS1T03_223T01_9000003850_26720cztM0_level2_quad_clean.evt |
| Size (bytes) | 612,941,760 | 88,983,360 |
| Size | 584.5 MB | 84.9 MB |
| Events in quadrant A | 3,252,509 | 591,996 |
| Events in quadrant B | 5,146,774 | 589,281 |
| Events in quadrant C | 3,148,555 | 568,295 |
| Events in quadrant D | 6,612,922 | 529,898 |
| Mode M9 | |||
|---|---|---|---|
| Quadrant | BADHDUFLAG | Total packets | Discarded packets |
| A | 0 | 14 | 0 |
| B | 0 | 14 | 0 |
| C | 0 | 14 | 0 |
| D | 0 | 14 | 0 |
| Mode M0 | |||
|---|---|---|---|
| Quadrant | BADHDUFLAG | Total packets | Discarded packets |
| A | 0 | 12981 | 0 |
| B | 0 | 18915 | 0 |
| C | 0 | 12660 | 0 |
| D | 0 | 23628 | 0 |
| Quadrant | Total seconds | Saturated seconds | Saturation percentage |
|---|---|---|---|
| A | 5943 | 53 | 0.891805% |
| B | 5943 | 894 | 15.042908% |
| C | 5943 | 63 | 1.060071% |
| D | 5943 | 1134 | 19.081272% |
Noise dominated data is calculated using 1-second bins in cleaned event files. If a bin has >2000 counts, and if more than 50% of those come from <1% of pixels, then it is considered to be noise-dominated and hence unusable.
| Quadrant | # 1 sec bins | Bins with >0 counts | Bins with >2000 counts | High rate bins dominated by noise | Noise dominated (total time) | Noise dominated (detector-on time) | Marked lightcurve |
|---|---|---|---|---|---|---|---|
| A | 7278 | 5944 | 8 | 8 | 0.11% | 0.13% | 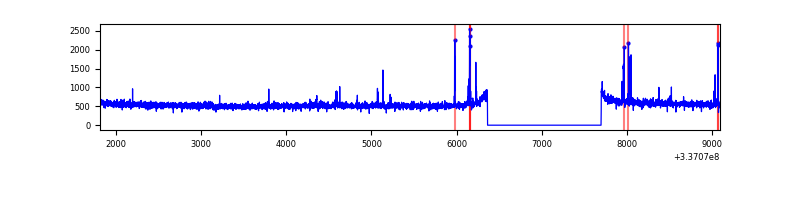 |
| B | 7278 | 5944 | 587 | 587 | 8.07% | 9.88% | 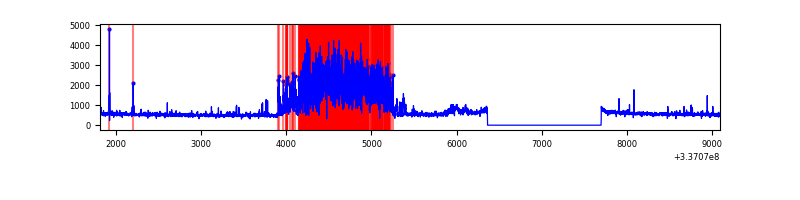 |
| C | 7278 | 5944 | 0 | 0 | 0.00% | 0.00% | 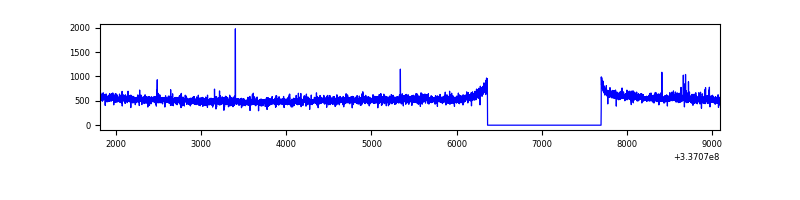 |
| D | 7278 | 5944 | 974 | 974 | 13.38% | 16.39% | 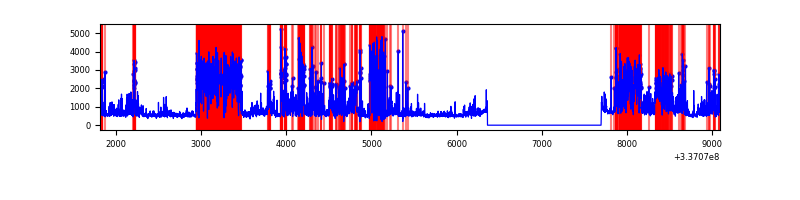 |
Top three noisy pixels from each quadrant. If the there are fewer than three noisy pixels in the level2.evt file, extra rows are filled as -1
| Pixel properties | Quadrant properties | ||||||
|---|---|---|---|---|---|---|---|
| Quadrant | DetID | PixID | Counts | Sigma | Mean | Median | Sigma |
| A | 0 | 13 | 80175 | 488.5 | 823 | 810 | 162.5 |
| A | 13 | 254 | 9445 | 53.15 | 823 | 810 | 162.5 |
| A | 0 | 226 | 7283 | 39.84 | 823 | 810 | 162.5 |
| B | 0 | 189 | 2092918 | 14683.32 | 762 | 746 | 142.5 |
| B | 10 | 246 | 32838 | 225.23 | 762 | 746 | 142.5 |
| B | 12 | 111 | 16486 | 110.46 | 762 | 746 | 142.5 |
| C | 14 | 238 | 128009 | 717.5 | 769 | 777 | 177.3 |
| C | 15 | 208 | 17974 | 96.98 | 769 | 777 | 177.3 |
| C | 3 | 233 | 6286 | 31.07 | 769 | 777 | 177.3 |
| D | 1 | 52 | 1330960 | 7014.27 | 714 | 699 | 189.7 |
| D | 7 | 80 | 1309467 | 6900.94 | 714 | 699 | 189.7 |
| D | 12 | 233 | 1215634 | 6406.18 | 714 | 699 | 189.7 |
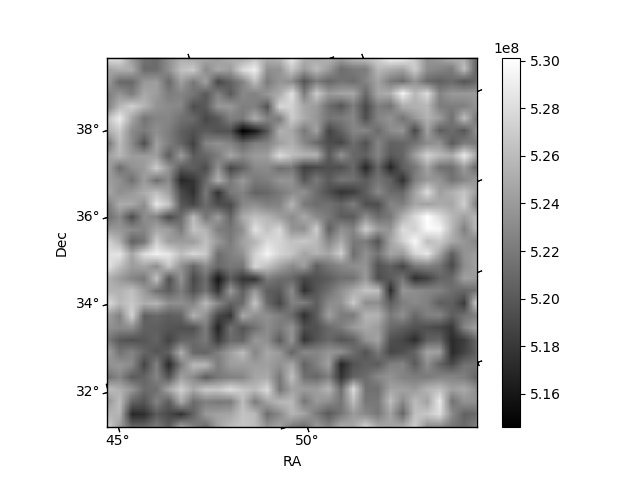
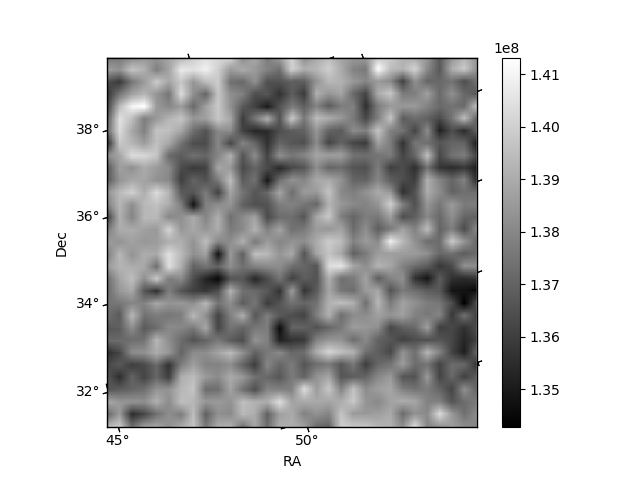
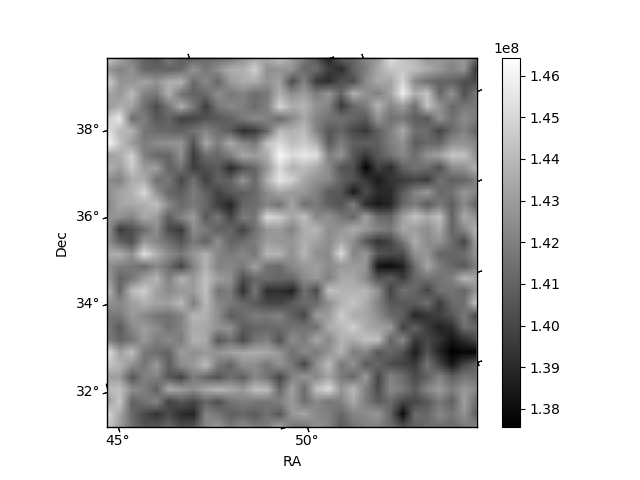
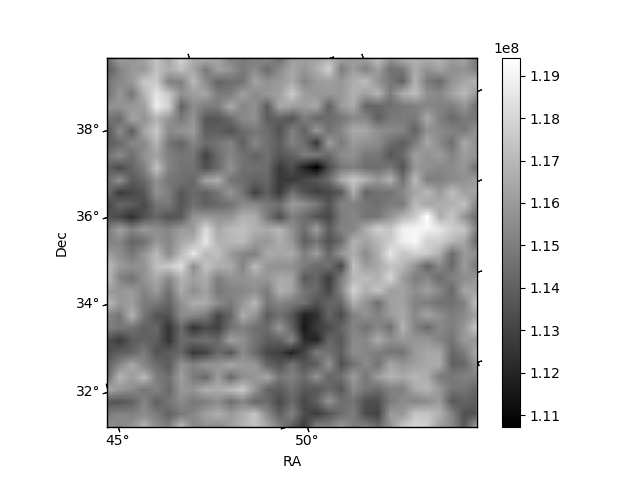
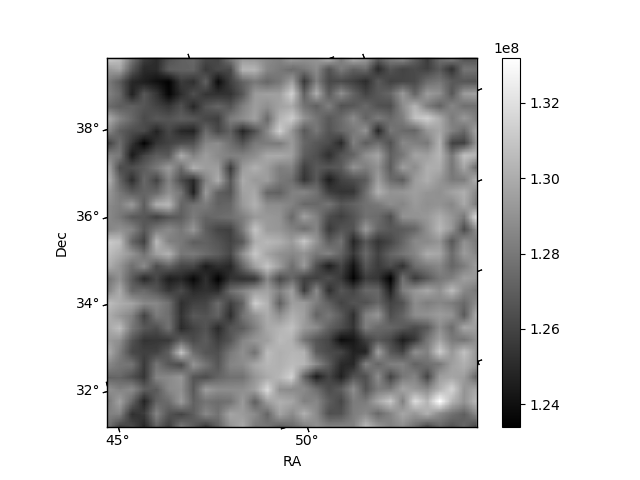
Histogram calculated using DETX and DETY for each event in the final _common_clean file
| Quadrant A | 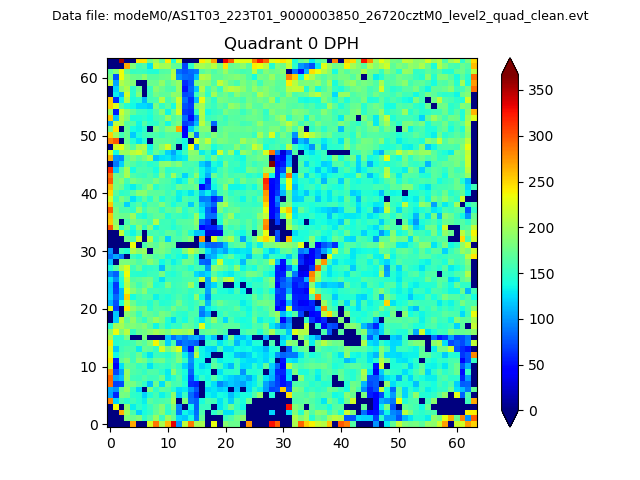 |
 |
Quadrant B |
|---|---|---|---|
| Quadrant D | 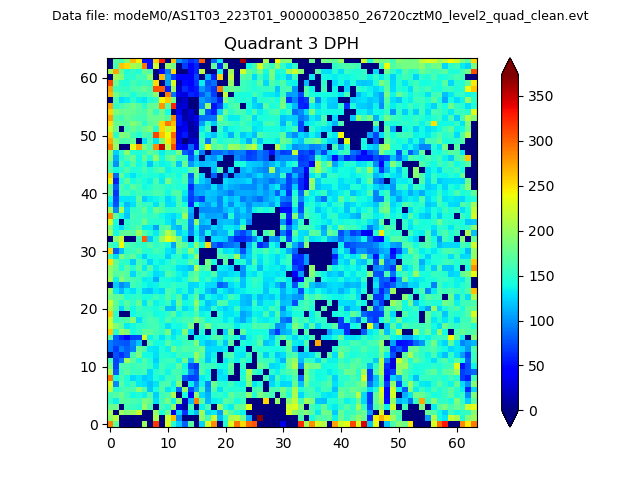 |
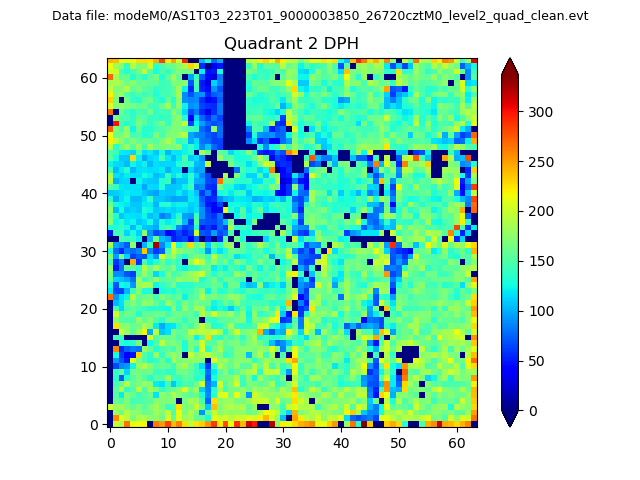 |
Quadrant C |
| Plot type | Count rate plots | Images |
|---|---|---|
| Comparison with Poisson distribution Blue bars denote a histogram of data divided into 1 sec bins. Red curve is a Poisson curve with rate = median count rate of data. |
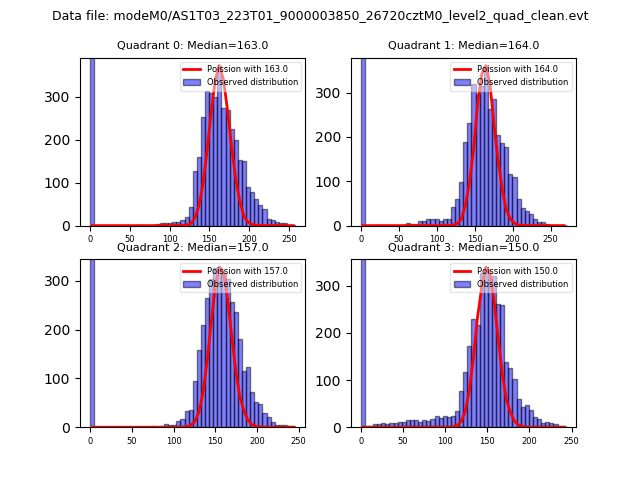 |
 |
| Quadrant-wise count rates Data is divided into 100 sec bins |
 |
|
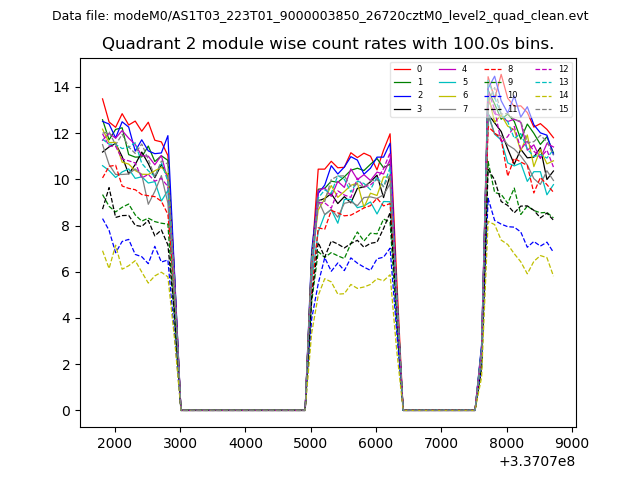
| Module-wise count rates for Quadrant A Data is divided into 100 sec bins |
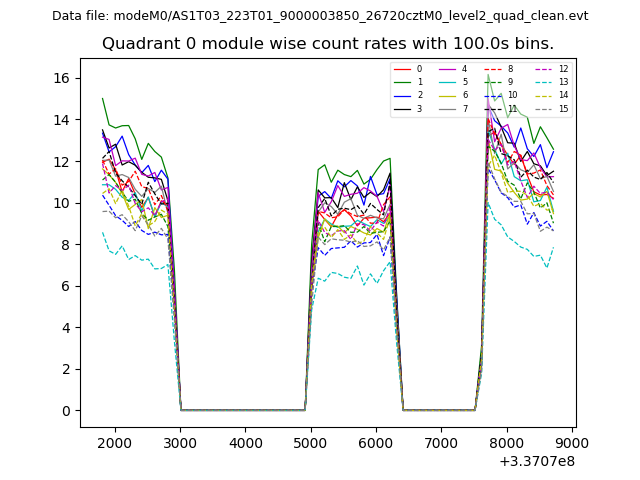 |
 |
| Module-wise count rates for Quadrant B Data is divided into 100 sec bins |
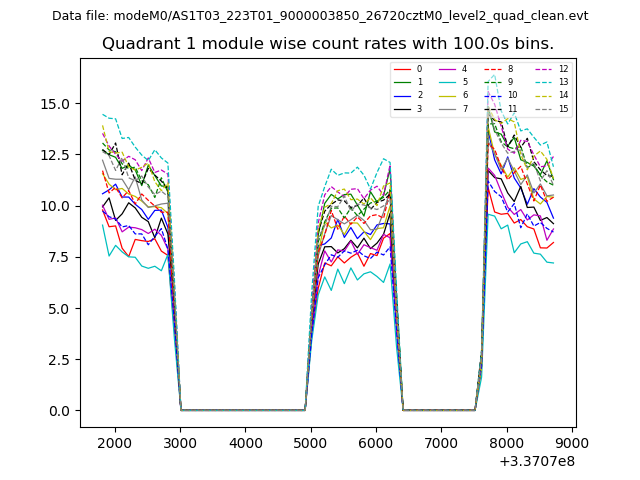 |
 |
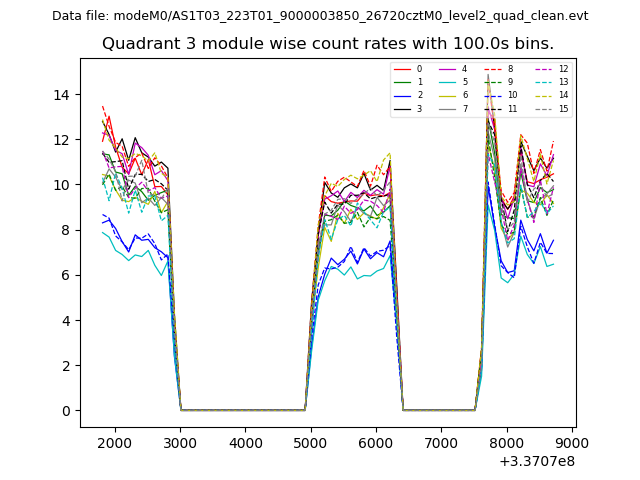
| Module-wise count rates for Quadrant C Data is divided into 100 sec bins |
 |
 |
| Module-wise count rates for Quadrant D Data is divided into 100 sec bins |
 |
 |
| Parameter | Plot |
|---|---|
| CZT HV Monitor | 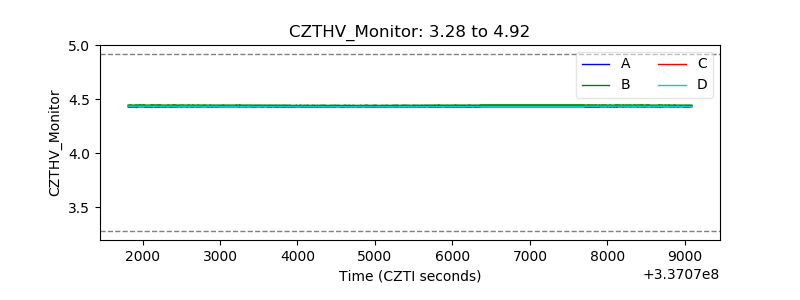 |
| D_VDD | 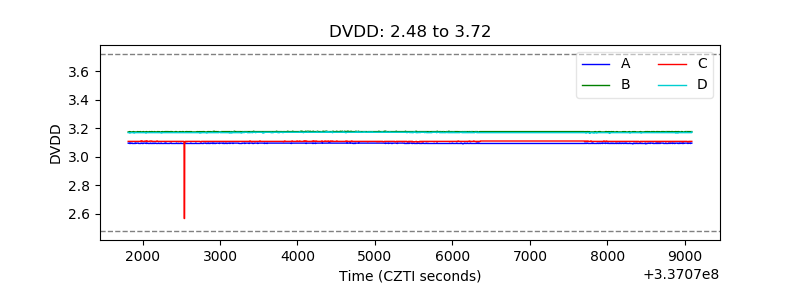 |
| Temperature 1 | 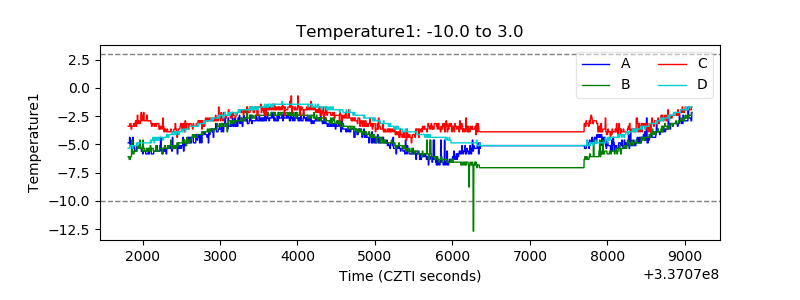 |
| Veto HV Monitor | 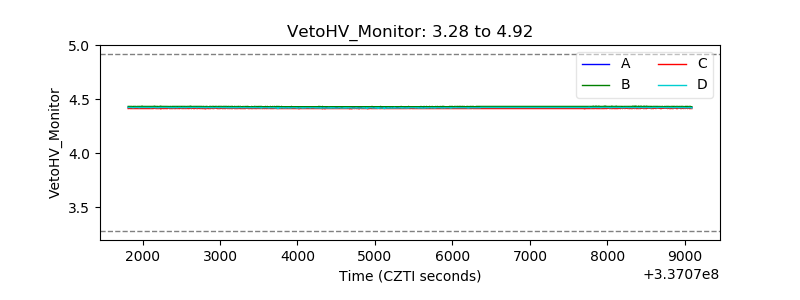 |
| Veto LLD | 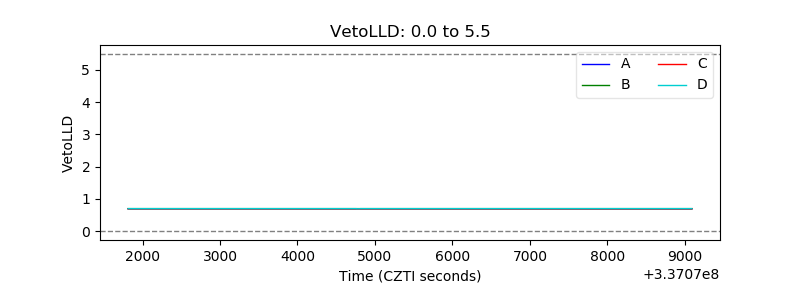 |
| Alpha Counter | 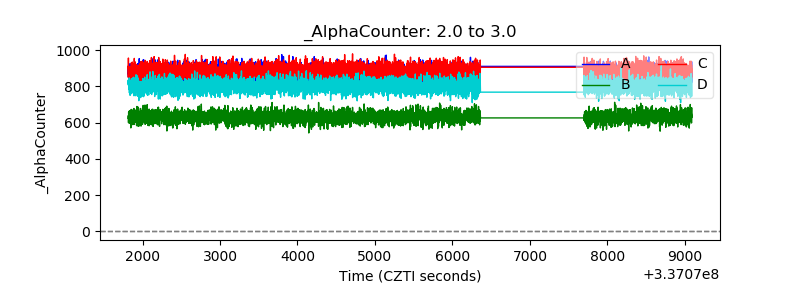 |
| _CPM_Rate | 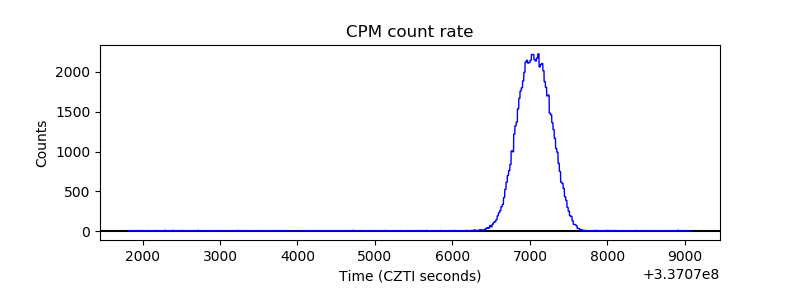 |
| CZT Counter | 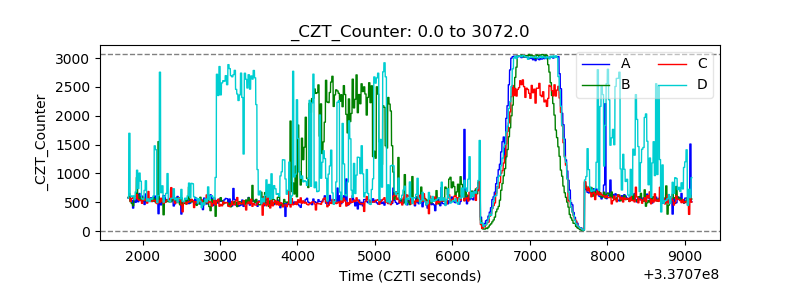 |
| +2.5 Volts monitor |  |
| +5 Volts monitor |  |
| _ROLL_ROT | 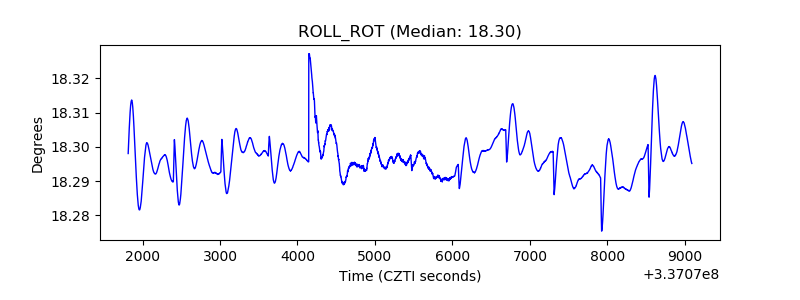 |
| _Roll_DEC | 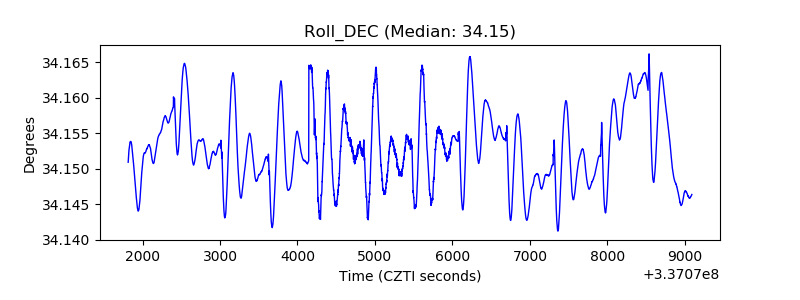 |
| _Roll_RA |  |
| Veto Counter | 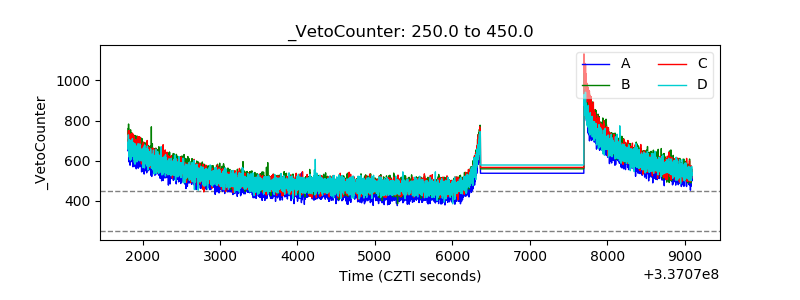 |