| Param | Original file | Final file |
|---|---|---|
| Filename | modeM0/AS1T03_223T01_9000003850_26721cztM0_level2.evt | modeM0/AS1T03_223T01_9000003850_26721cztM0_level2_quad_clean.evt |
| Size (bytes) | 580,694,400 | 84,720,960 |
| Size | 553.8 MB | 80.8 MB |
| Events in quadrant A | 3,600,020 | 550,235 |
| Events in quadrant B | 4,675,290 | 550,677 |
| Events in quadrant C | 3,259,632 | 536,398 |
| Events in quadrant D | 5,639,178 | 502,823 |
| Mode M9 | |||
|---|---|---|---|
| Quadrant | BADHDUFLAG | Total packets | Discarded packets |
| A | 0 | 13 | 0 |
| B | 0 | 13 | 0 |
| C | 0 | 13 | 0 |
| D | 0 | 13 | 0 |
| Mode M0 | |||
|---|---|---|---|
| Quadrant | BADHDUFLAG | Total packets | Discarded packets |
| A | 0 | 14248 | 0 |
| B | 0 | 17605 | 0 |
| C | 0 | 13032 | 0 |
| D | 0 | 20855 | 0 |
| Quadrant | Total seconds | Saturated seconds | Saturation percentage |
|---|---|---|---|
| A | 6089 | 135 | 2.217113% |
| B | 6088 | 577 | 9.477661% |
| C | 6088 | 82 | 1.346912% |
| D | 6088 | 566 | 9.296978% |
Noise dominated data is calculated using 1-second bins in cleaned event files. If a bin has >2000 counts, and if more than 50% of those come from <1% of pixels, then it is considered to be noise-dominated and hence unusable.
| Quadrant | # 1 sec bins | Bins with >0 counts | Bins with >2000 counts | High rate bins dominated by noise | Noise dominated (total time) | Noise dominated (detector-on time) | Marked lightcurve |
|---|---|---|---|---|---|---|---|
| A | 7394 | 6090 | 43 | 43 | 0.58% | 0.71% | 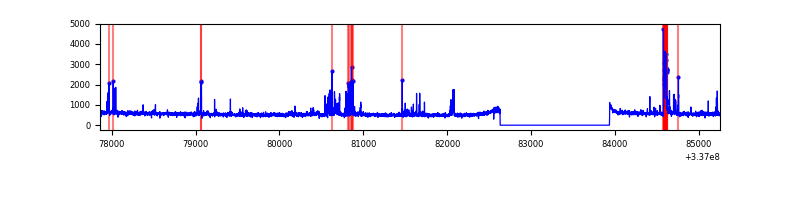 |
| B | 7393 | 6089 | 374 | 374 | 5.06% | 6.14% | 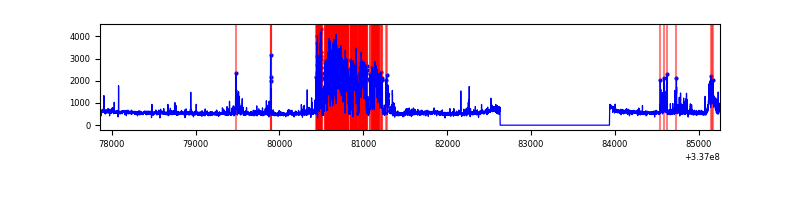 |
| C | 7393 | 6089 | 1 | 1 | 0.01% | 0.02% | 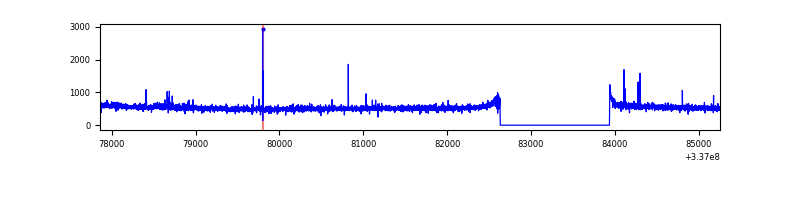 |
| D | 7393 | 6089 | 449 | 449 | 6.07% | 7.37% | 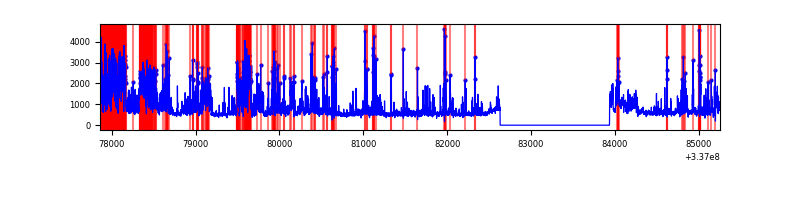 |
Top three noisy pixels from each quadrant. If the there are fewer than three noisy pixels in the level2.evt file, extra rows are filled as -1
| Pixel properties | Quadrant properties | ||||||
|---|---|---|---|---|---|---|---|
| Quadrant | DetID | PixID | Counts | Sigma | Mean | Median | Sigma |
| A | 0 | 13 | 341019 | 2039.68 | 845 | 832 | 166.8 |
| A | 13 | 254 | 9418 | 51.48 | 845 | 832 | 166.8 |
| A | 0 | 226 | 7292 | 38.73 | 845 | 832 | 166.8 |
| B | 0 | 189 | 1361009 | 9078.3 | 806 | 790 | 149.8 |
| B | 10 | 246 | 105603 | 699.53 | 806 | 790 | 149.8 |
| B | 4 | 171 | 29595 | 192.25 | 806 | 790 | 149.8 |
| C | 14 | 238 | 130646 | 714.03 | 793 | 798 | 181.9 |
| C | 15 | 208 | 26943 | 143.77 | 793 | 798 | 181.9 |
| C | 3 | 233 | 6685 | 32.37 | 793 | 798 | 181.9 |
| D | 7 | 80 | 1450161 | 6938.95 | 787 | 772 | 208.9 |
| D | 1 | 52 | 972346 | 4651.41 | 787 | 772 | 208.9 |
| D | 2 | 250 | 153088 | 729.21 | 787 | 772 | 208.9 |
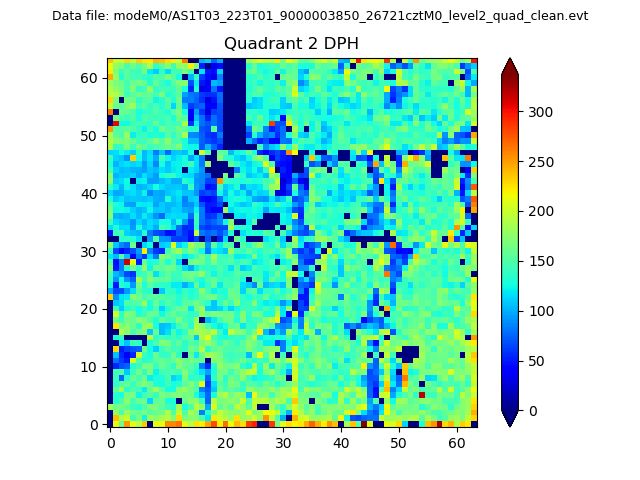
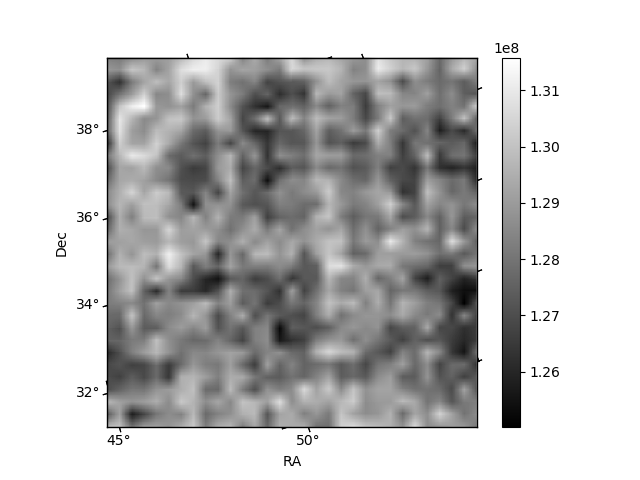
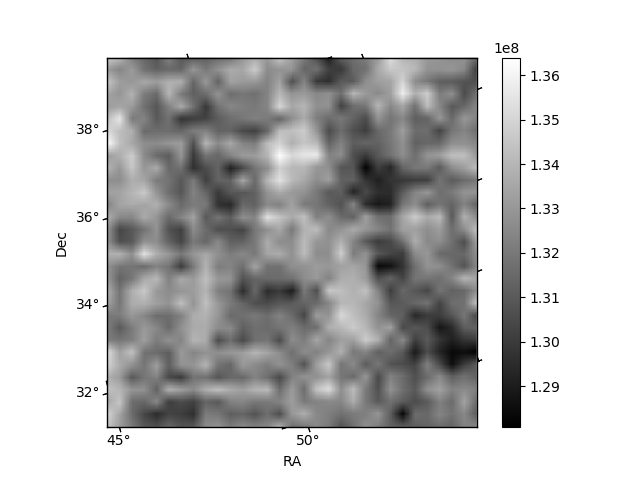
Histogram calculated using DETX and DETY for each event in the final _common_clean file
| Quadrant A |  |
 |
Quadrant B |
|---|---|---|---|
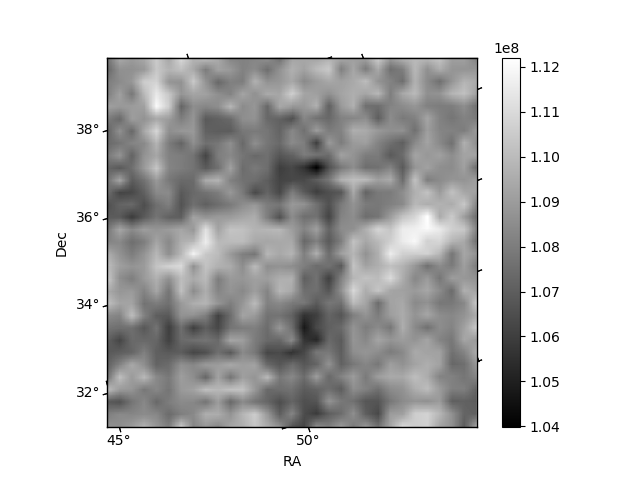
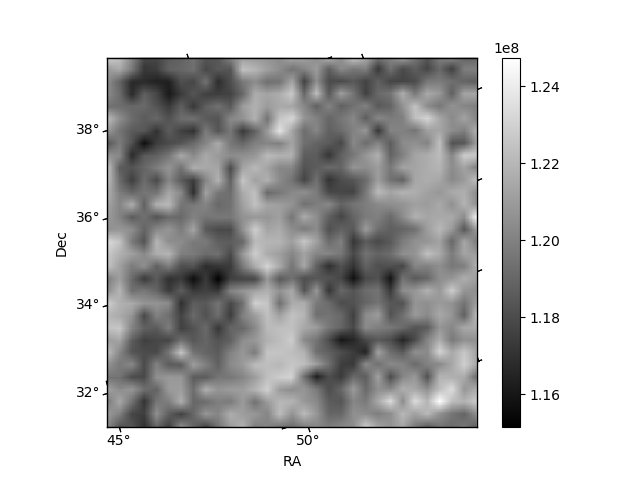
| Quadrant D | 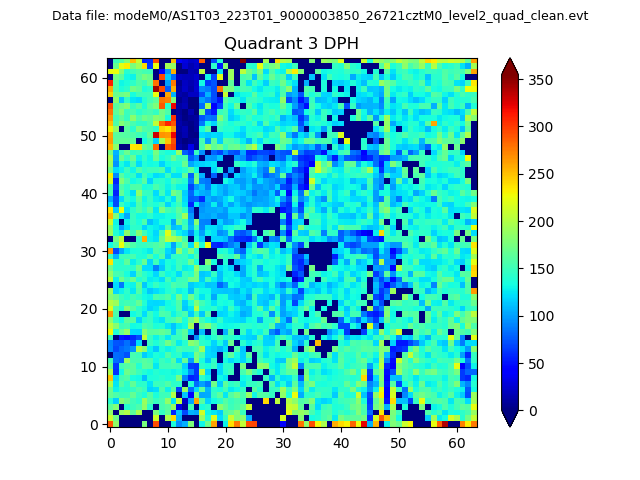 |
 |
Quadrant C |
| Plot type | Count rate plots | Images |
|---|---|---|
| Comparison with Poisson distribution Blue bars denote a histogram of data divided into 1 sec bins. Red curve is a Poisson curve with rate = median count rate of data. |
 |
 |
| Quadrant-wise count rates Data is divided into 100 sec bins |
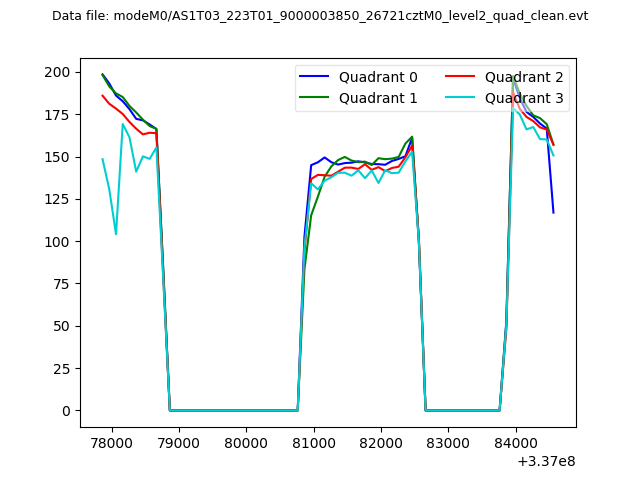 |
|
| Module-wise count rates for Quadrant A Data is divided into 100 sec bins |
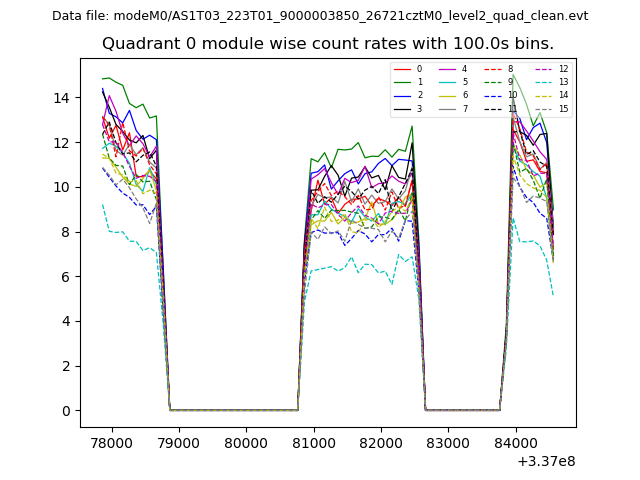 |
 |
| Module-wise count rates for Quadrant B Data is divided into 100 sec bins |
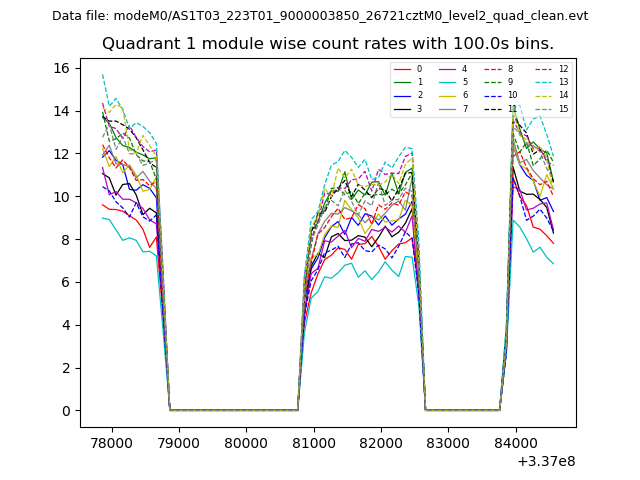 |
 |
| Module-wise count rates for Quadrant C Data is divided into 100 sec bins |
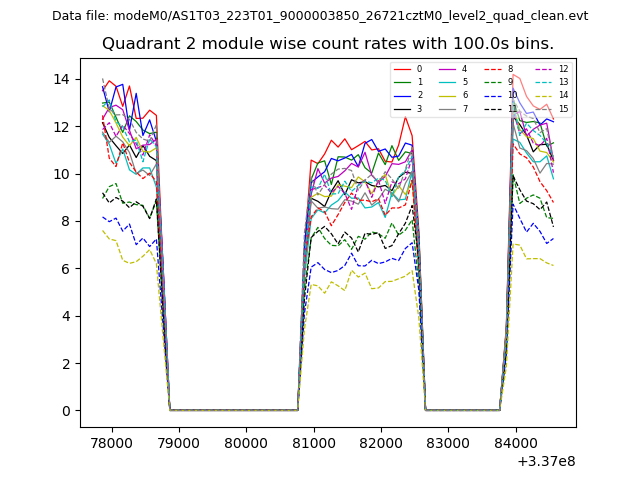 |
 |
| Module-wise count rates for Quadrant D Data is divided into 100 sec bins |
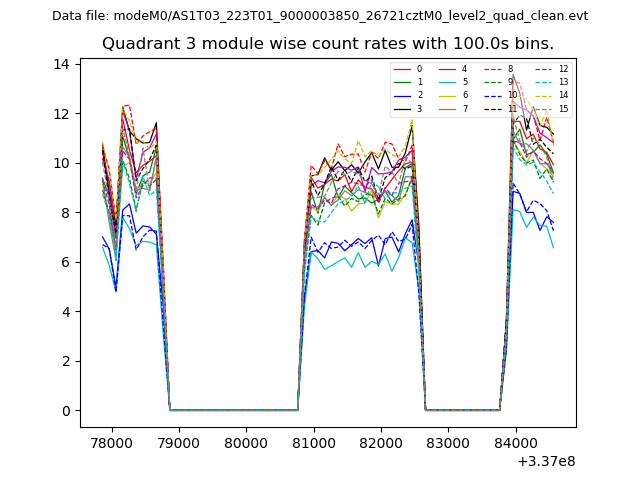 |
 |
| Parameter | Plot |
|---|---|
| CZT HV Monitor | 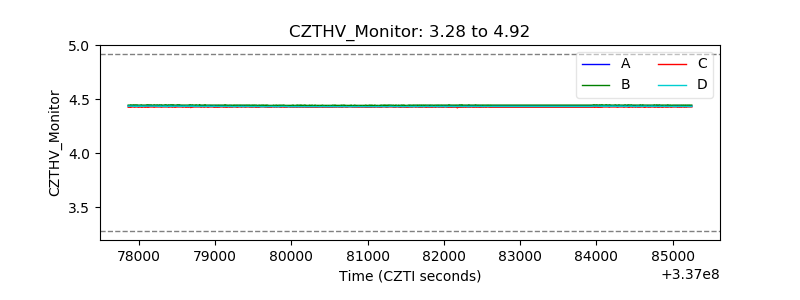 |
| D_VDD | 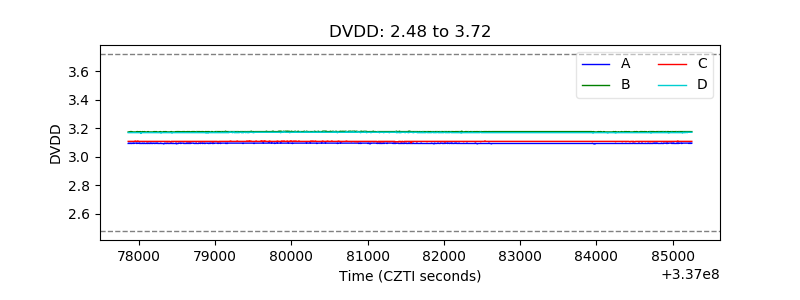 |
| Temperature 1 | 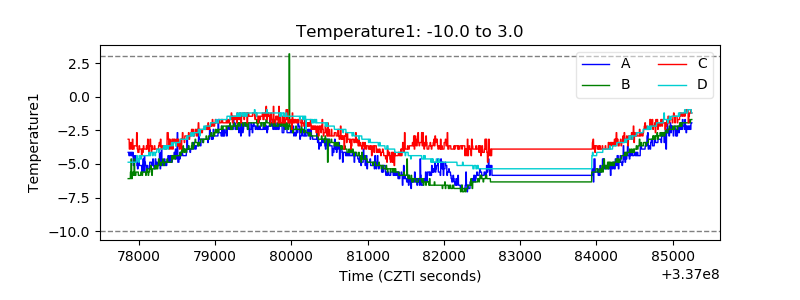 |
| Veto HV Monitor |  |
| Veto LLD | 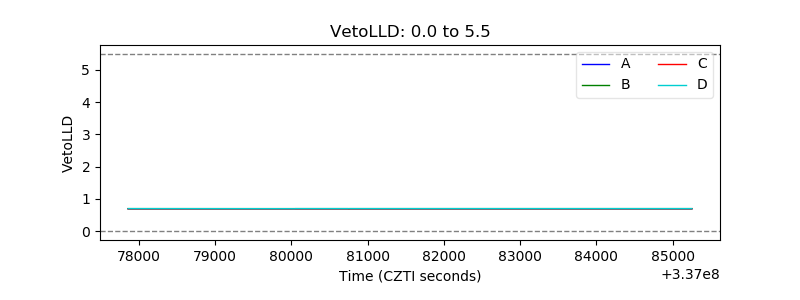 |
| Alpha Counter | 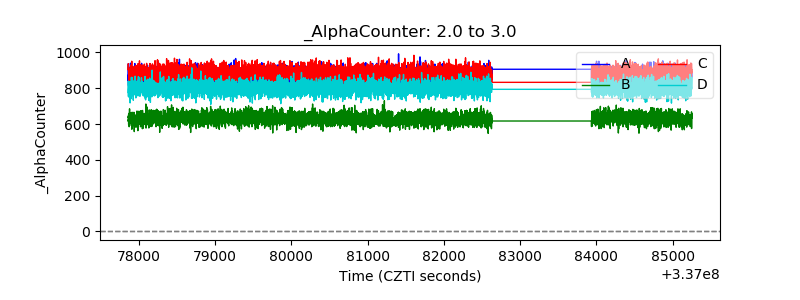 |
| _CPM_Rate | 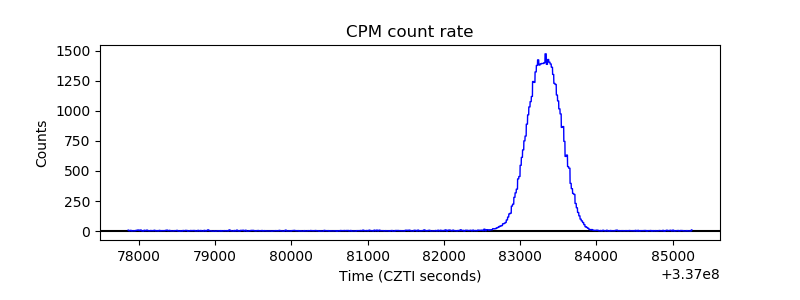 |
| CZT Counter | 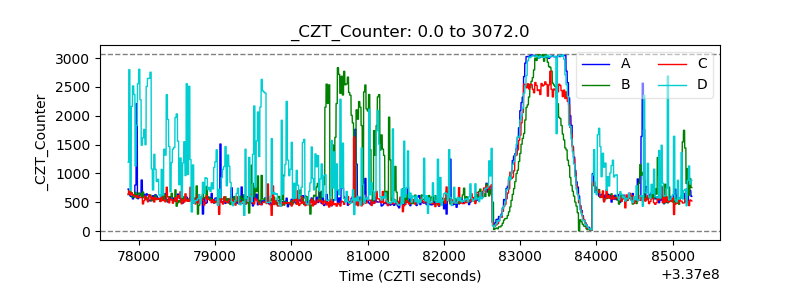 |
| +2.5 Volts monitor | 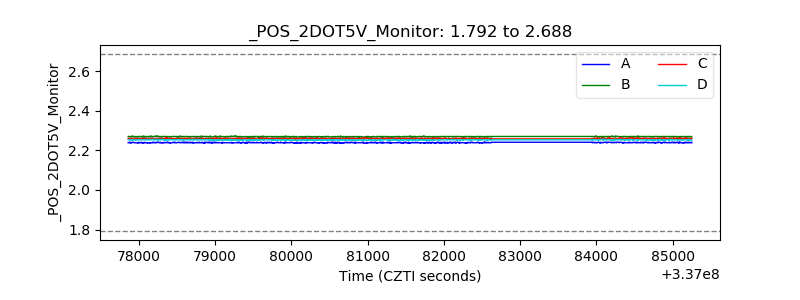 |
| +5 Volts monitor |  |
| _ROLL_ROT | 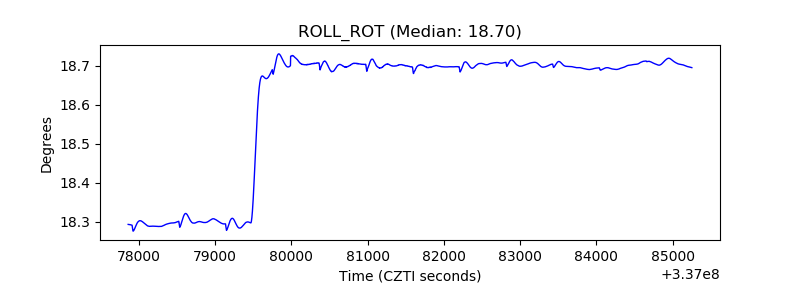 |
| _Roll_DEC | 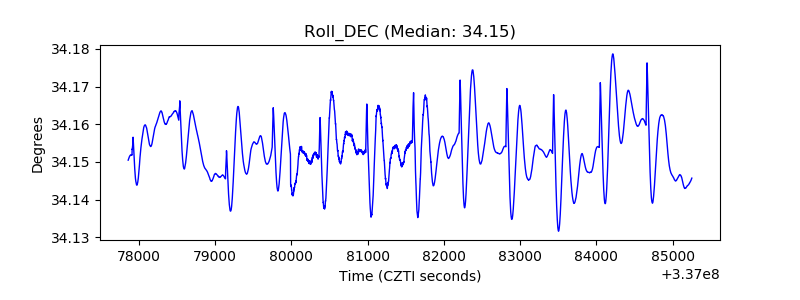 |
| _Roll_RA |  |
| Veto Counter | 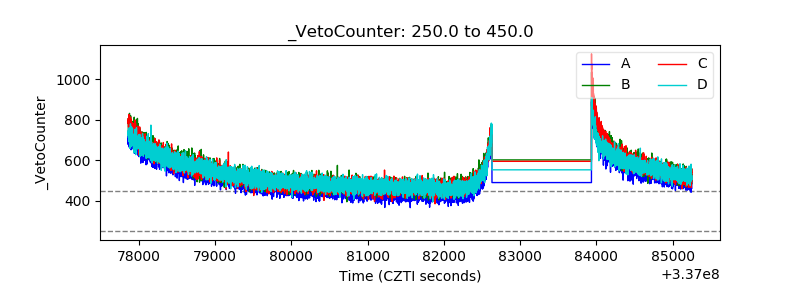 |